'Brain Drain': Geographic Mobility & Elite College Enrollment
The geographic mobility of high school graduates poses a potential challenge (or reward) for states, depending on whether their most academically competitive students choose to remain in their state of residence or migrate outside their home state to attend college. The following visualizations provide an updated snapshot of the out-migration of first-time college enrollees in fall 2016 who attended an elite U.S. college or university. The phenomenon of ‘brain drain’ occurs when highly educated or talented individuals emigrate, taking their human capital (and related economic productivity) with them. For the purpose of these analyses, ‘brain drain’ is operationalized as the number of students who gain admission to and enroll out-of-state at any of the country’s approximately 90 ‘most competitive’ colleges as classified by Barron’s. According to Barron’s methodology, the ‘most competitive’ U.S. colleges typically require the following: (1) high school class rank in the top 10% to 20%; (2) grade averages of A to B+; (3) median college admission test scores between 655 and 800 on the SAT and 29 and above on the ACT; and (4) small share of applicants admitted, typically fewer than one-third. Examples of Barron’s ‘most competitive’ colleges include Ivy League universities (e.g., Princeton University), large public flagships (e.g., University of California at Berkeley), and small private liberal arts colleges (e.g., Colby College).
Figure 1: Location of ‘Most Competitive’ U.S. Colleges
The country’s ‘most competitive’ colleges are not distributed equally across space. Instead they are primarily clustered in the Northeastern U.S. and West Coast. The states with the greatest number of ‘most competitive’ colleges are New York (13), California (12), Massachusetts (11), and Pennsylvania (9). On the other hand, nearly half of U.S. states (24 out of 51, including DC) do not have a ‘most competitive’ college located within their boundaries, particularly states in the South Central and Mountain regions.

Data Source: Barron’s Profiles of American Colleges 2016. Notes: The total number of ‘most competitive’ colleges included in analyses is 89 after excluding the U.S. Service Academies and the School of General Studies at Columbia University, as Columbia University is already included on Barron’s ‘most competitive’ list.
Figure 2: ‘Brain Drain’ Out-Migration
The total number of ‘brain drain’ leavers varies widely across states, ranging from a low of 29 in North Dakota to a high of 7,348 in New York. Other states with the greatest number of ‘brain drain’ leavers after New York include: California (7,307), New Jersey (6,434), Illinois (4,286), and Massachusetts (3,813). So-called ‘brain drain’ leavers pose a potential risk to a state’s economic and intellectual outlook, as high academically achieving high school graduates choose to take their human capital (e.g., skills, productivity) elsewhere. Interpreted from another lens, the low out-migration numbers suggest that some states are substantially underrepresented in elite U.S. higher education. For example, in fall 2016 Arkansas and Mississippi had only 159 and 121 high school graduates, respectively, attend a ‘most competitive’ U.S. college. Though substantial ‘brain drain’ is not optimal for states, some level of geographic mobility to elite higher education is suggestive of college access and educational opportunity for individuals from rural and geographically-distant states.

Data Source: Integrated Postsecondary Education Data System (IPEDS), 2016 Fall Enrollment Survey. Notes: State residency is determined at the time of college admission. Approximately 500 first-time college enrollees at a ‘most competitive’ college in fall 2016 were excluded from analyses due to unknown state residency status. This number reflects less than 0.5% of all ‘most competitive’ college enrollees in that year. Analyses are inspired by Faggian & Franklin (2014) Human Capital Redistribution in the USA: The Migration of the College Bound.
Figure 3: ‘Brain Drain’ In-Migration
The total number of ‘brain drain’ incomers also varies widely across states. For the 24 states without a ‘most competitive’ college (a mechanism that can draw in the most academically competitive high school graduates), the number of ‘brain drain’ incomers is zero. For the 27 states with at least one ‘most competitive’ college, the number of ‘brain drain’ incomers ranges from a low of 239 in Washington to a high of 9,700 in New York. Other states with the greatest number of ‘brain drain’ incomers after New York include: Massachusetts (8,234), Pennsylvania (6,278), California (5,431), and Ohio (3,531). So-called ‘brain drain’ incomers could prove to be advantageous for states, as they acquire highly skilled individuals who may contribute to their local economy and intellectual vibrancy.
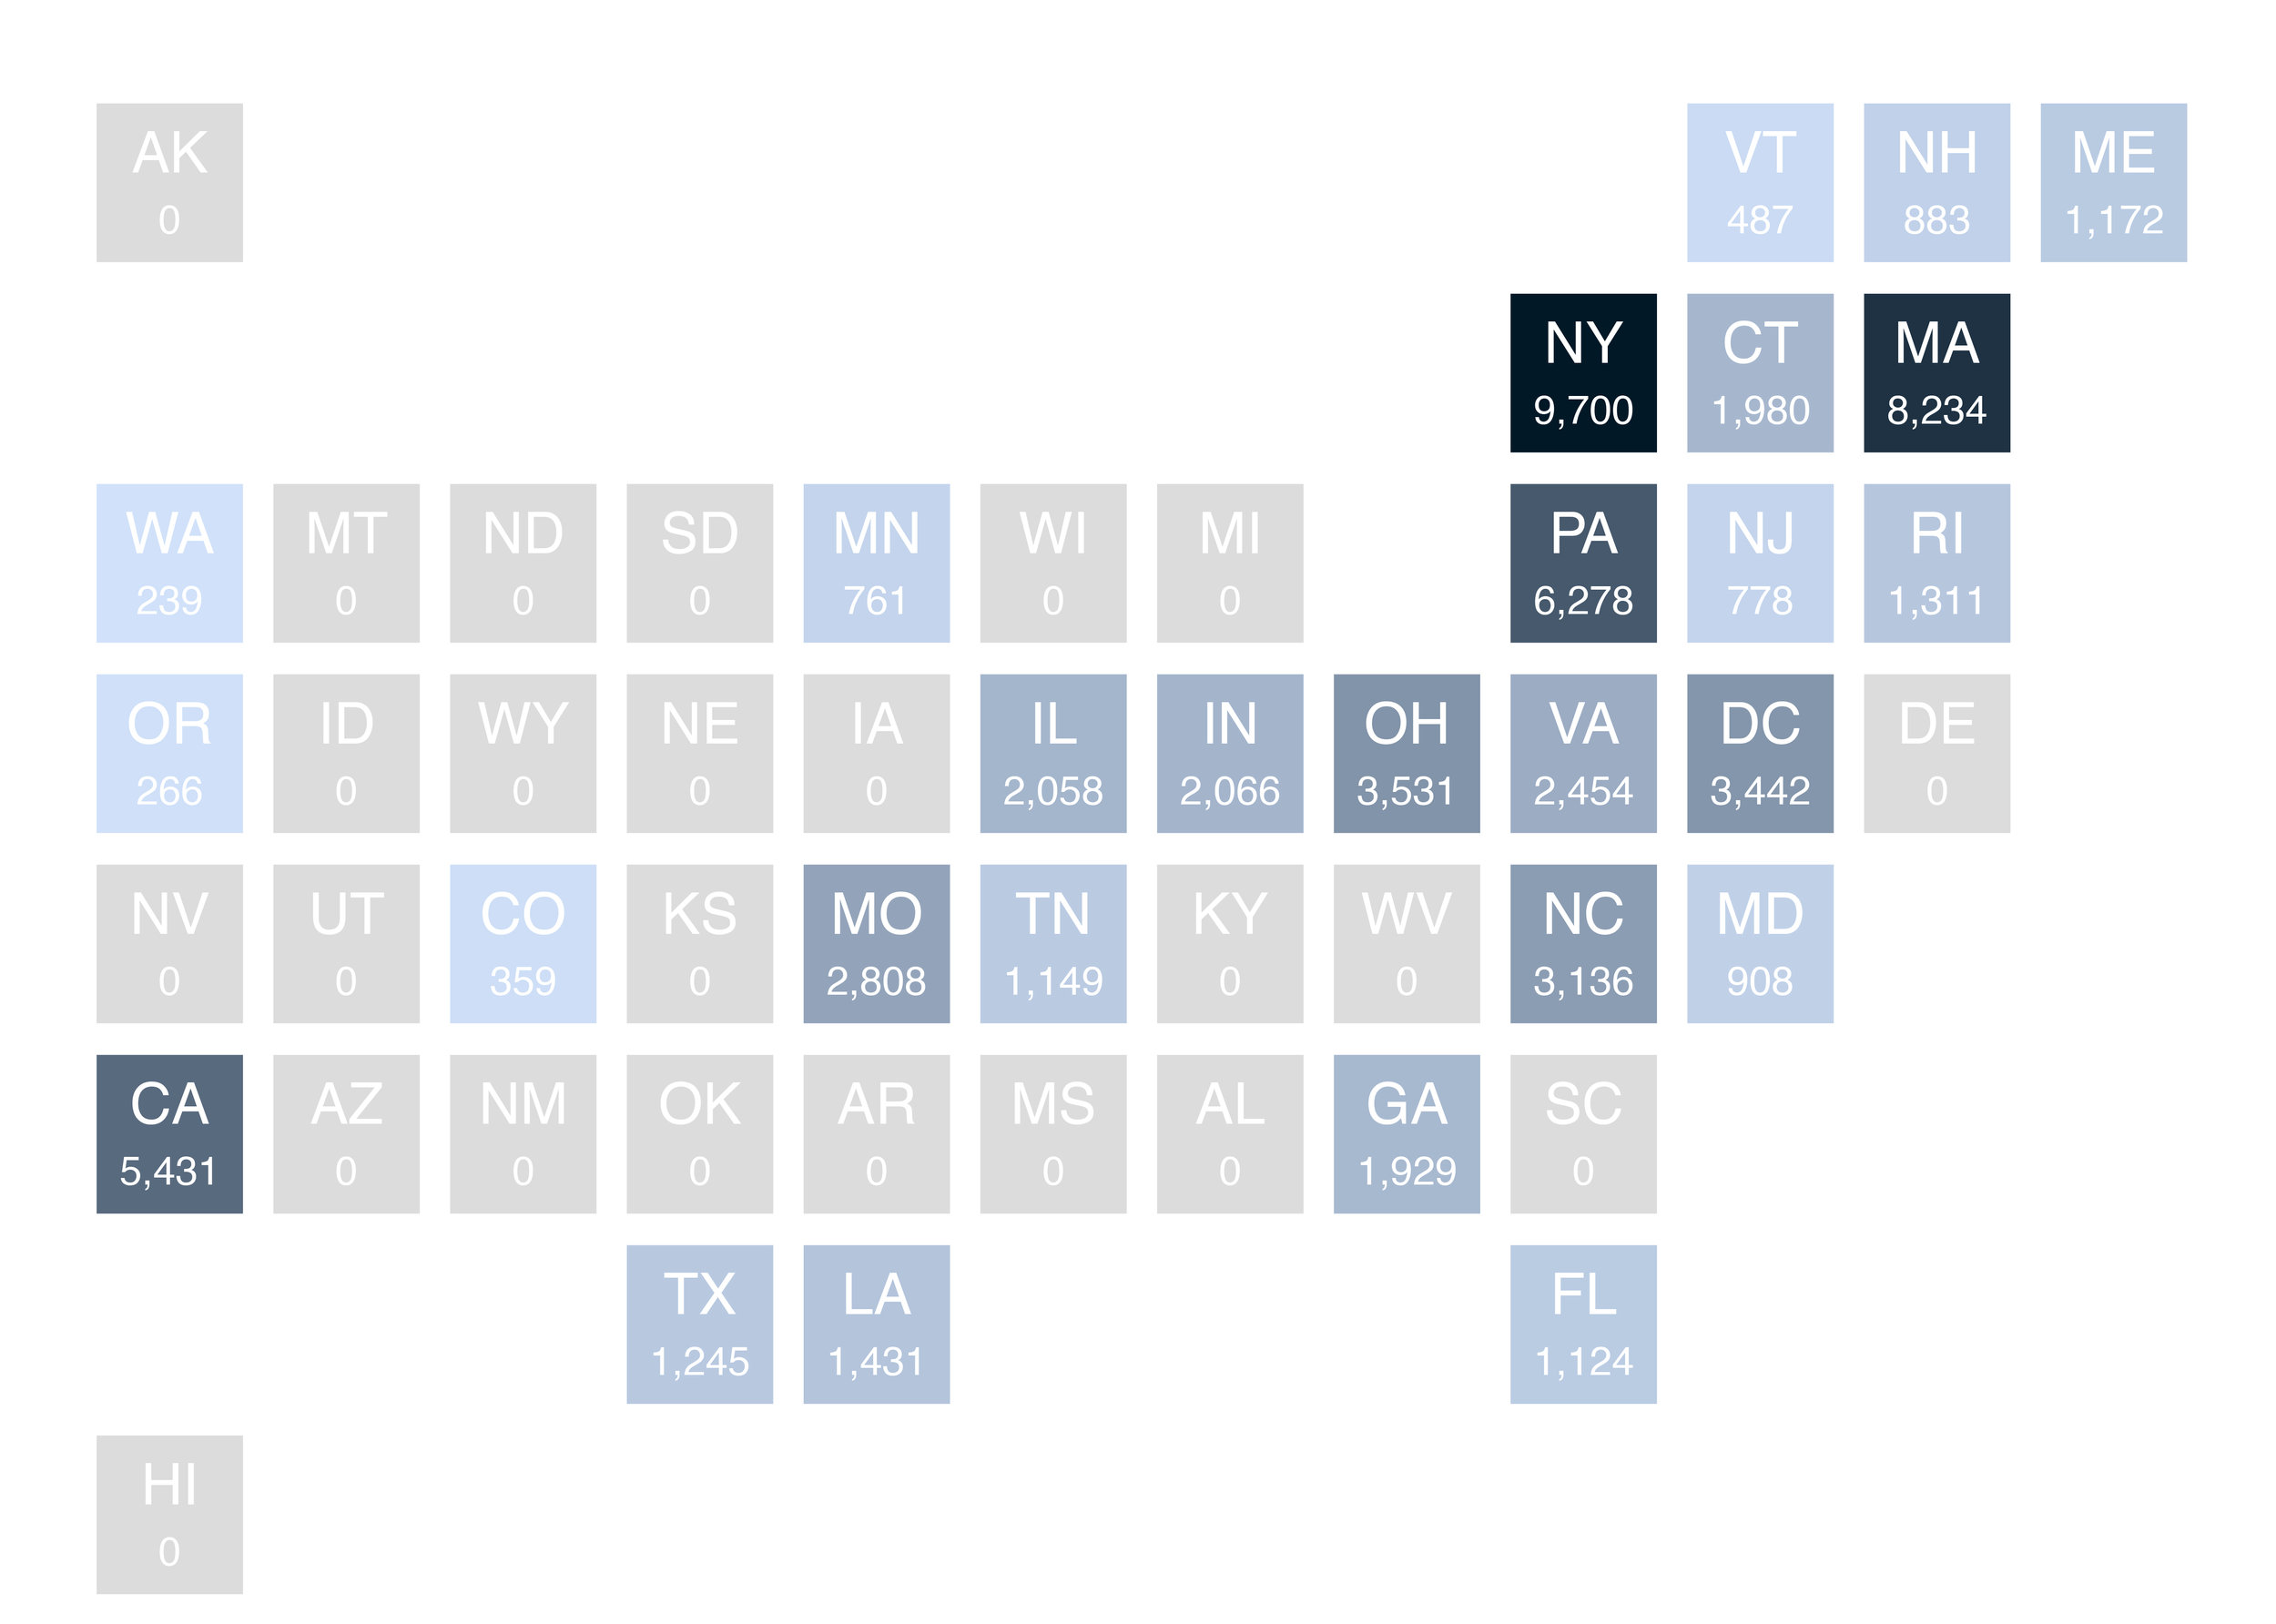
Data Source: Integrated Postsecondary Education Data System (IPEDS), 2016 Fall Enrollment Survey. Notes: State residency is determined at the time of college admission. Approximately 500 first-time college enrollees at a ‘most competitive’ college in fall 2016 were excluded from analyses due to unknown state residency status. This number reflects less than 0.5% of all ‘most competitive’ college enrollees in that year. Analyses are inspired by Faggian & Franklin (2014) Human Capital Redistribution in the USA: The Migration of the College Bound.
Figure 4a: ‘Brain Drain’ Net Migration Map
Combining a state’s total number of ‘brain drain’ leavers with incomers yields a net count of how many of the country’s most academically competitive (and geographically mobile) high school graduates it either gained or lost. States with the greatest overall net gain in ‘brain drain’ incomers include: Massachusetts (4,421), Pennsylvania (3,401), the District of Columbia (3,096), New York (2,352), and Ohio (2,166). Mid-Atlantic states generally had positive net gains in ‘brain drain’ incomers, likely a function of their robust elite higher education infrastructure (Figure 1) and the geographic proximity and relative ease of travel among these states. States with the greatest overall net loss in ‘brain drain’ leavers include: New Jersey (-5,656), Illinois (-2,228), Florida (-2,204), Texas (-1,955), and California (-1,876). New Jersey has long experienced ‘brain drain’ within its education and workforce sectors. Among recent New Jersey high school graduates who enrolled in an out-of-state ‘most competitive’ college in fall 2016, 23% enrolled in New York, 19% in Pennsylvania, and 14% in Massachusetts. And even though California is home to 12 ‘most competitive’ U.S. colleges, the state also experienced a net loss in ‘brain drain’ leavers. Among recent California high school graduates who enrolled in an out-of-state ‘most competitive’ college in fall 2016, 22% enrolled in New York and 19% in Massachusetts (proving to be exceptionally geographically mobile).

Data Source: Integrated Postsecondary Education Data System (IPEDS), 2016 Fall Enrollment Survey. Notes: State residency is determined at the time of college admission. Approximately 500 first-time college enrollees at a ‘most competitive’ college in fall 2016 were excluded from analyses due to unknown state residency status. This number reflects less than 0.5% of all ‘most competitive’ college enrollees in that year. Analyses are inspired by Faggian & Franklin (2014) Human Capital Redistribution in the USA: The Migration of the College Bound.
Figure 4b: ‘Brain Drain’ Net Migration Chart
The figure below displays the same net migration data points as above in a lollipop chart. The majority of states (28 out of 51, including DC) have between ± 500 students who in- or out-migrate to attend a ‘most competitive’ college. For these states, ‘brain drain’ is minimal. For states on either end of the chart, ‘brain drain’ poses an opportunity (or challenge) to advancing (or sustaining) the human capital of the emerging generation of residents. States that can attract talented college enrollees (or at the least prevent their homegrown talent from out-migrating) benefit from their skills and abilities, helping to ensure economic and intellectual well-being for all.

Data Source: Integrated Postsecondary Education Data System (IPEDS), 2016 Fall Enrollment Survey. Notes: State residency is determined at the time of college admission. Approximately 500 first-time college enrollees at a ‘most competitive’ college in fall 2016 were excluded from analyses due to unknown state residency status. This number reflects less than 0.5% of all ‘most competitive’ college enrollees in that year. Analyses are inspired by Faggian & Franklin (2014) Human Capital Redistribution in the USA: The Migration of the College Bound.