Going With the Flow: Following Student Out-Migration to College

In fall 2018, 80% of first-time degree/certificate-seeking undergraduates remained in their states of residence to attend college, while 20% out-migrated to attend college in a different state. Where did this minority of geographically mobile students go? The following visualizations explore student out-migration to college using the most recent national data on enrollment and residence from the Integrated Postsecondary Education Data System. Exhibit A is a choropleth map with each state colored to reflect the share of residents out-migrating to attend college. Exhibit B is a gallery of flow maps that visualize the migratory patterns of each state’s population of college-goers who leave the state to attend college elsewhere. Finally, Exhibit C presents an interactive data table listing the top 25 out-of-state college destinations (by out-migration enrollment count) for each state. All exhibits reflect recent high school graduates who attended college for the first-time and sought a degree or certificate in fall 2018.

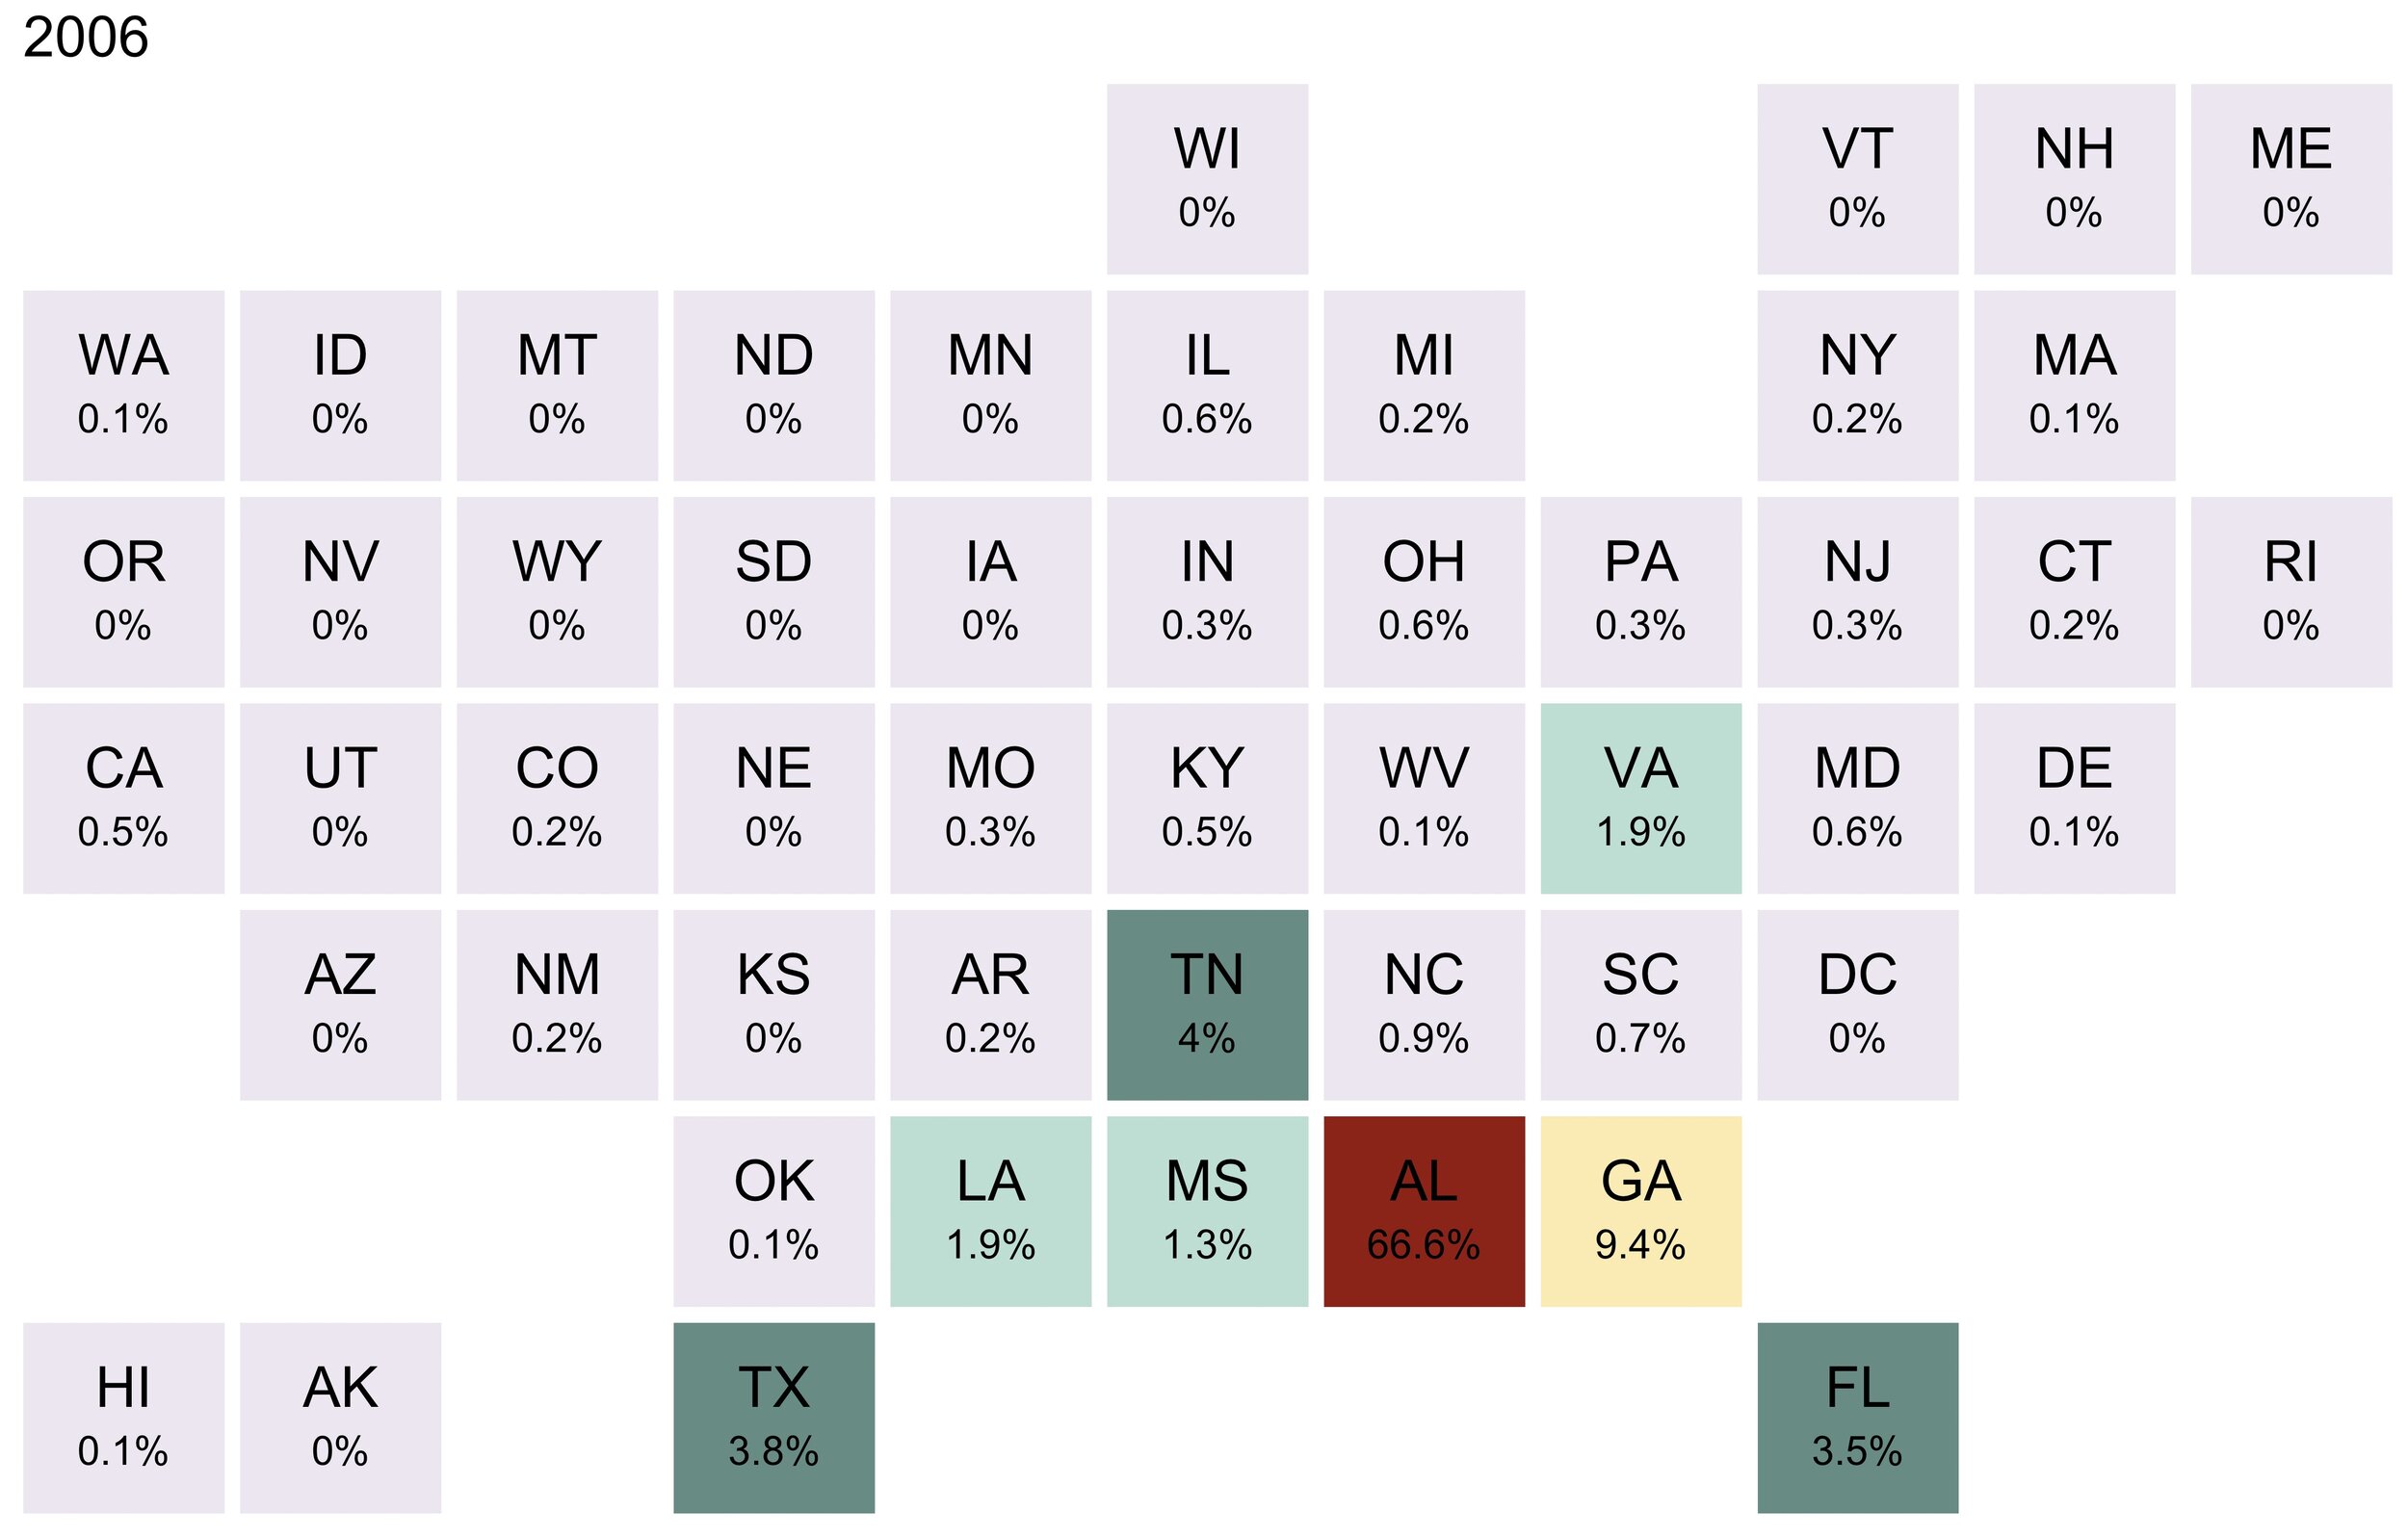
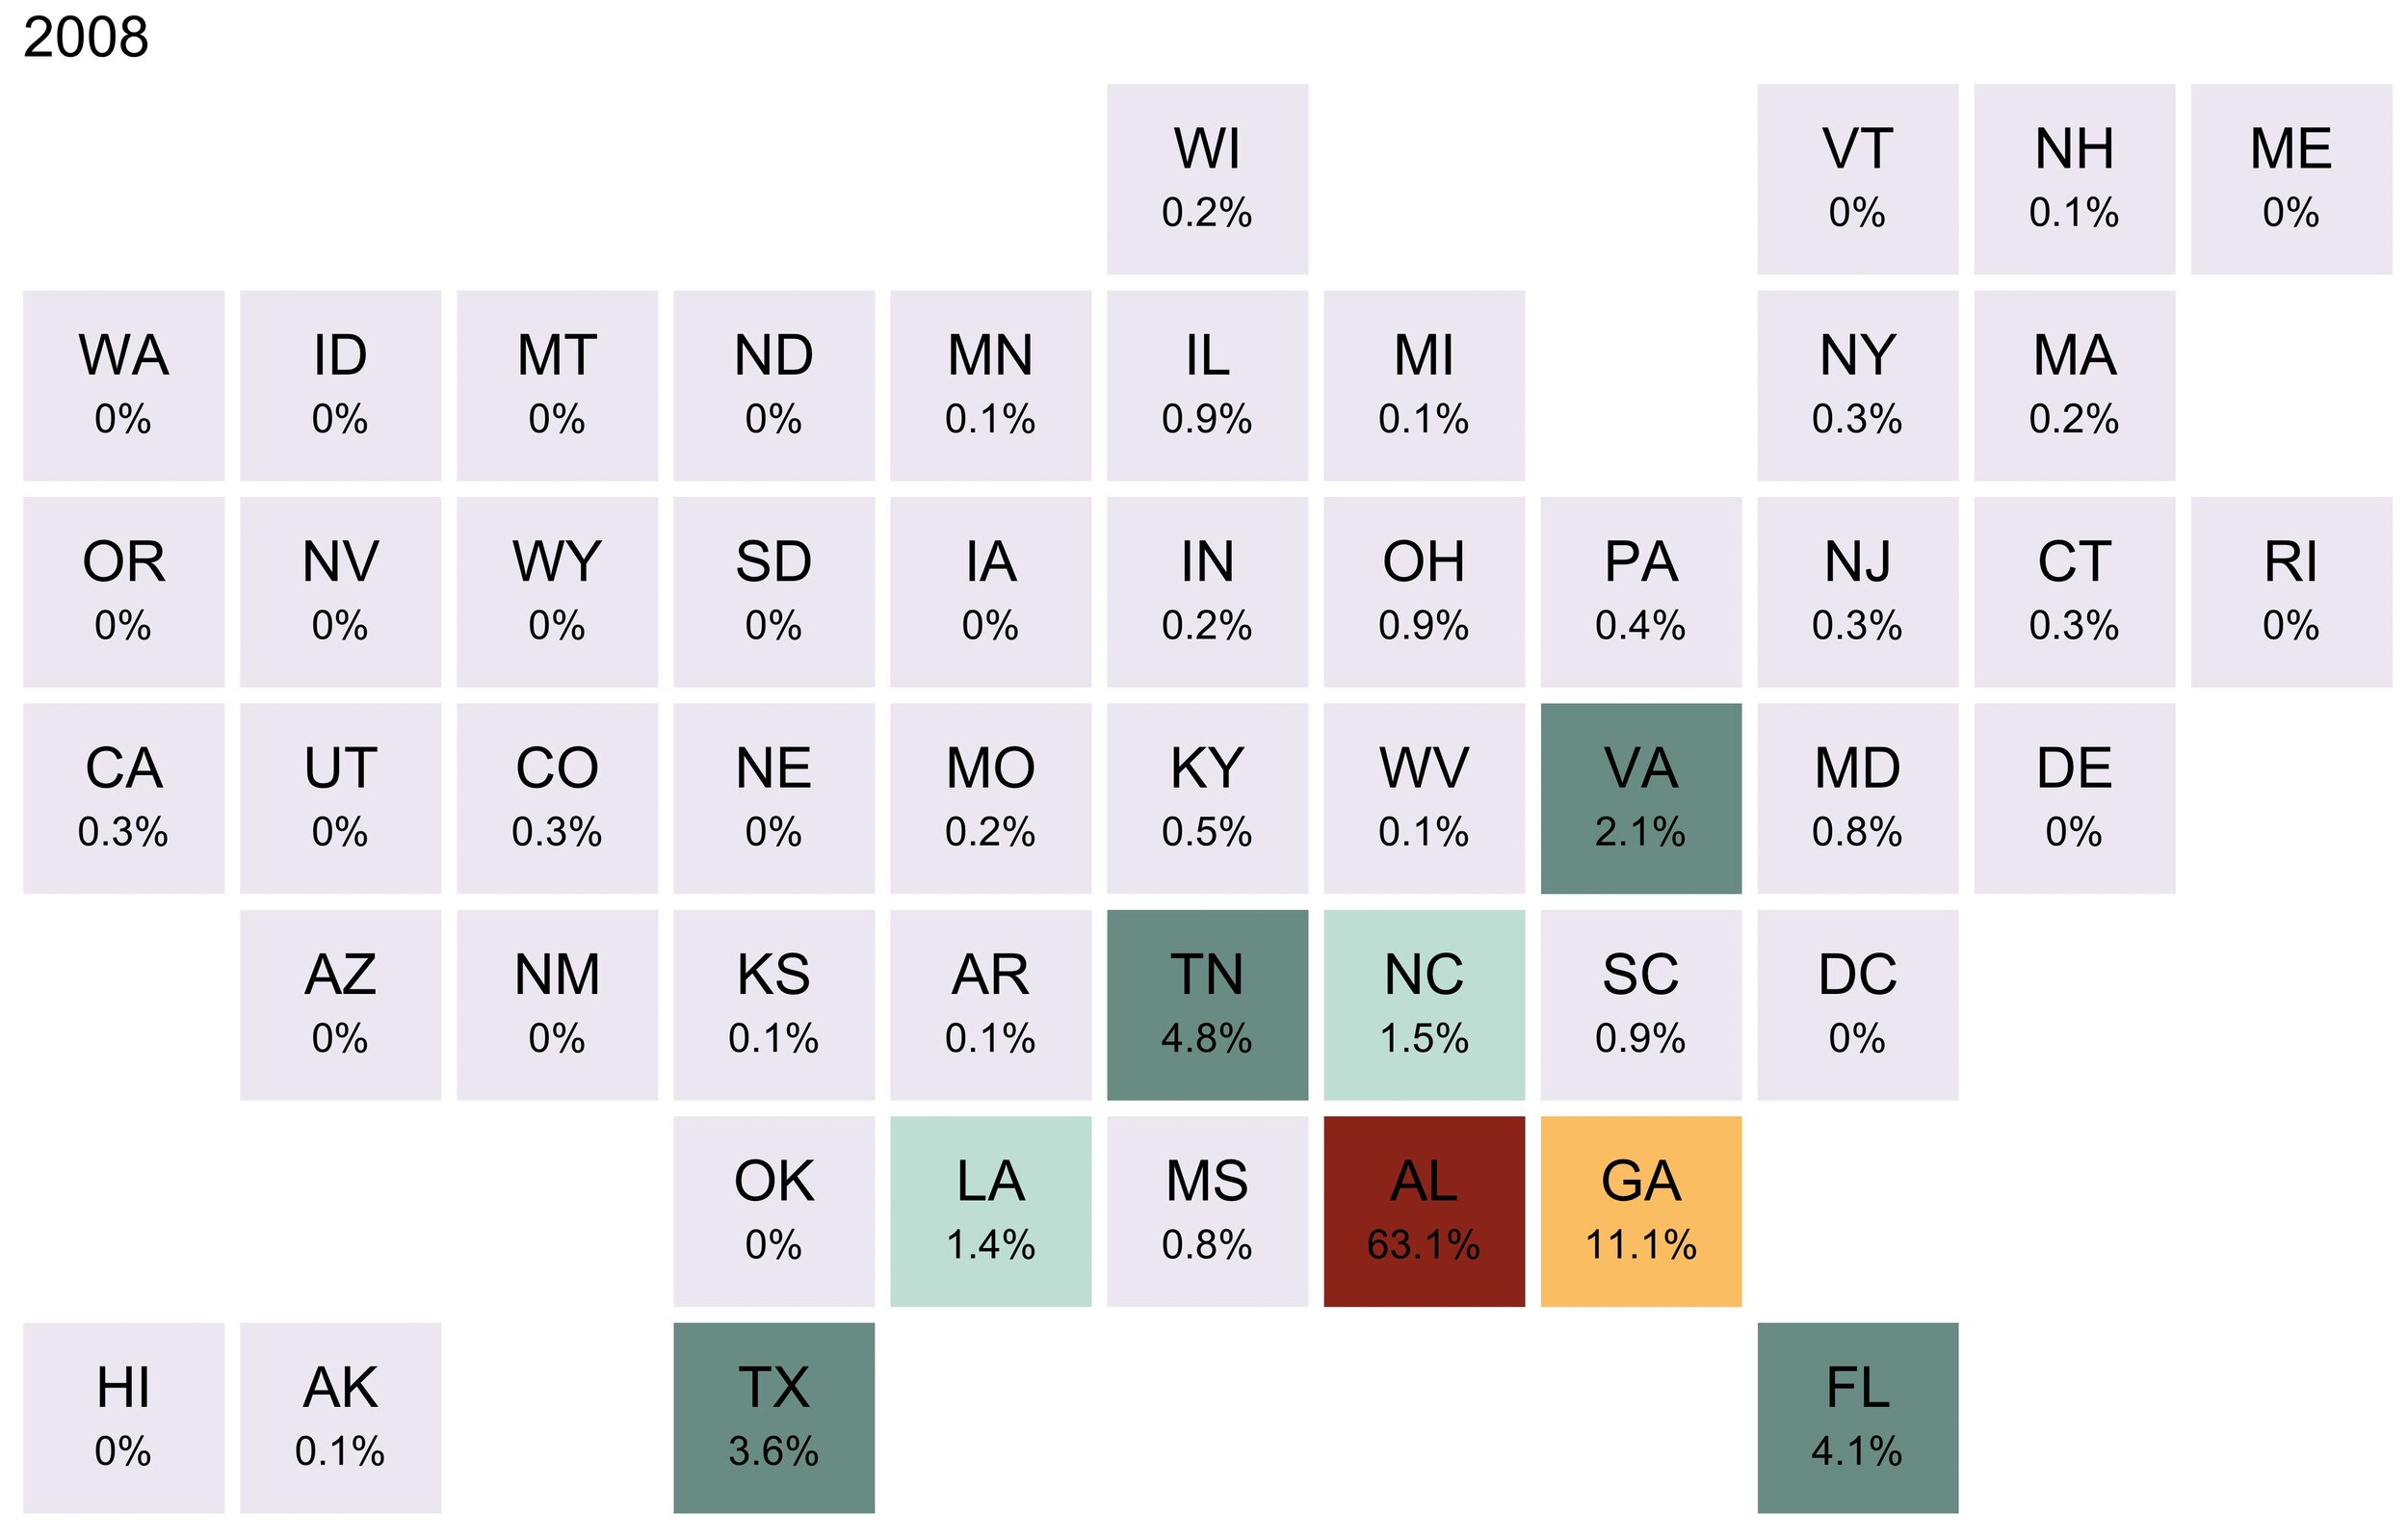
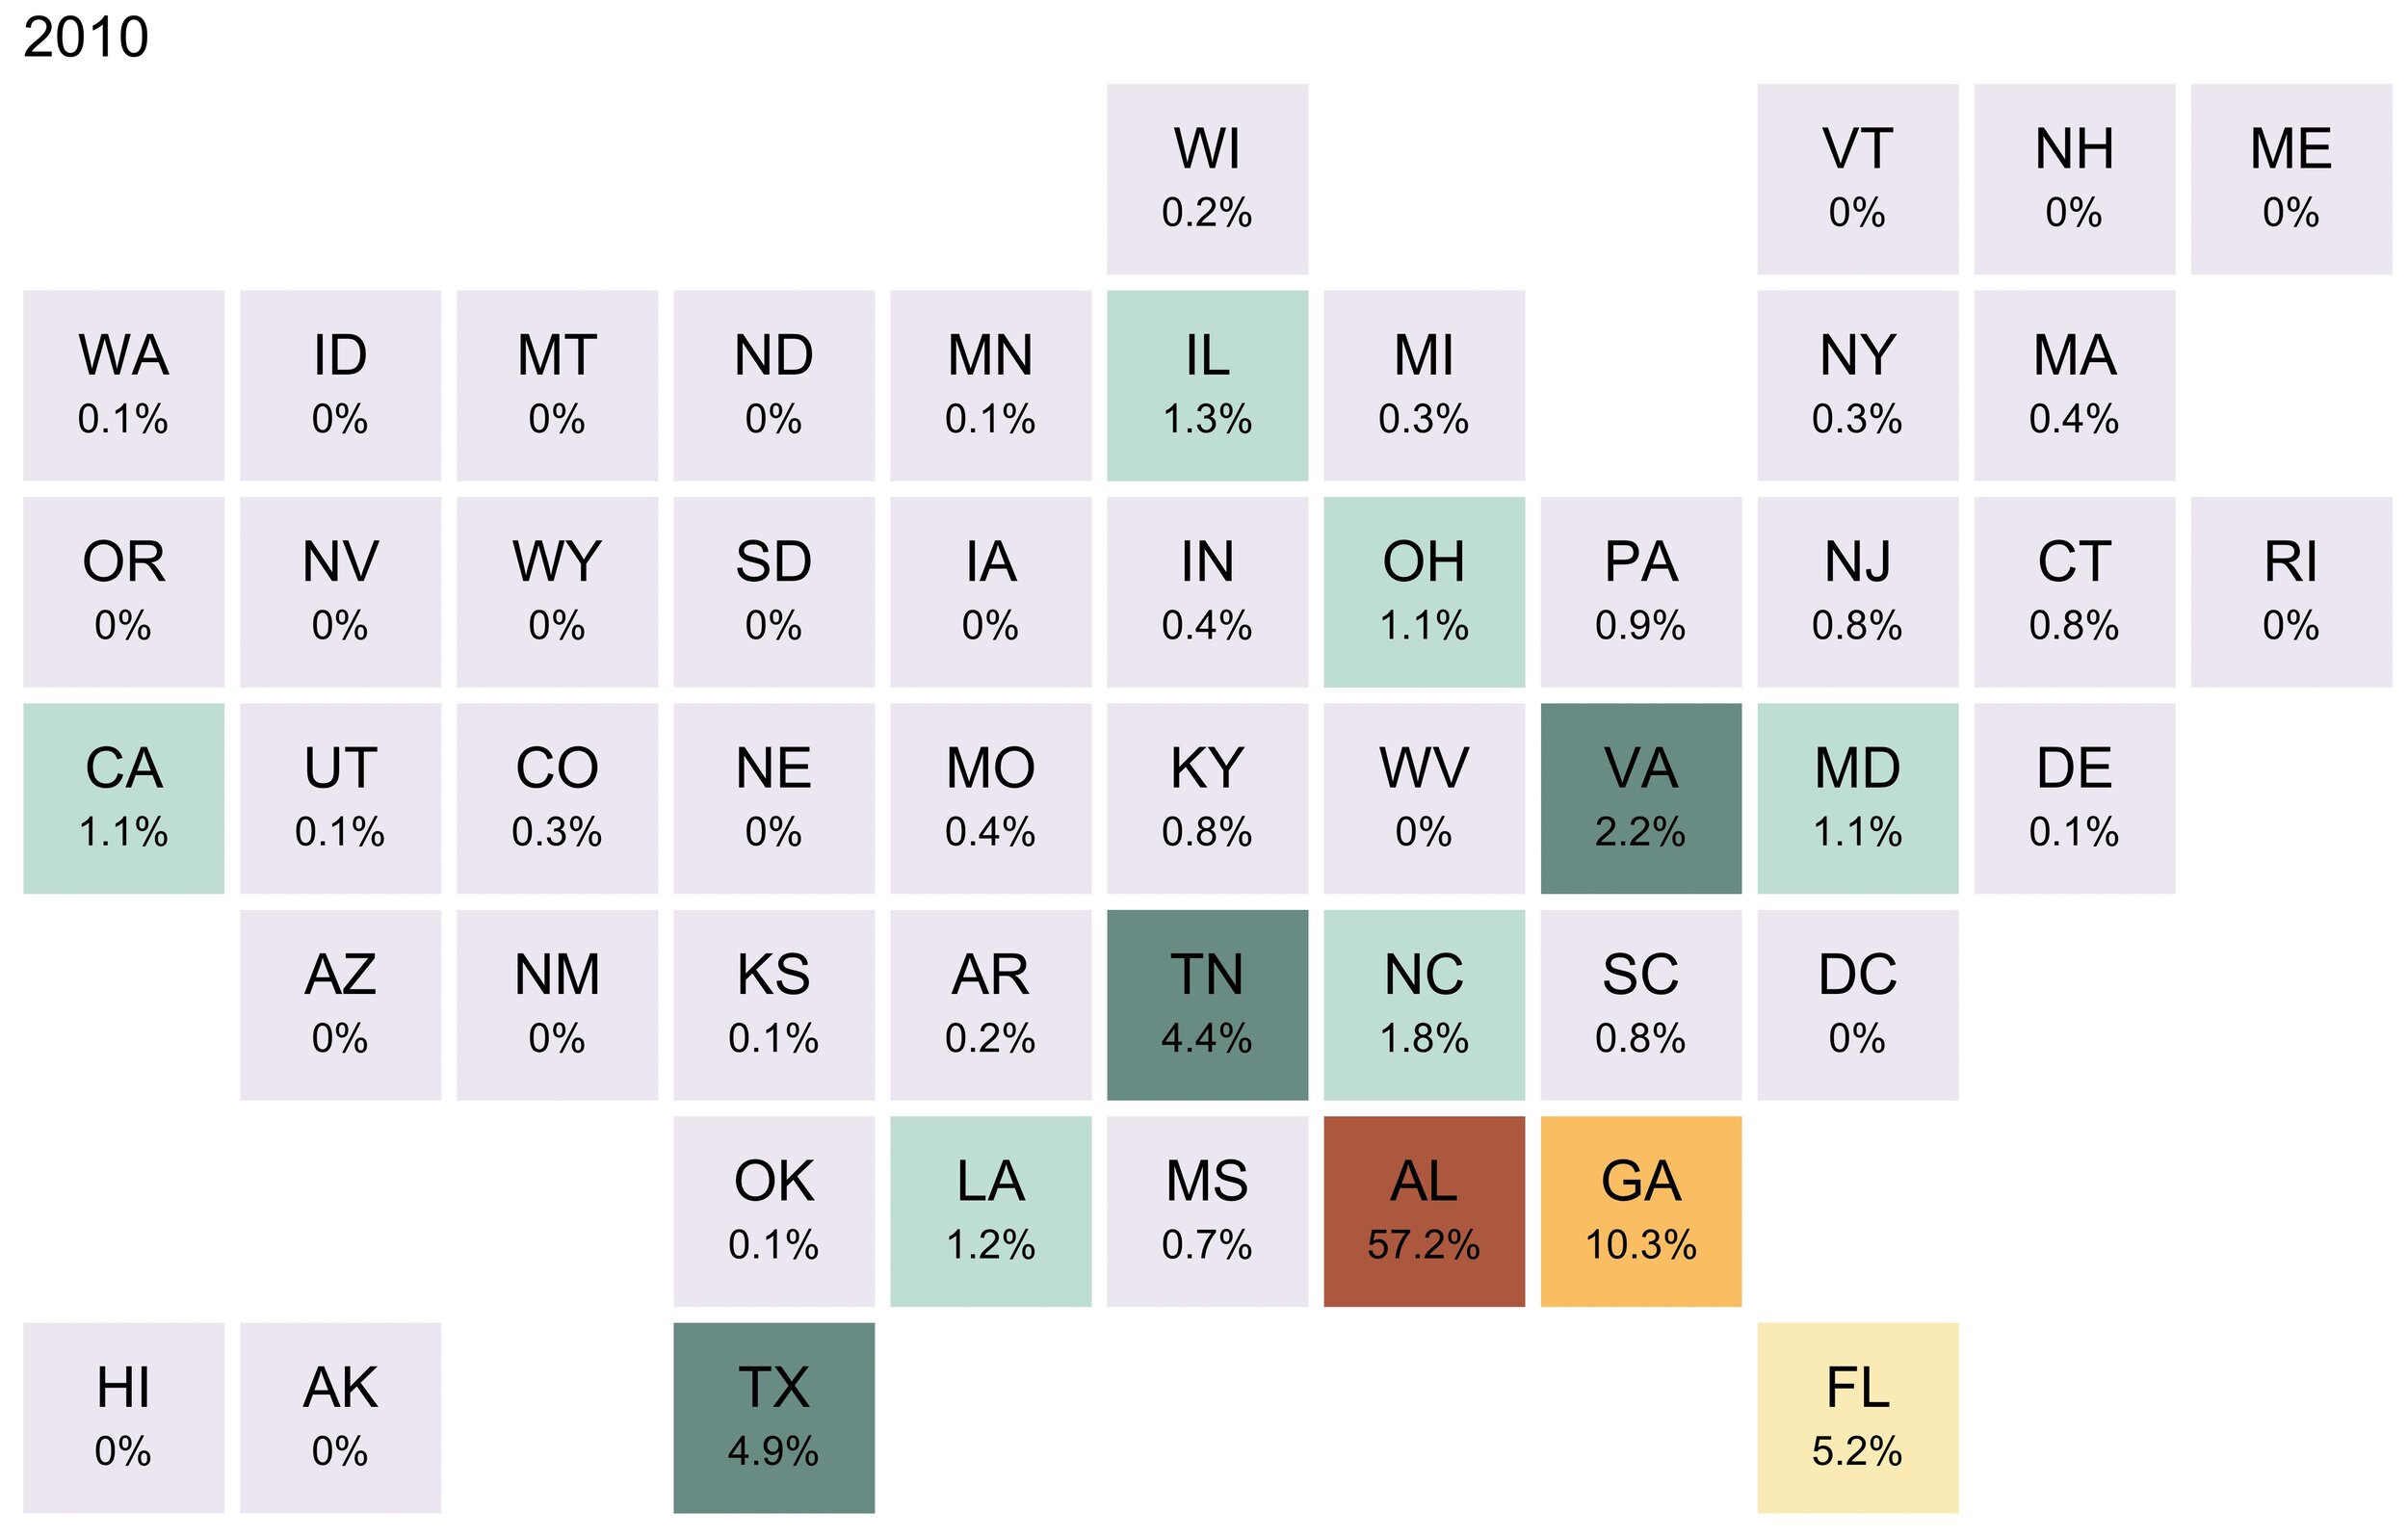
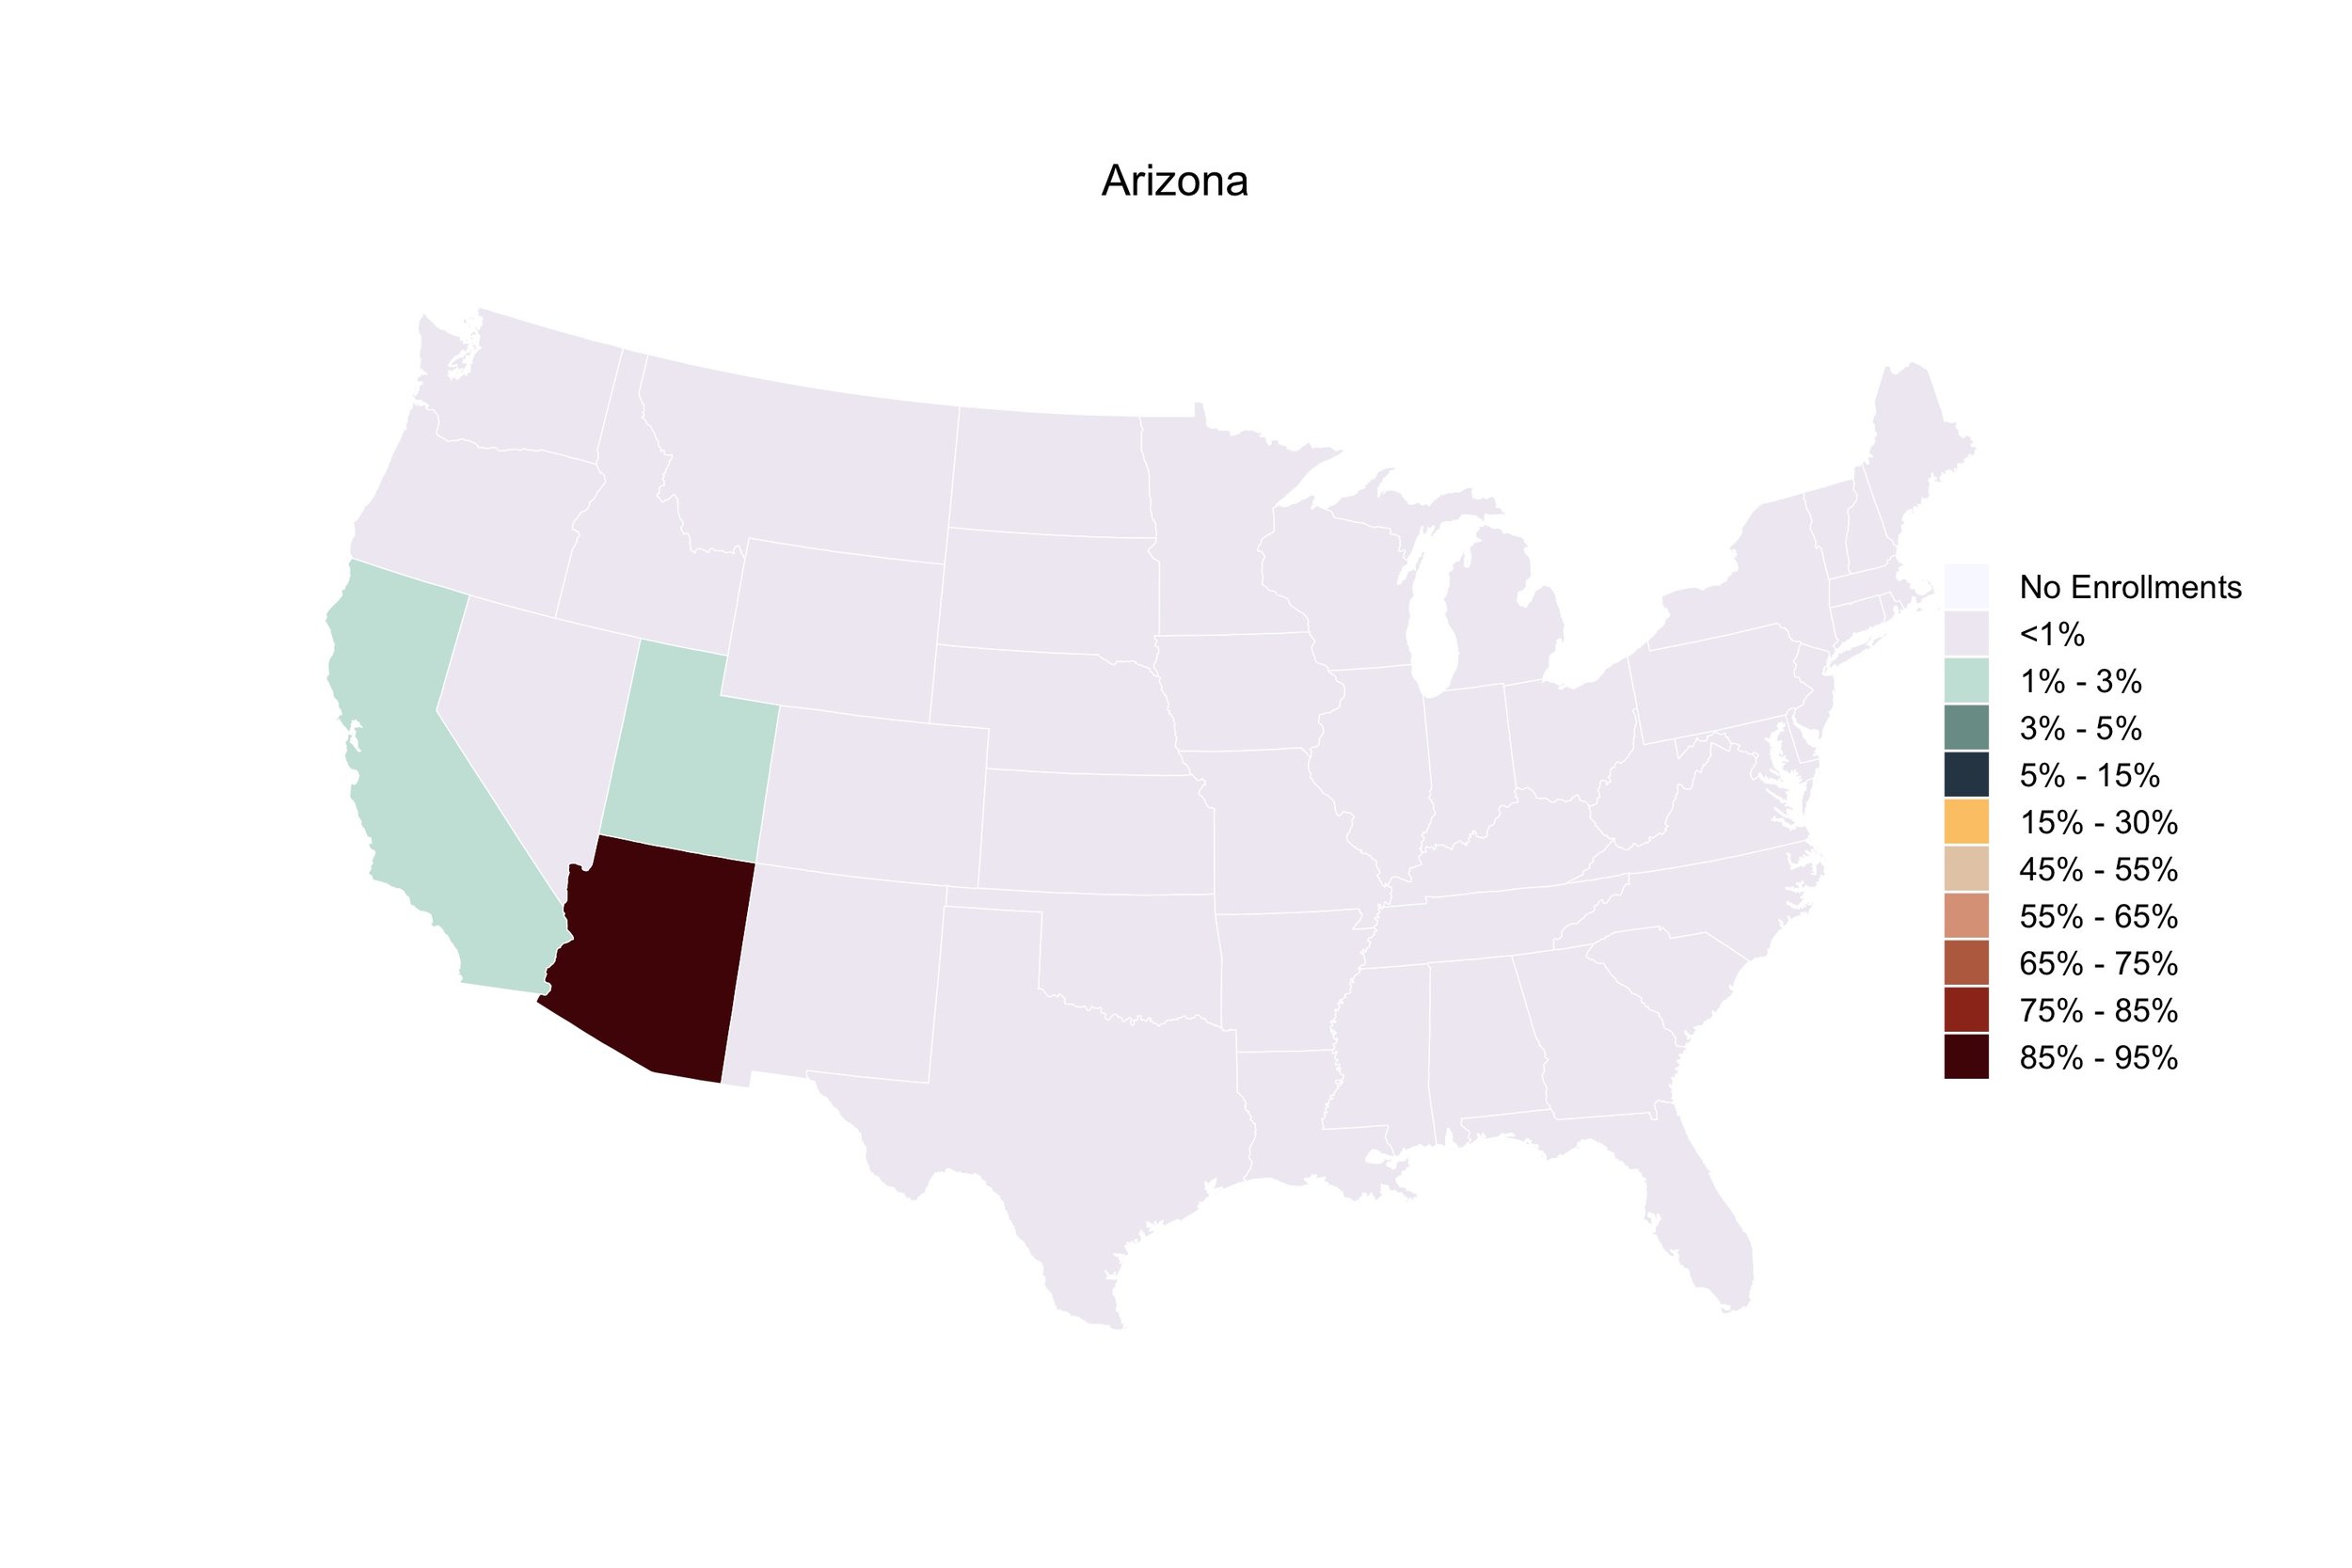
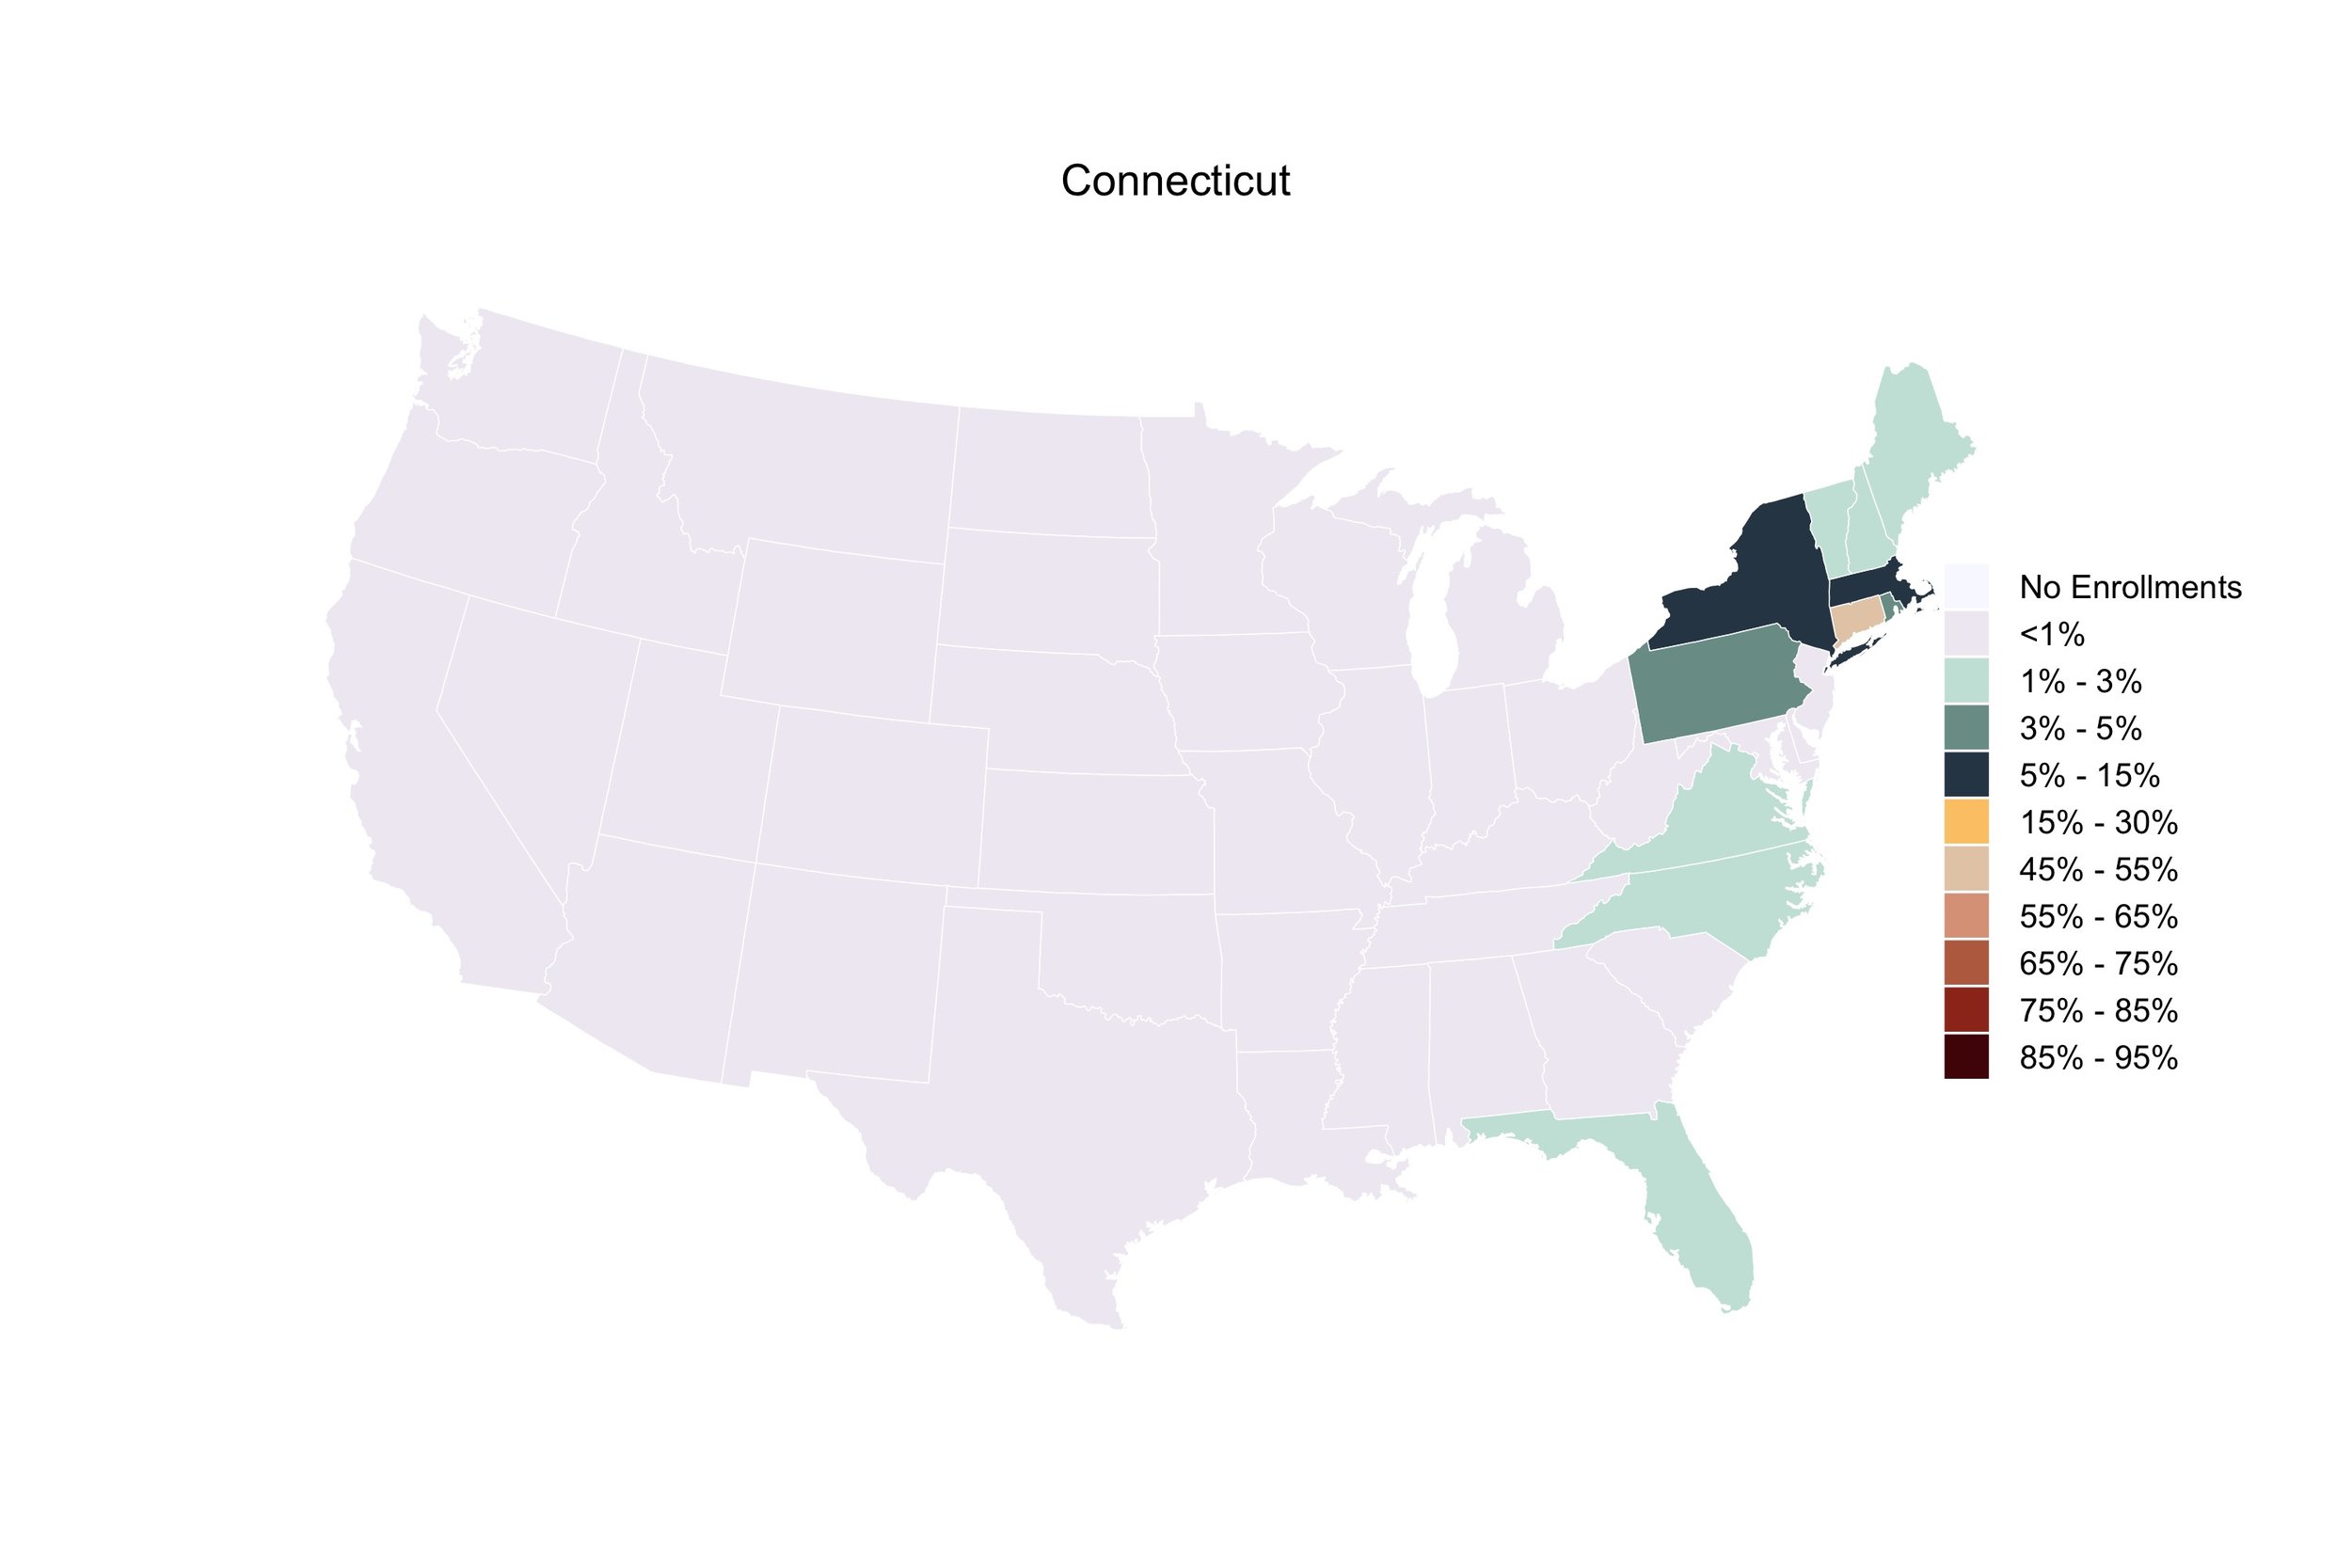
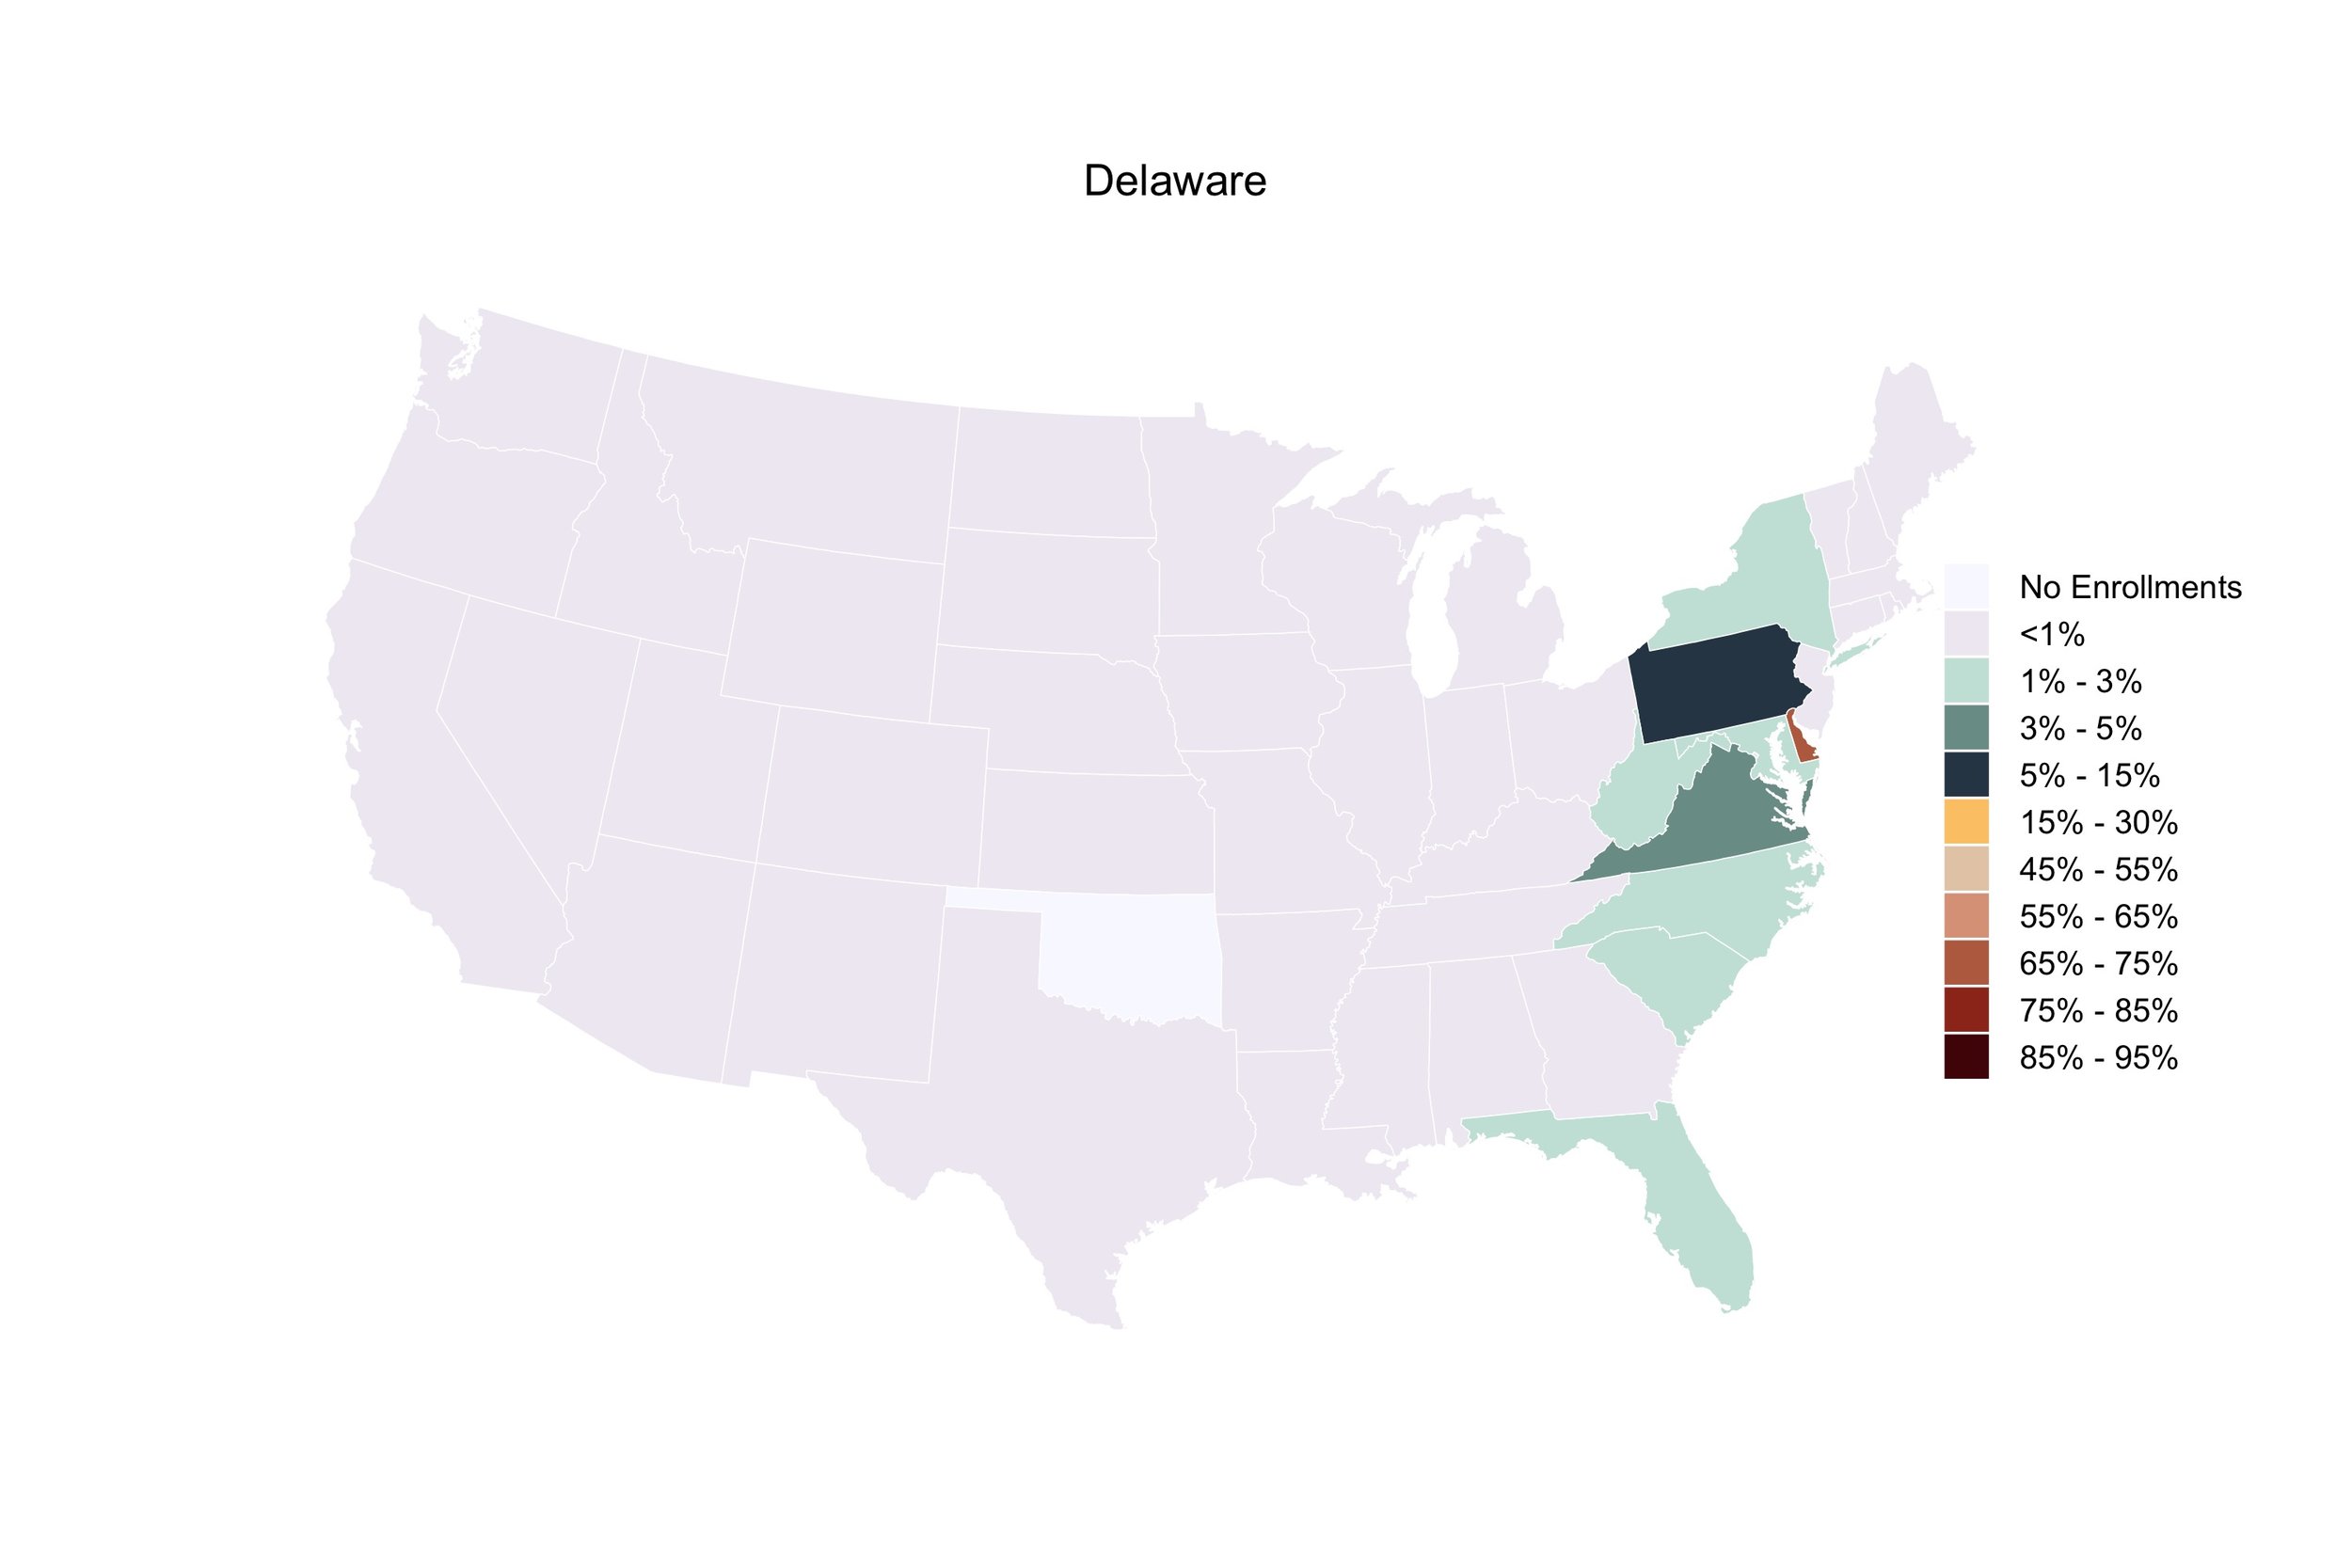
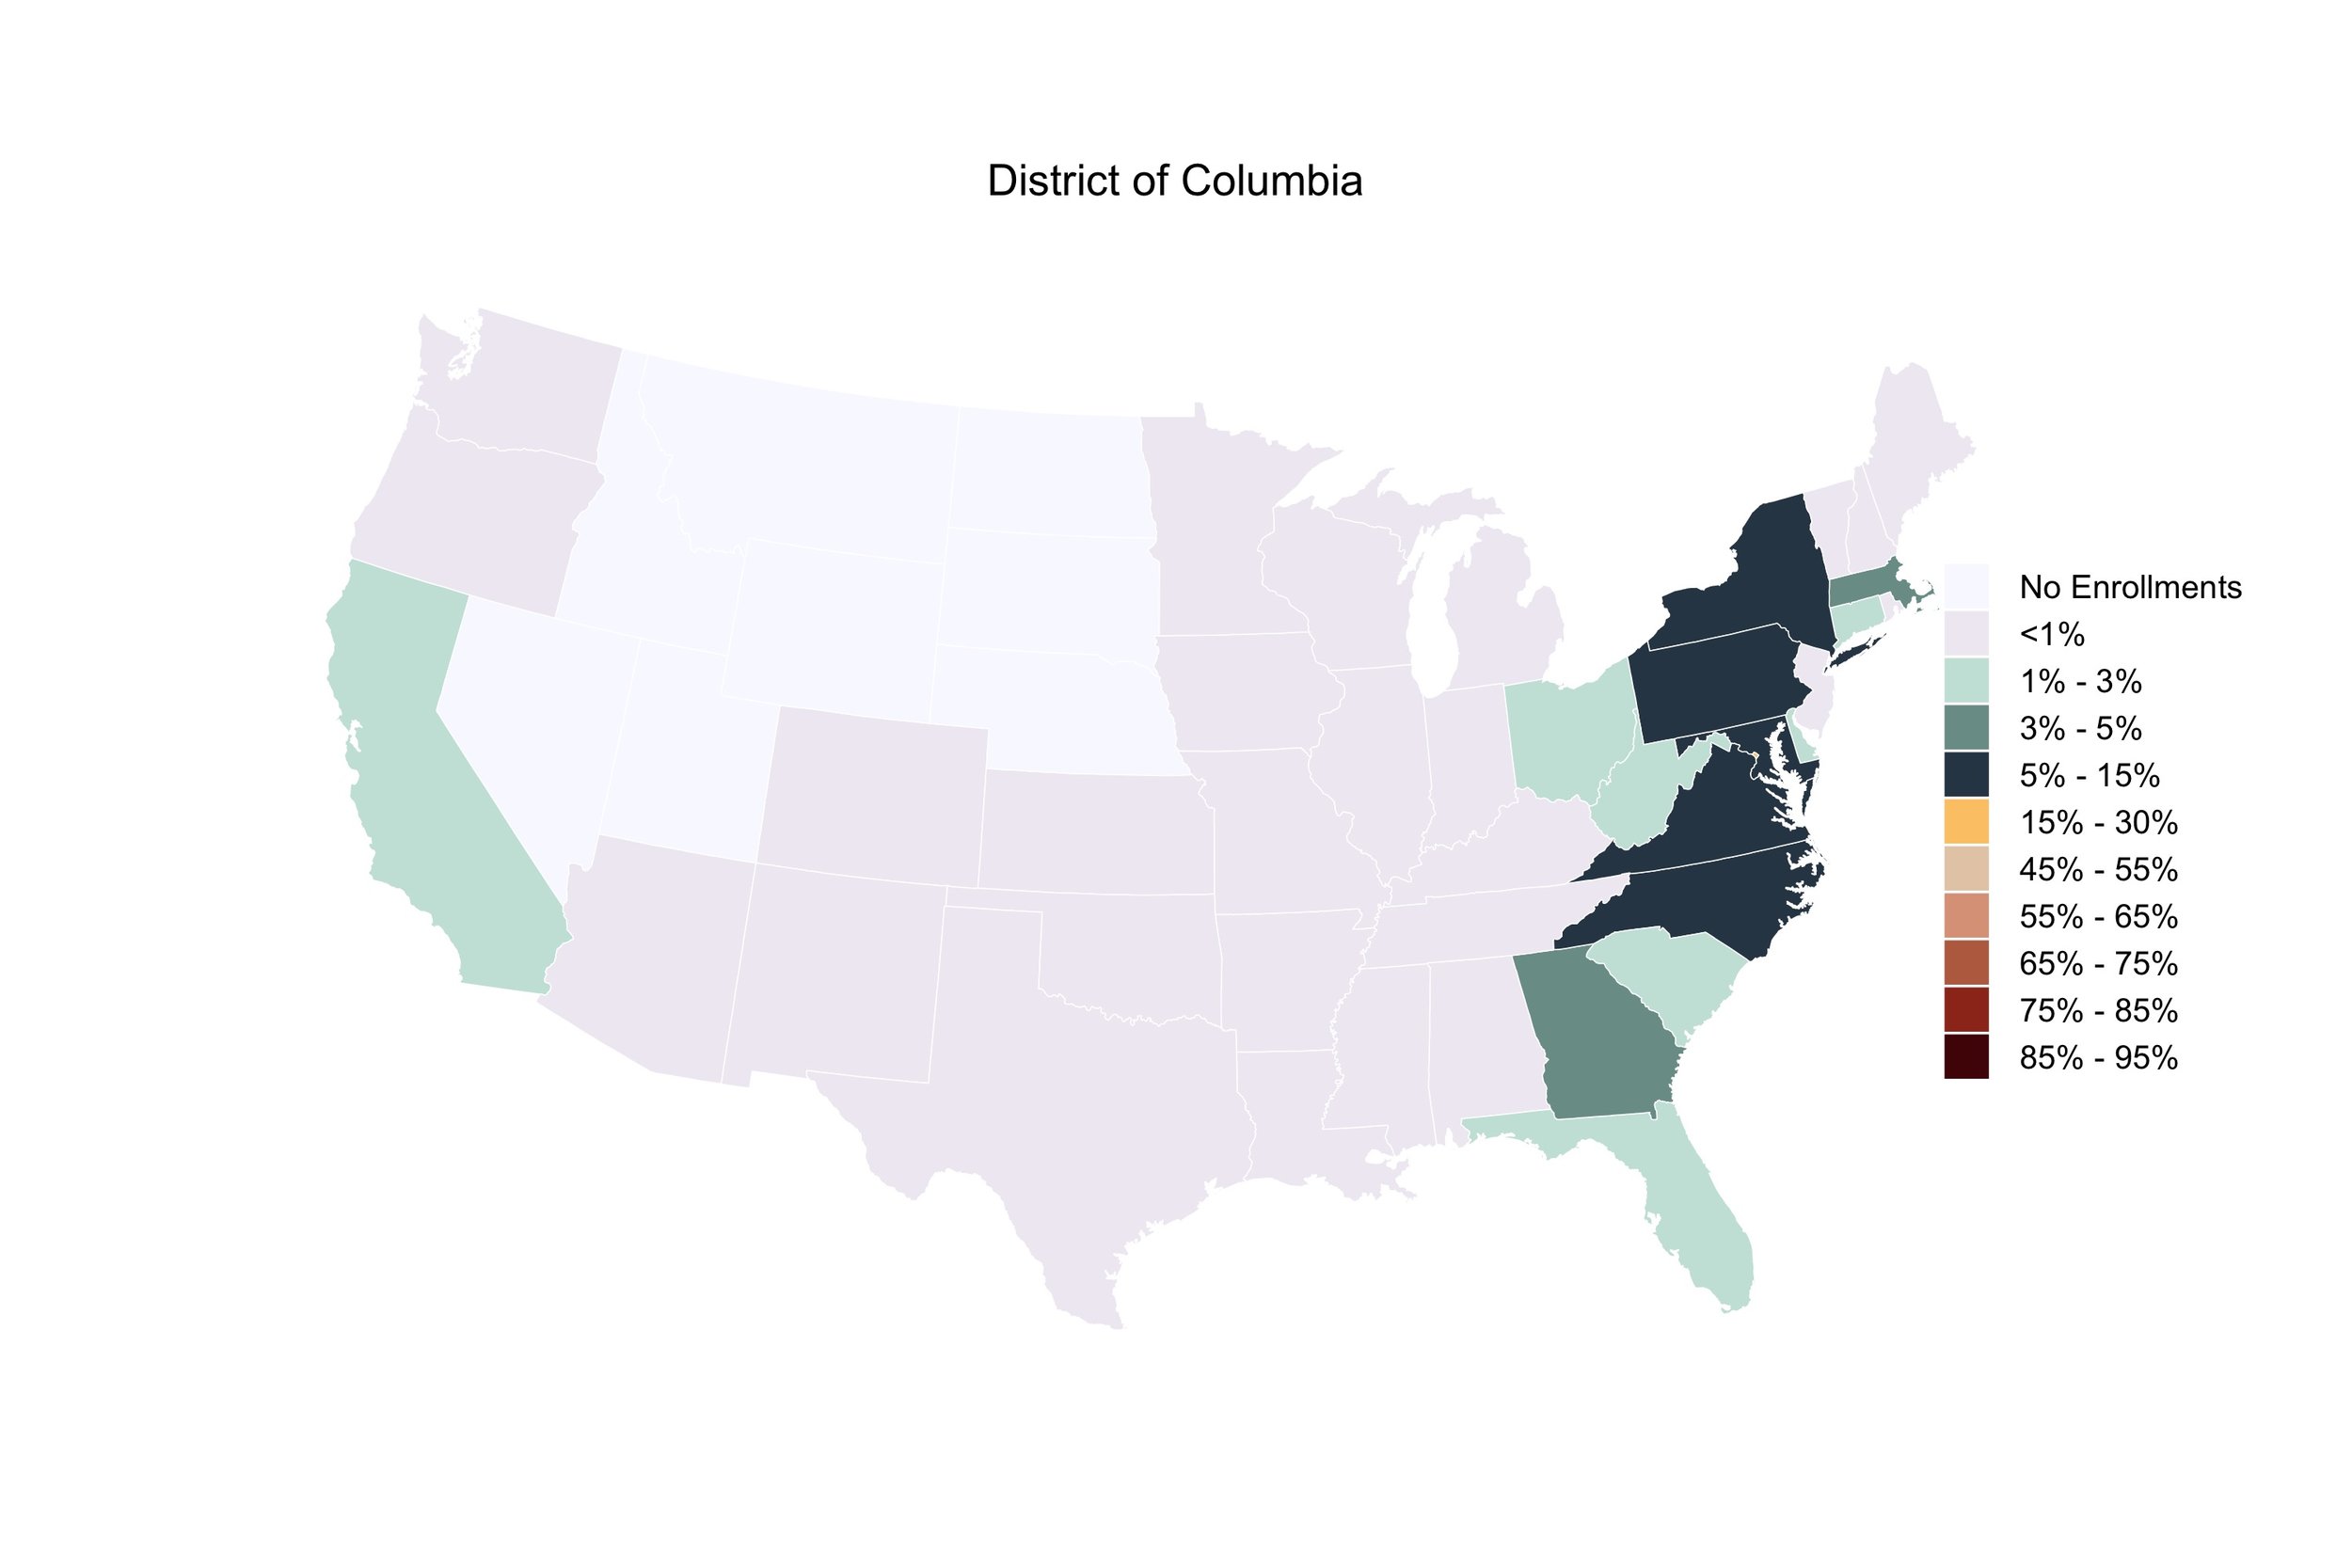
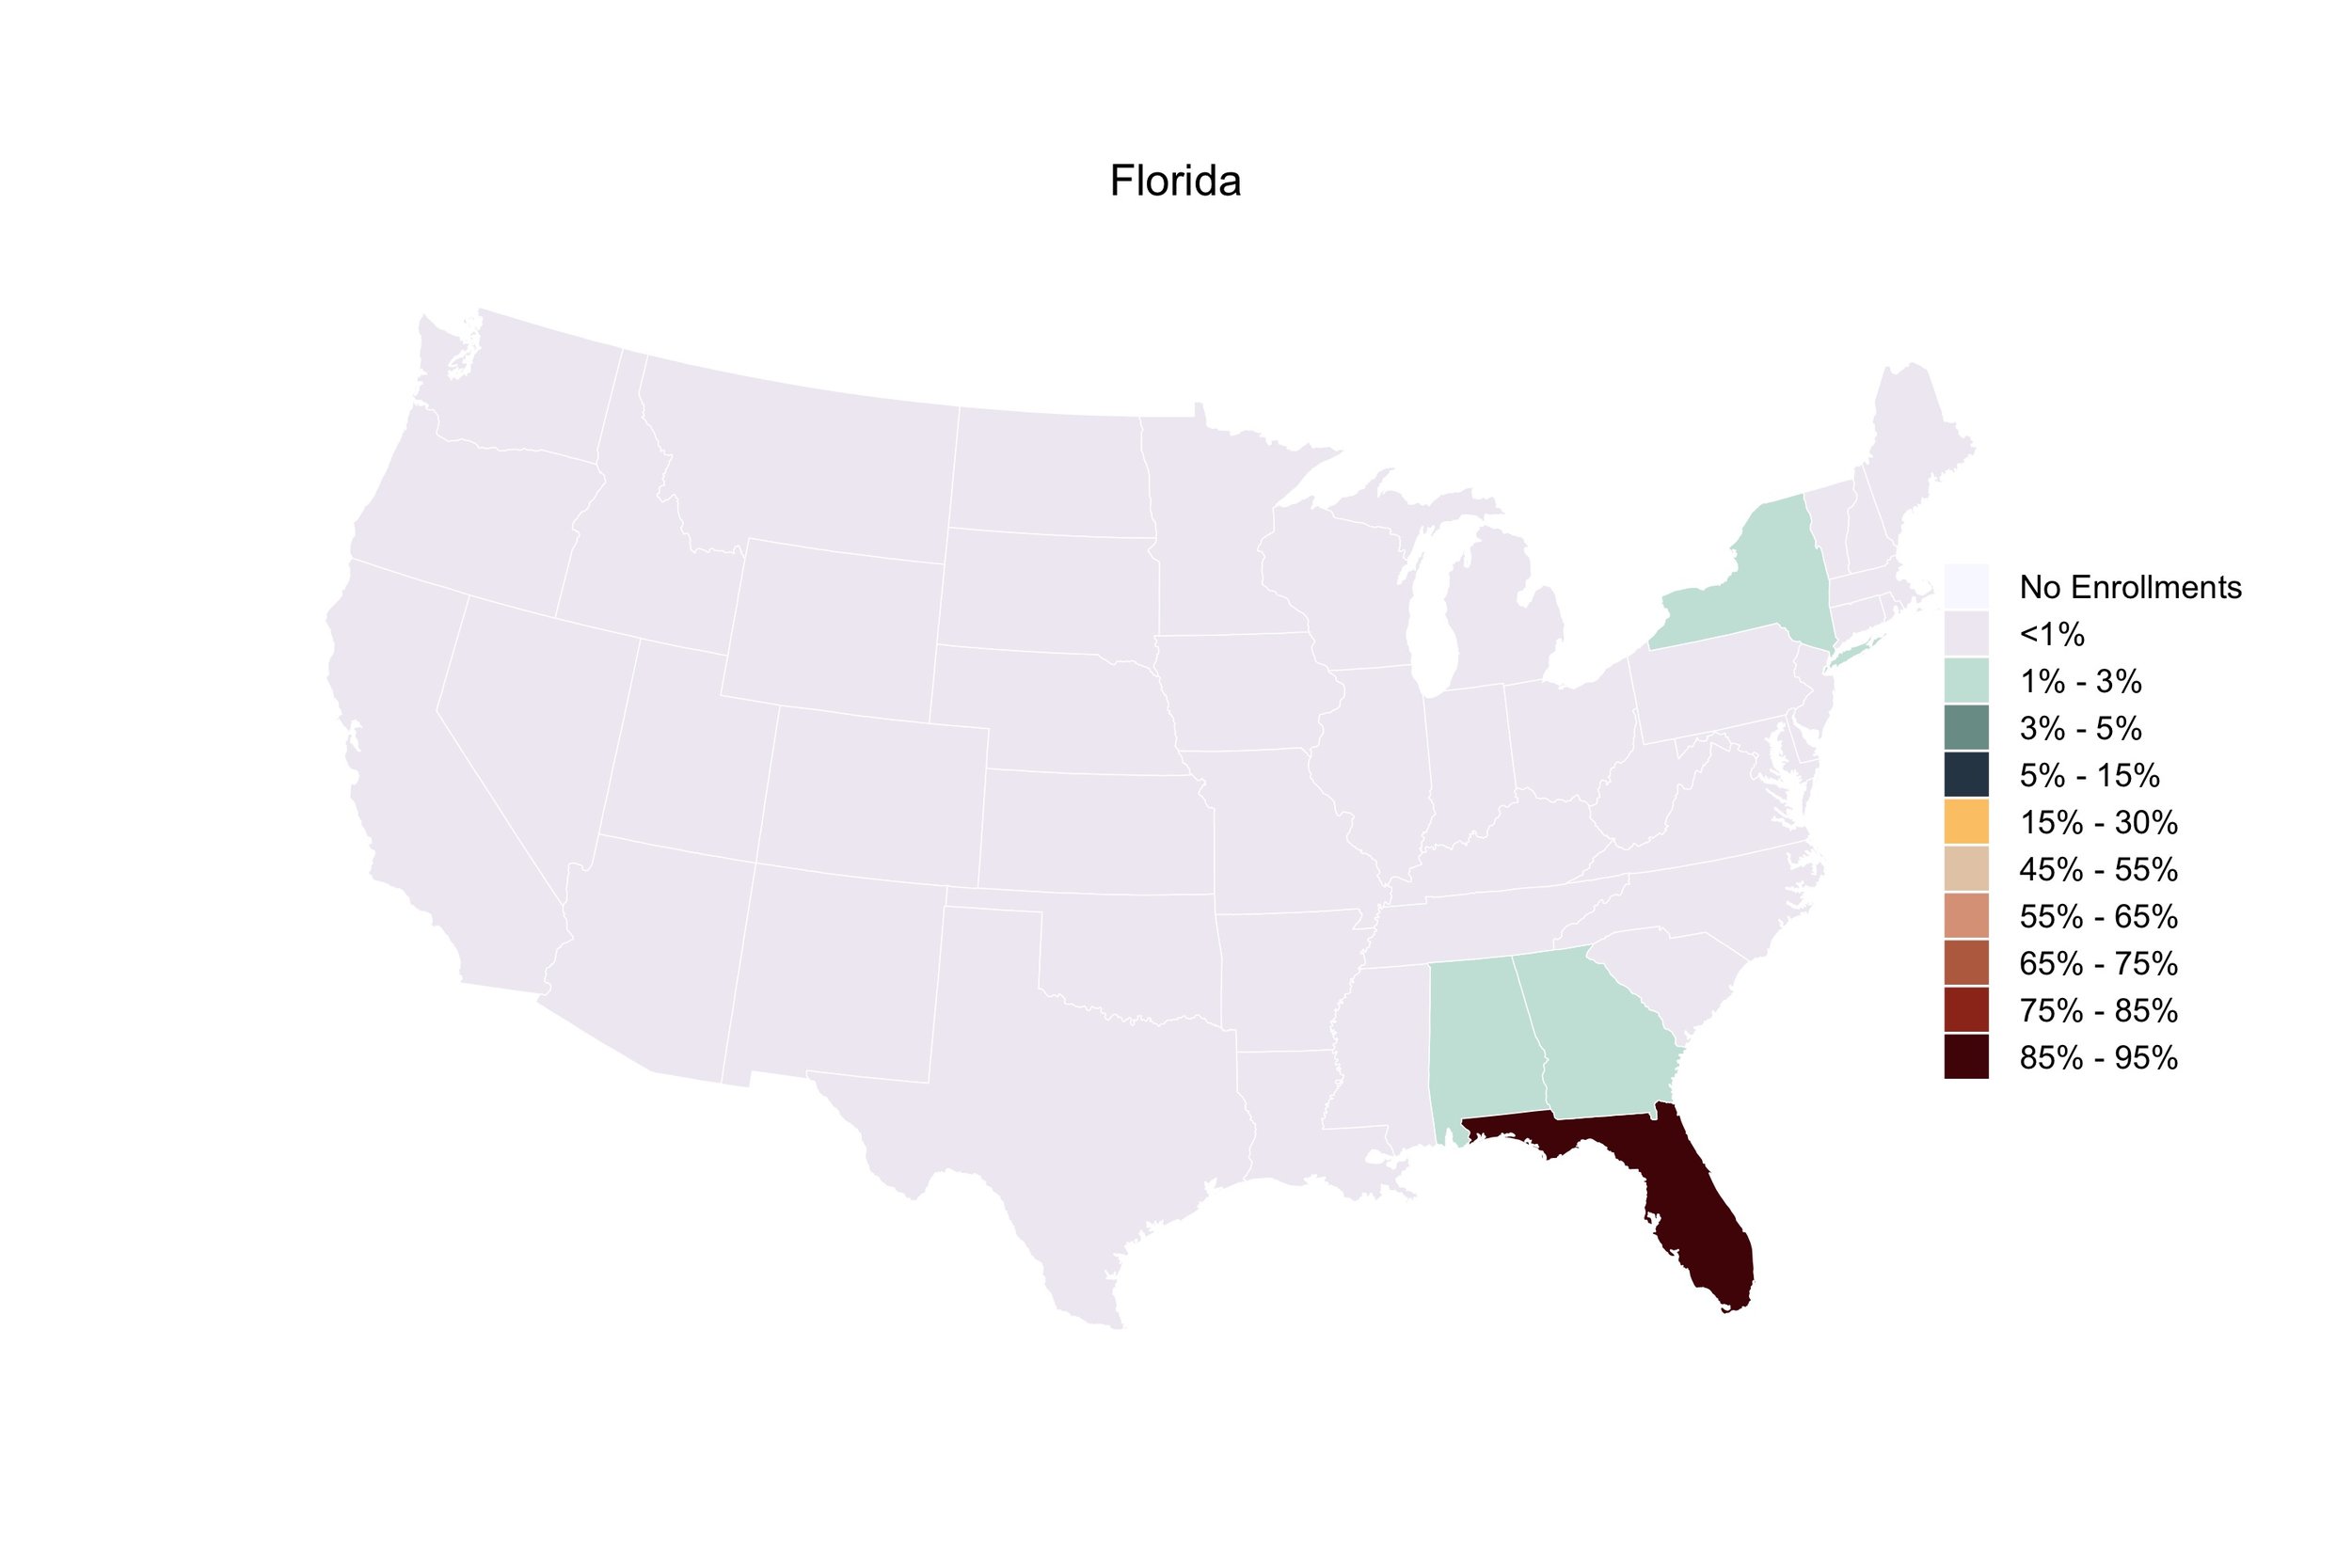
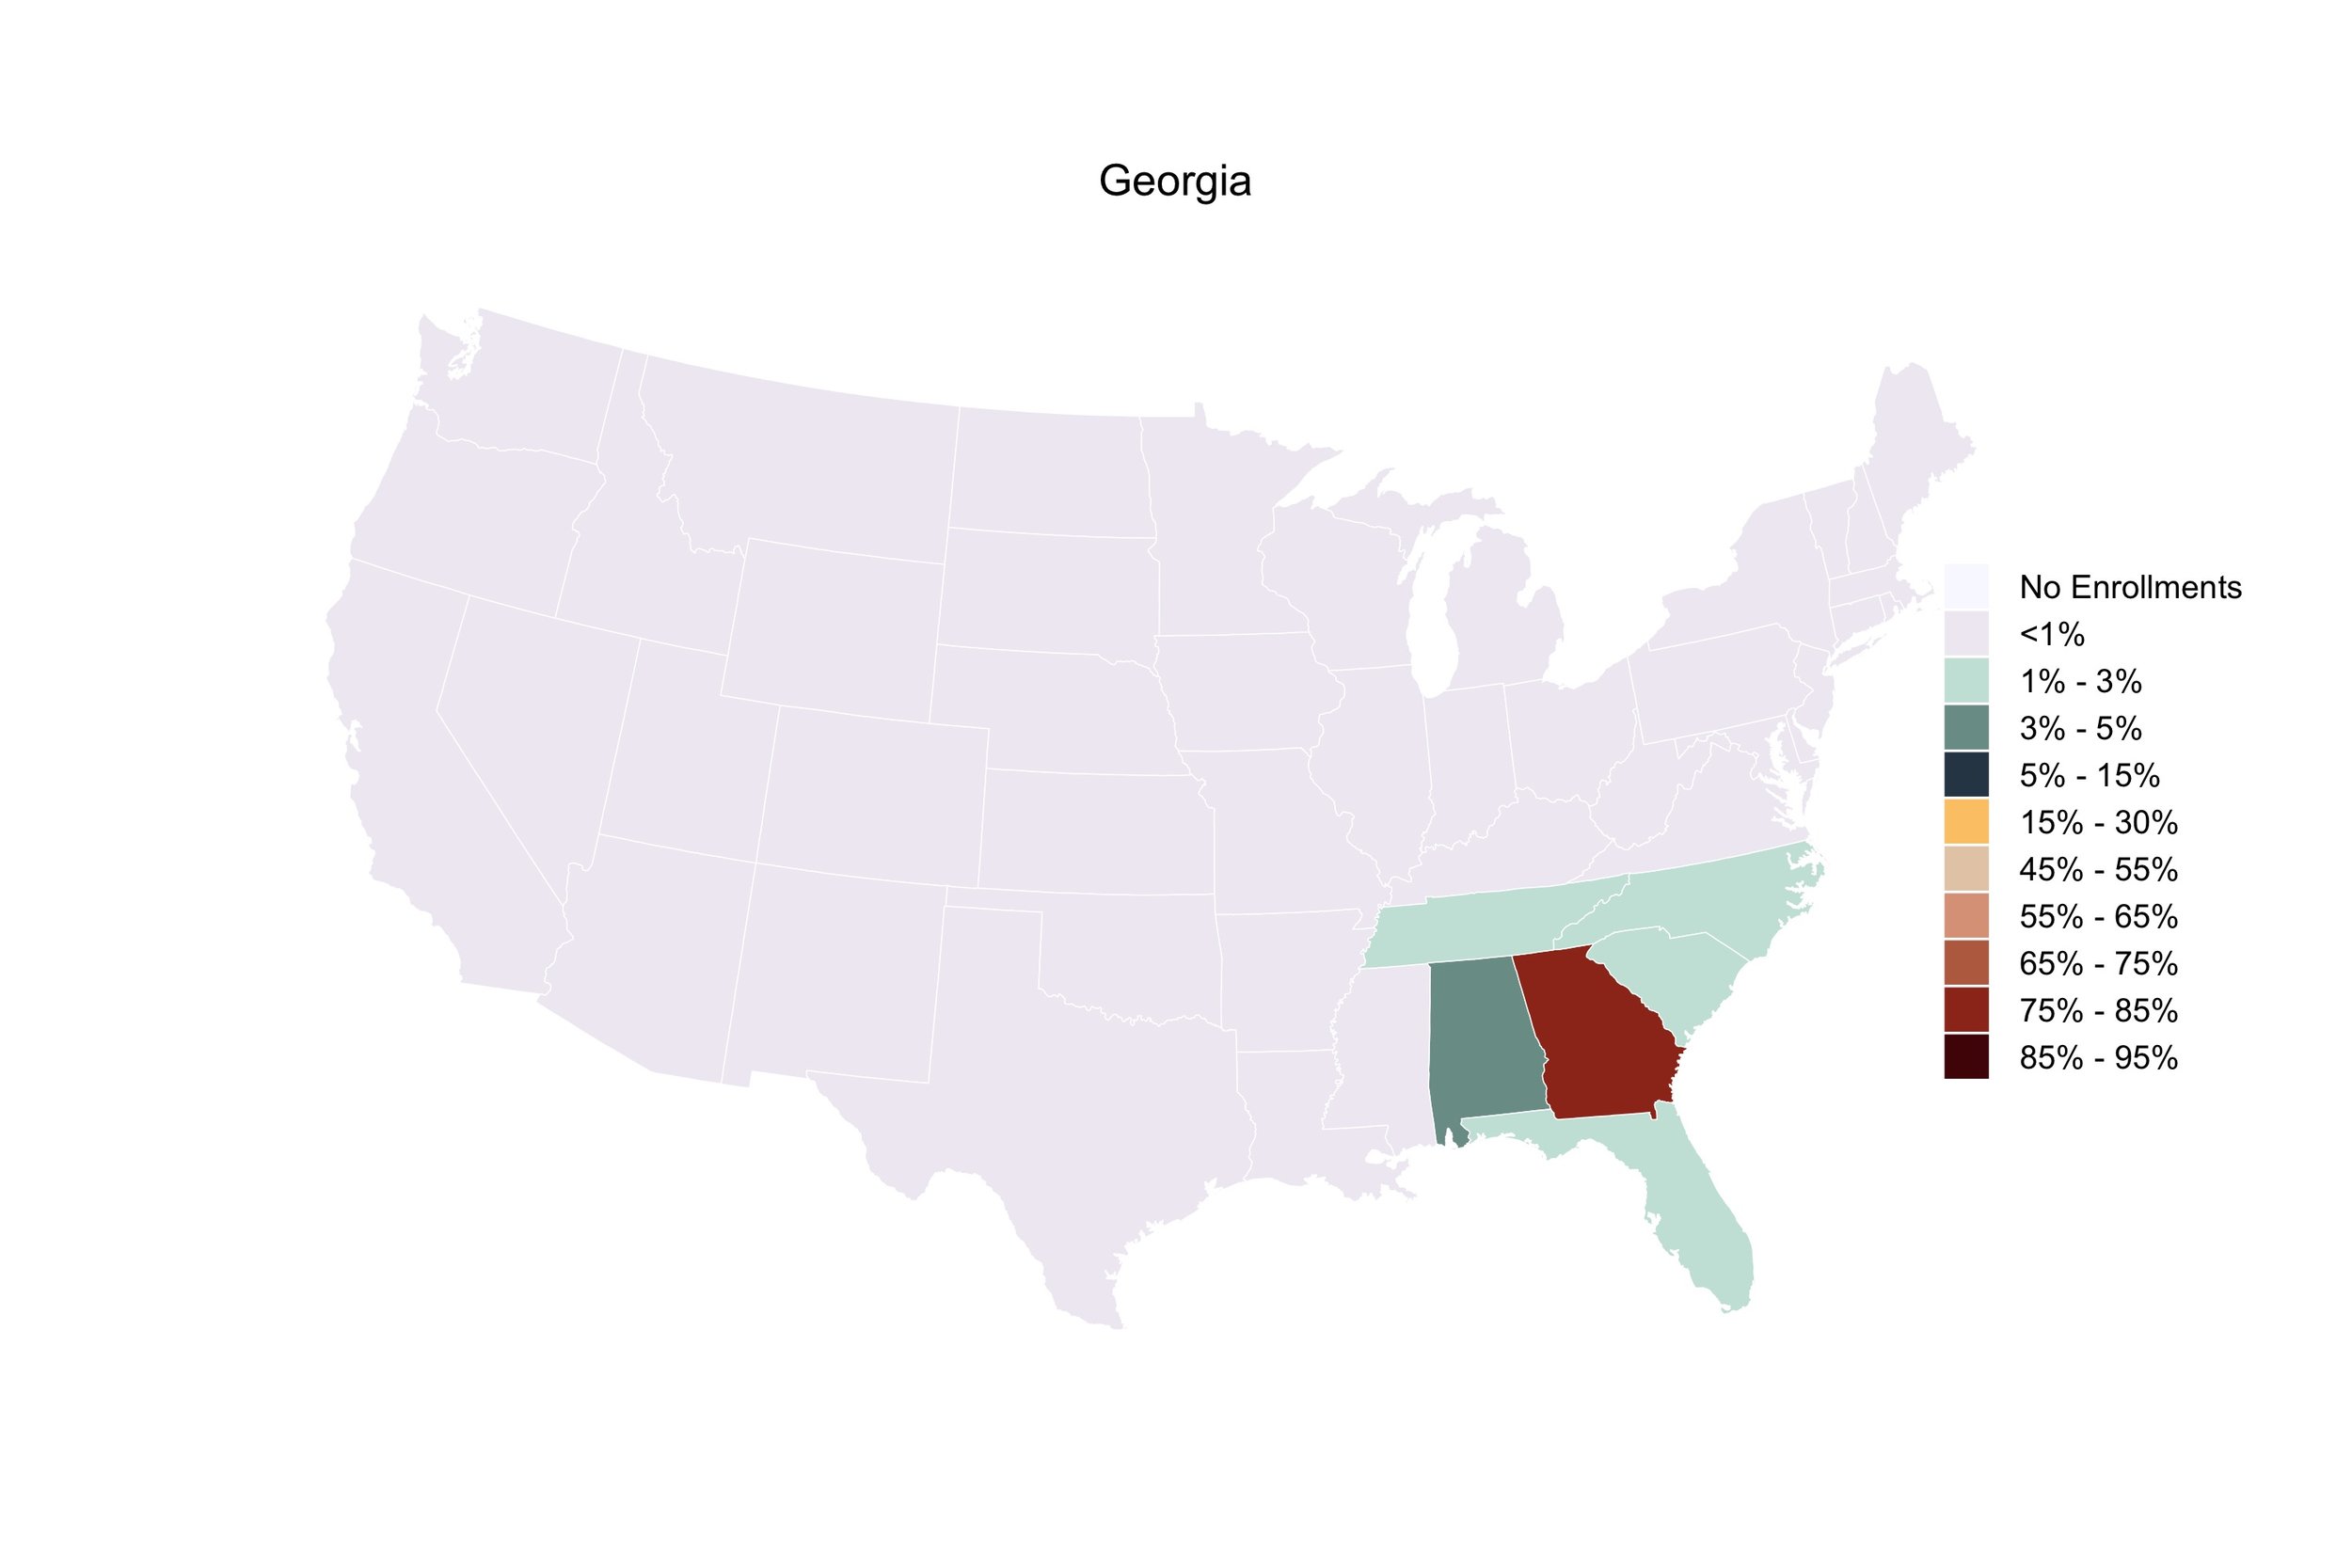
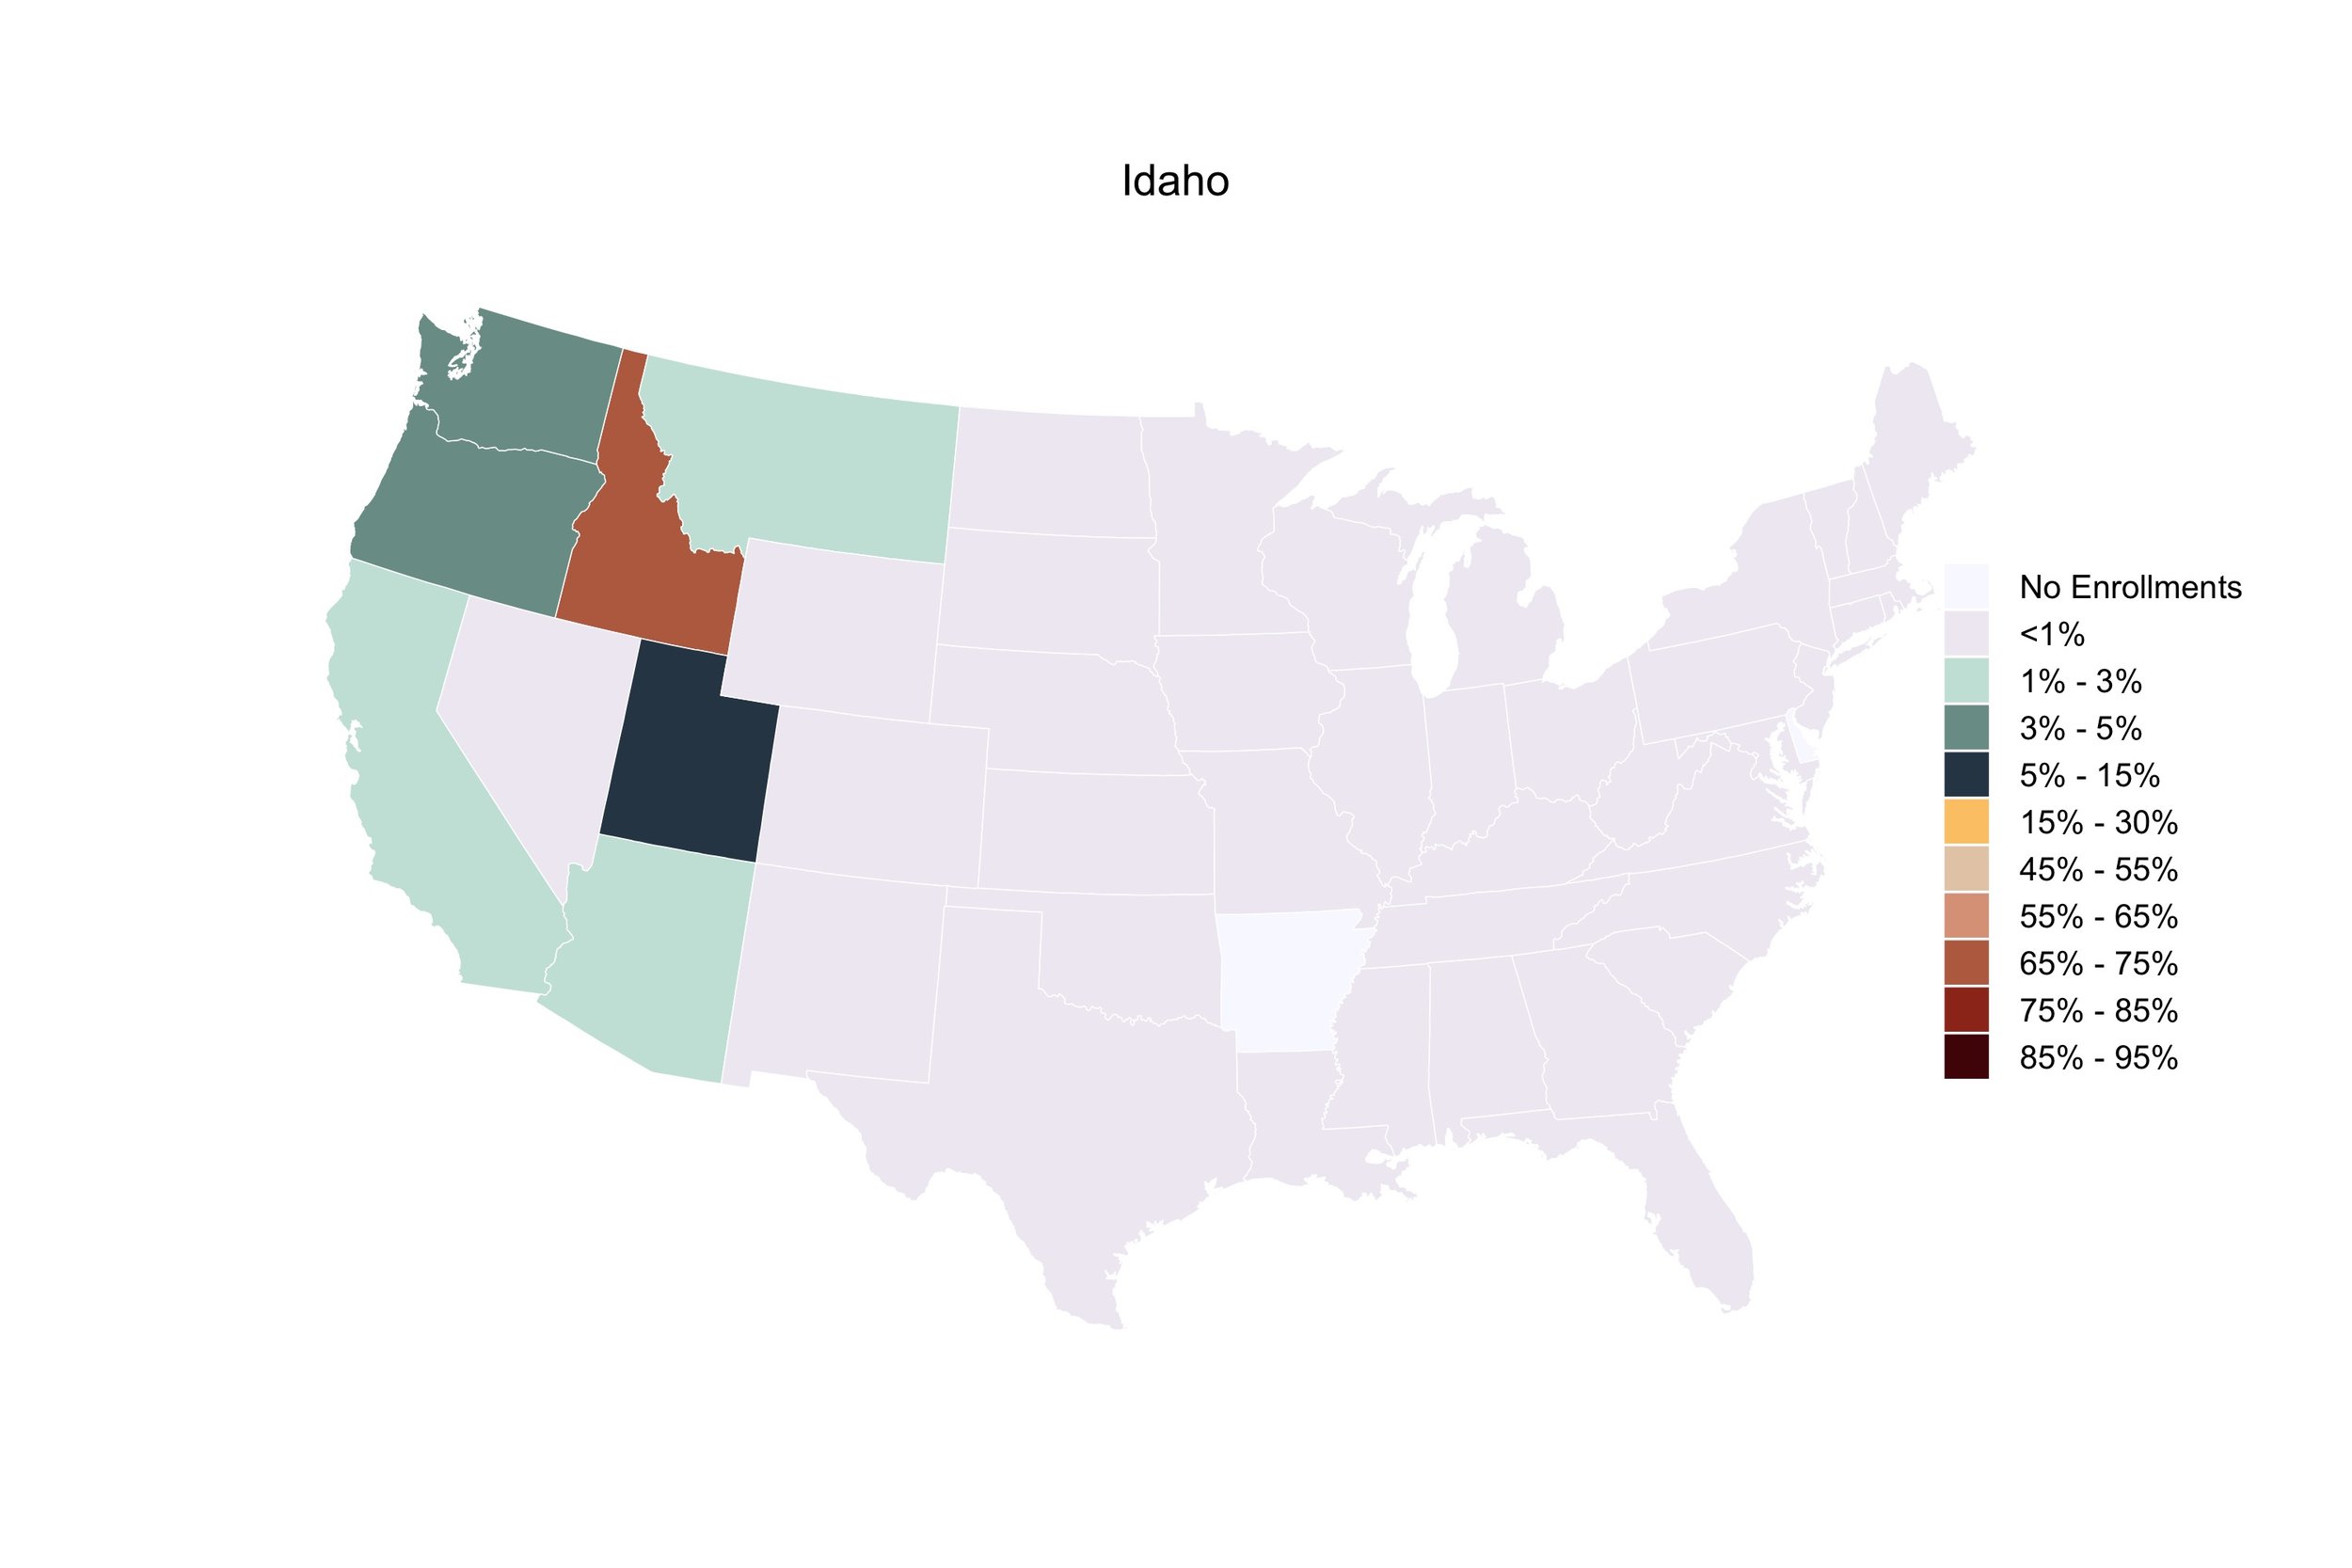
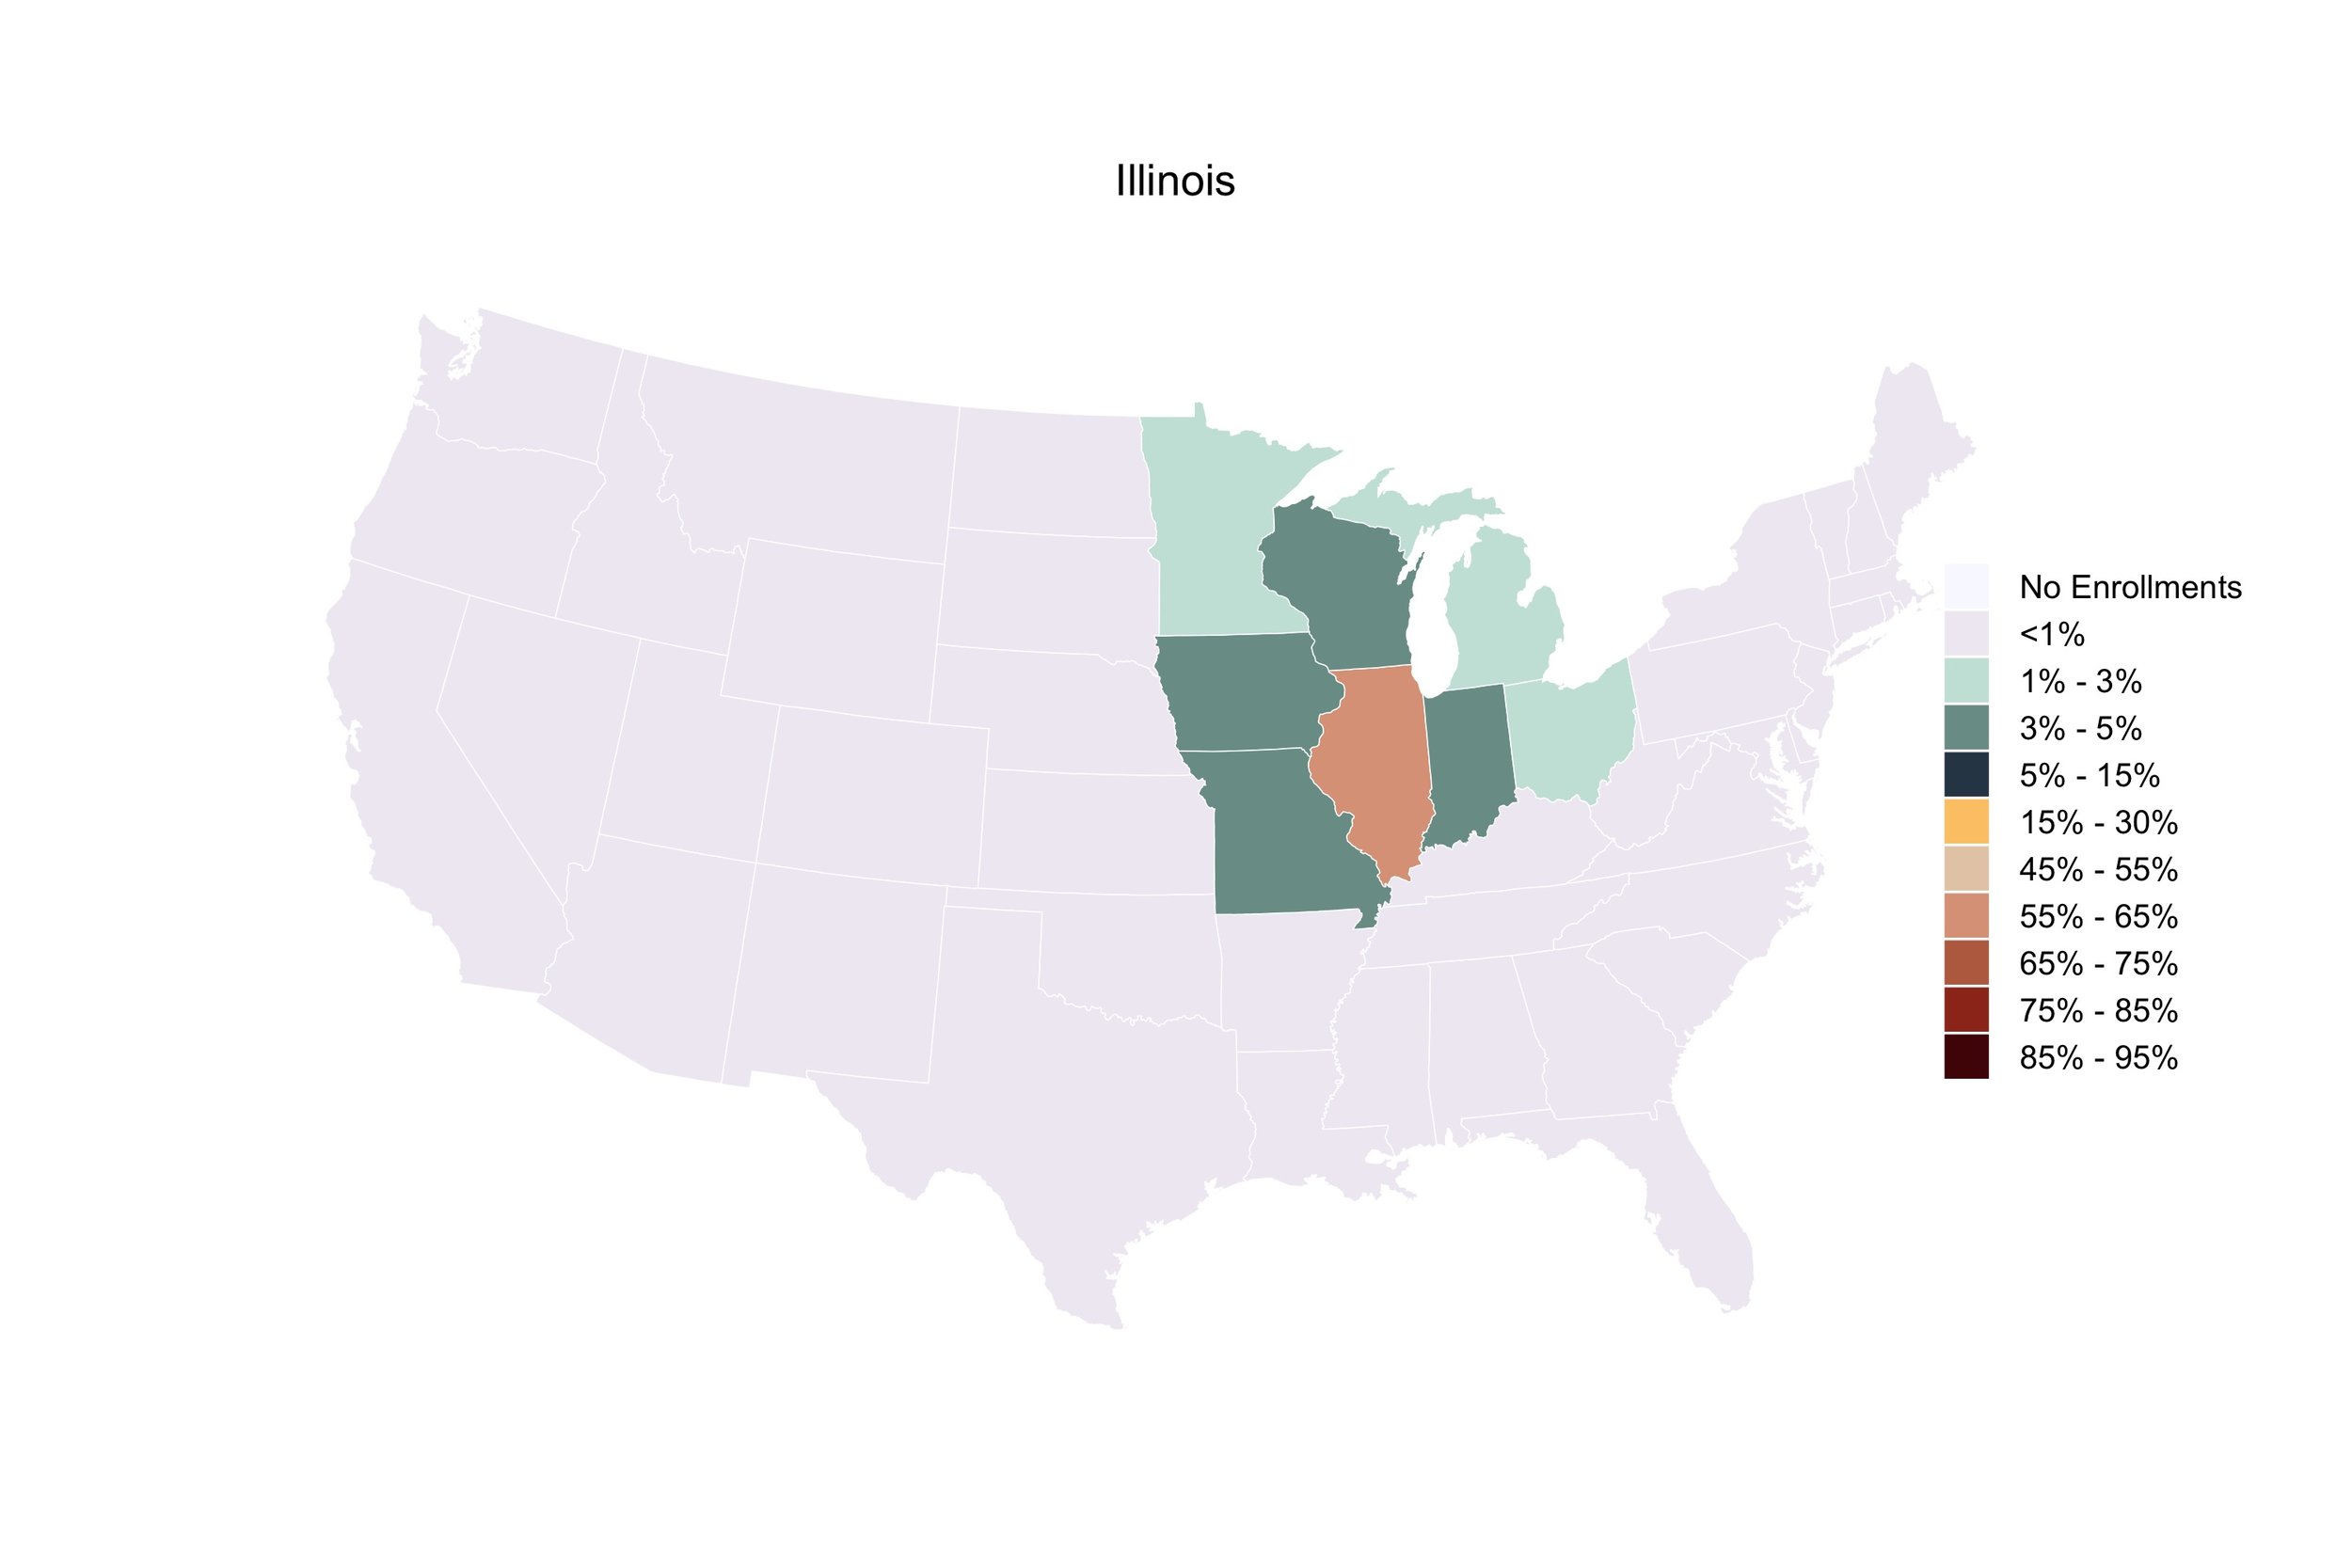
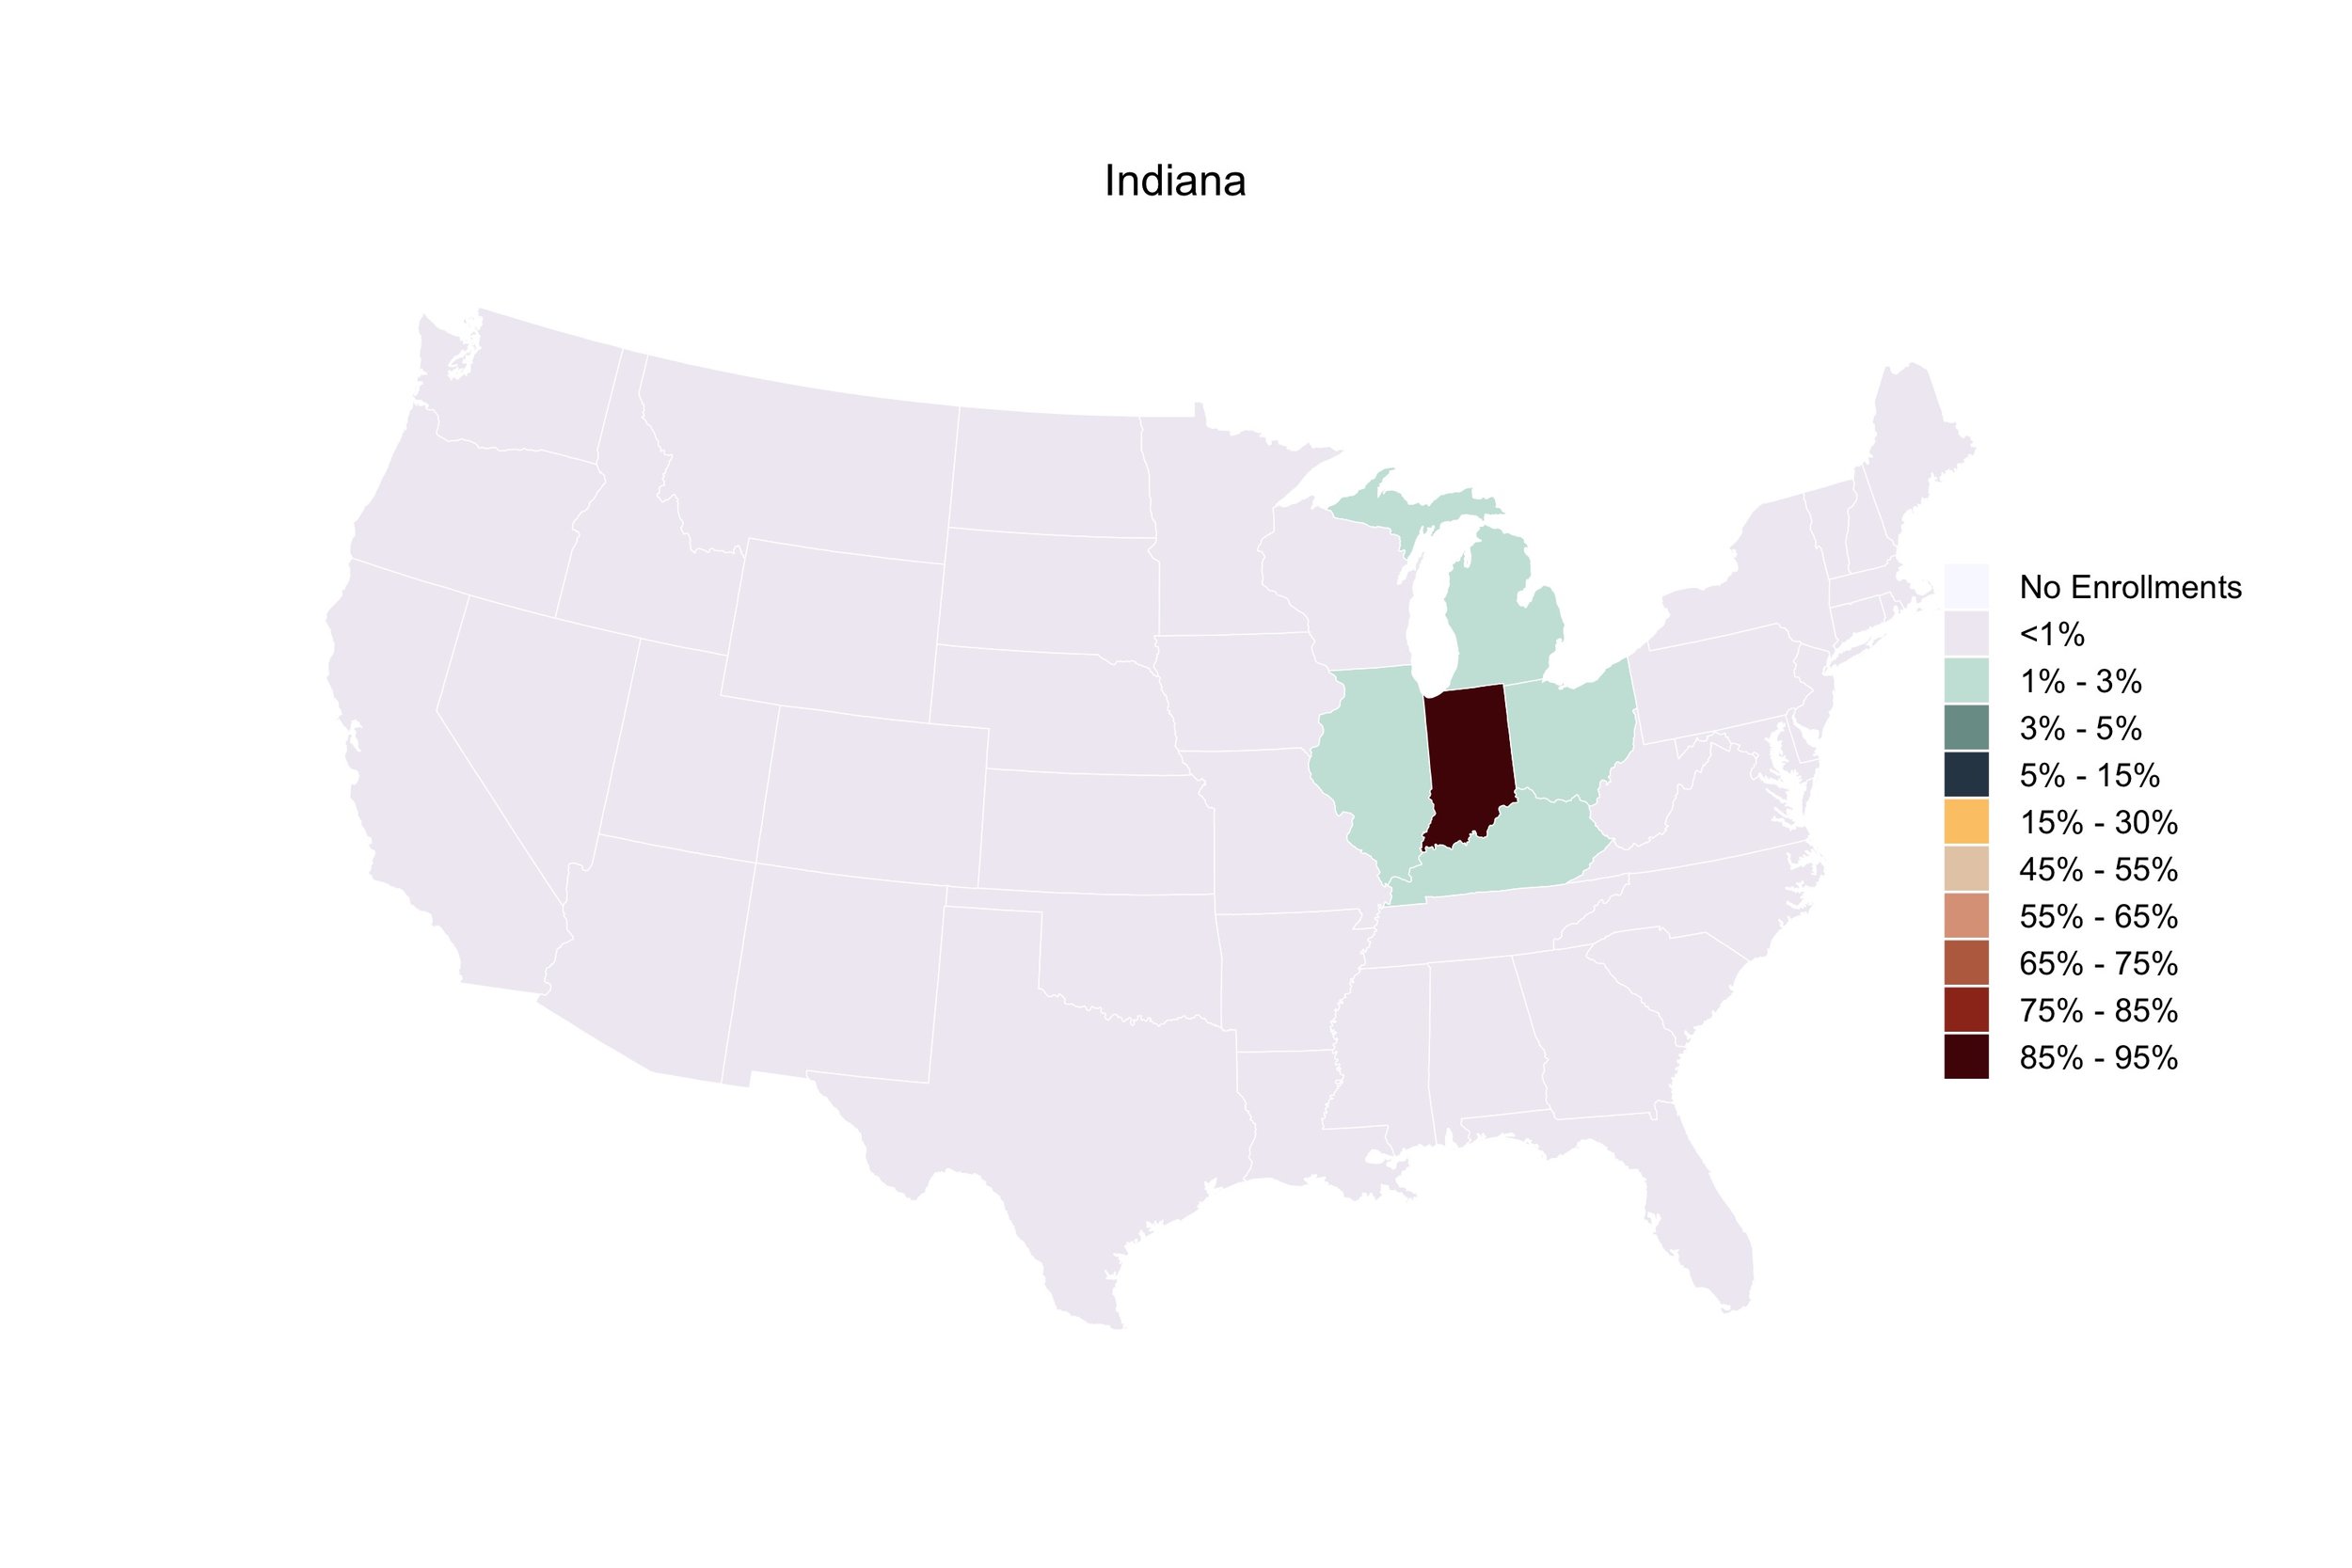
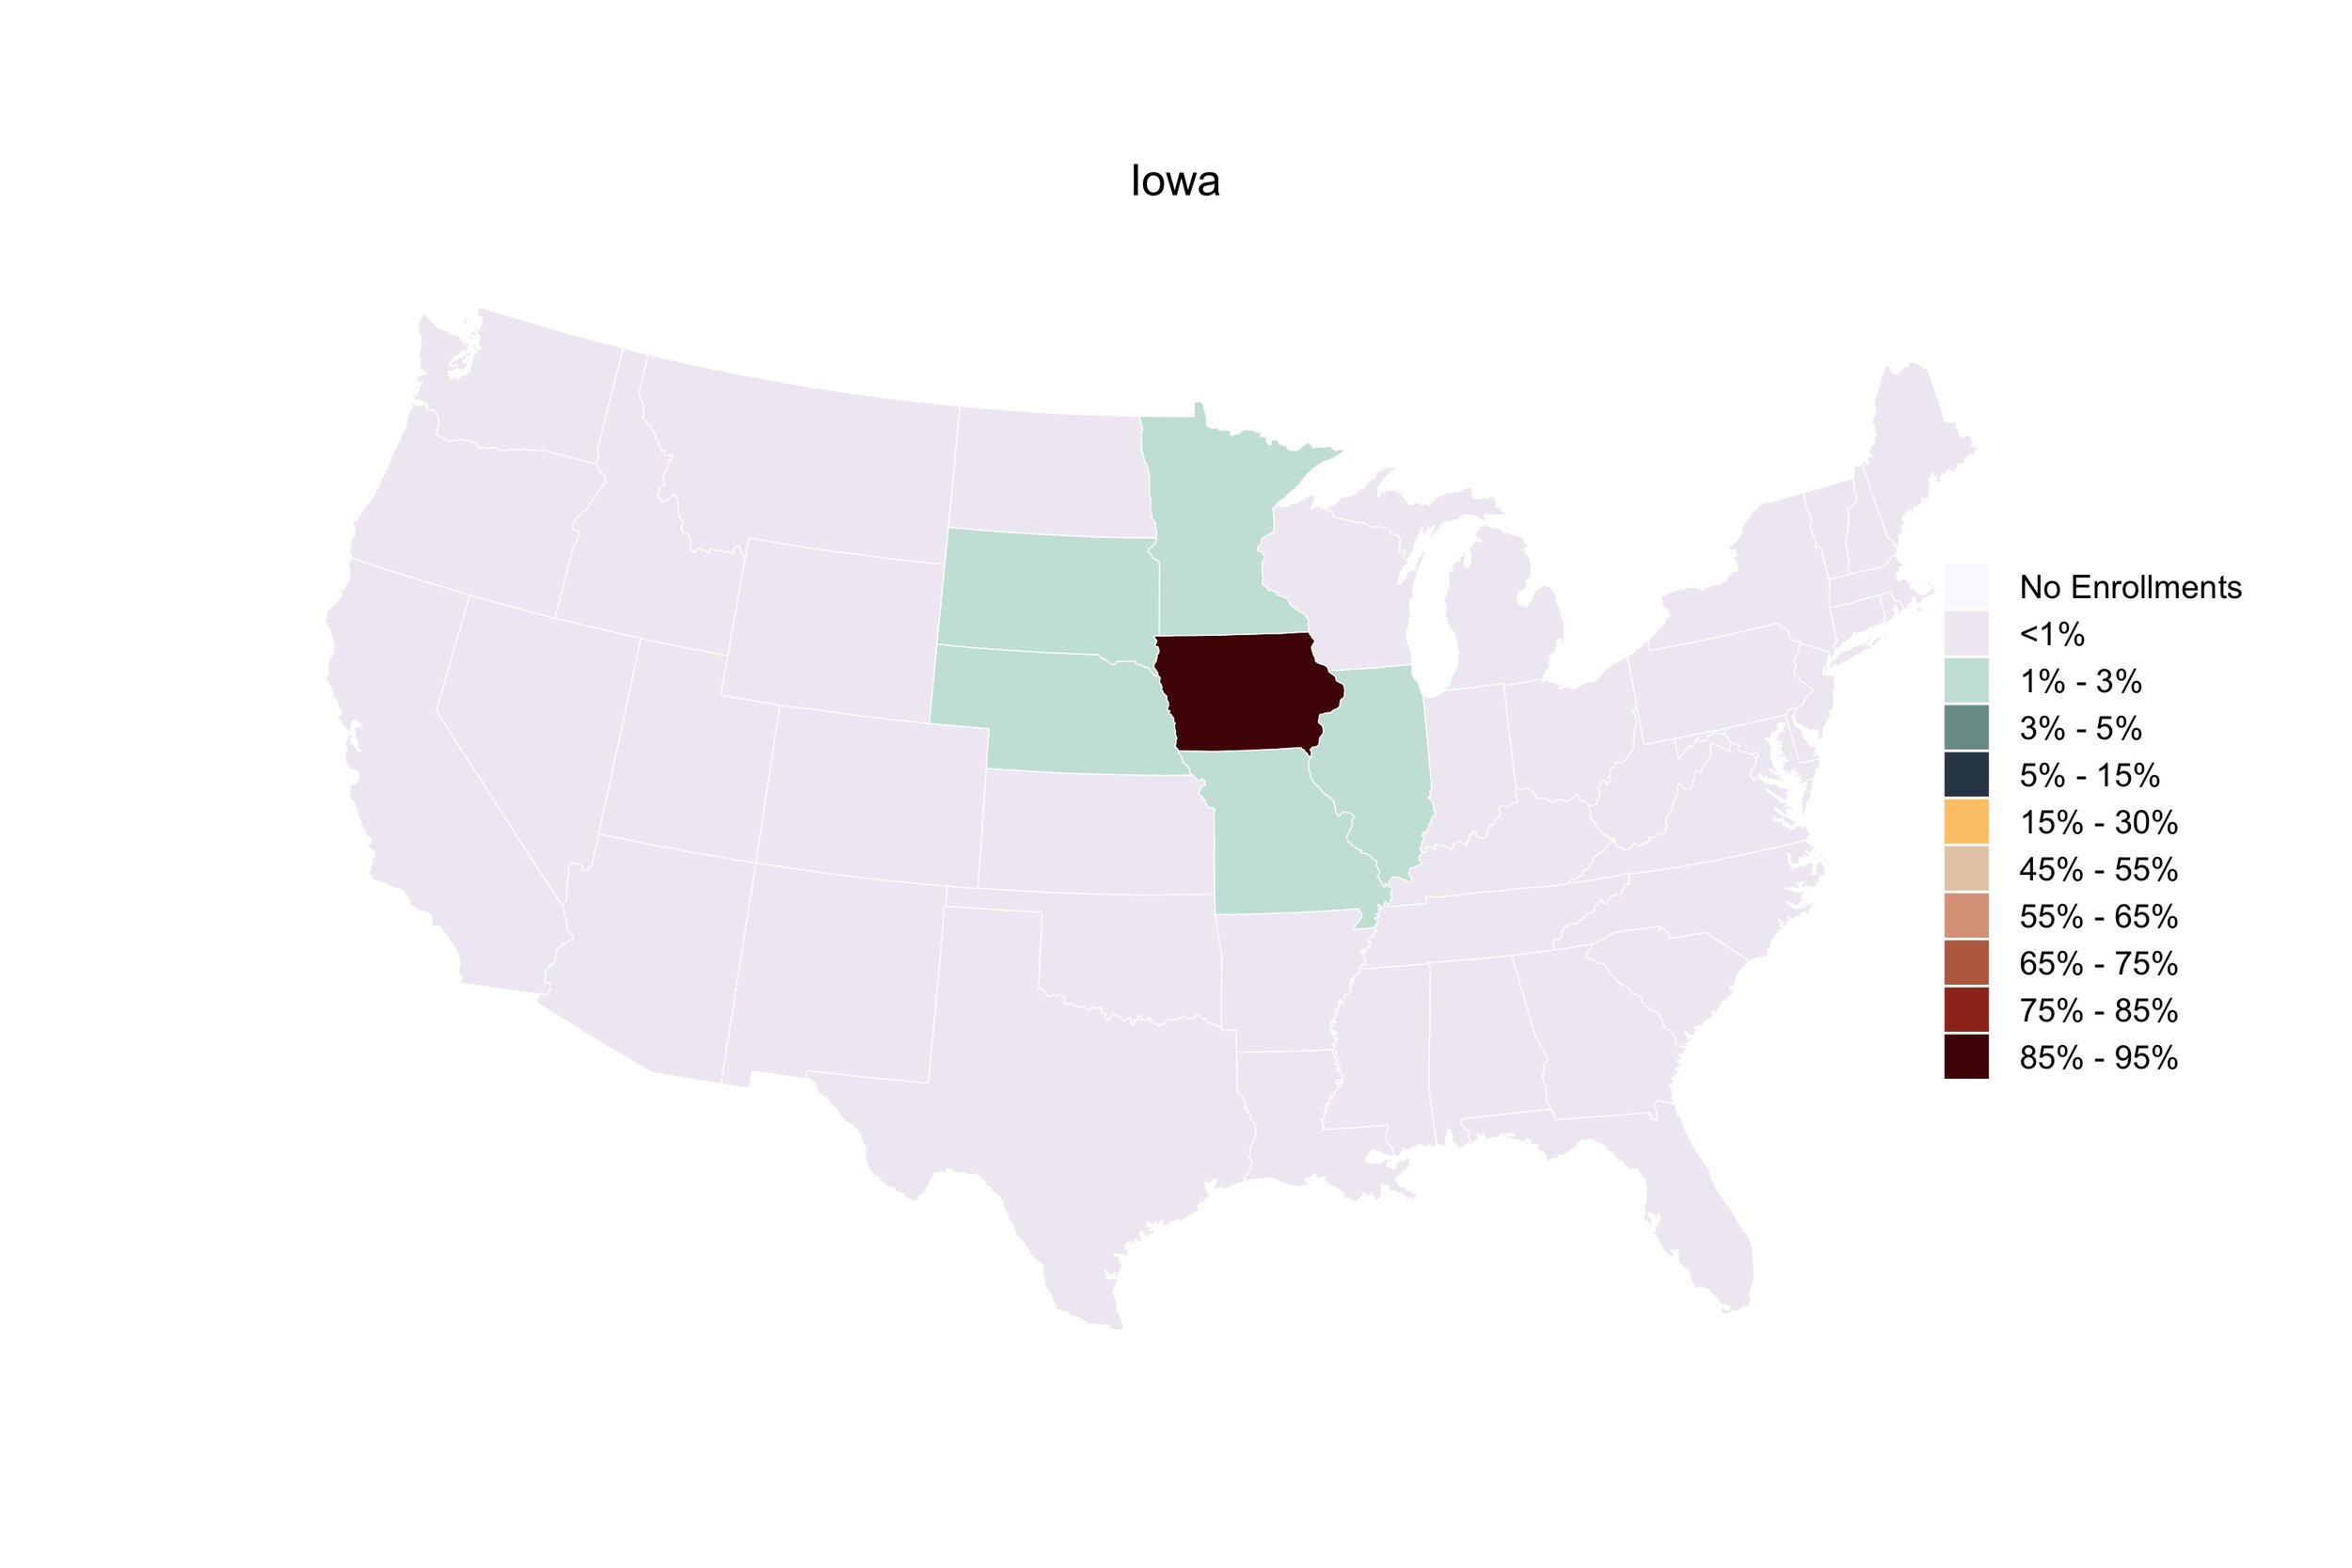
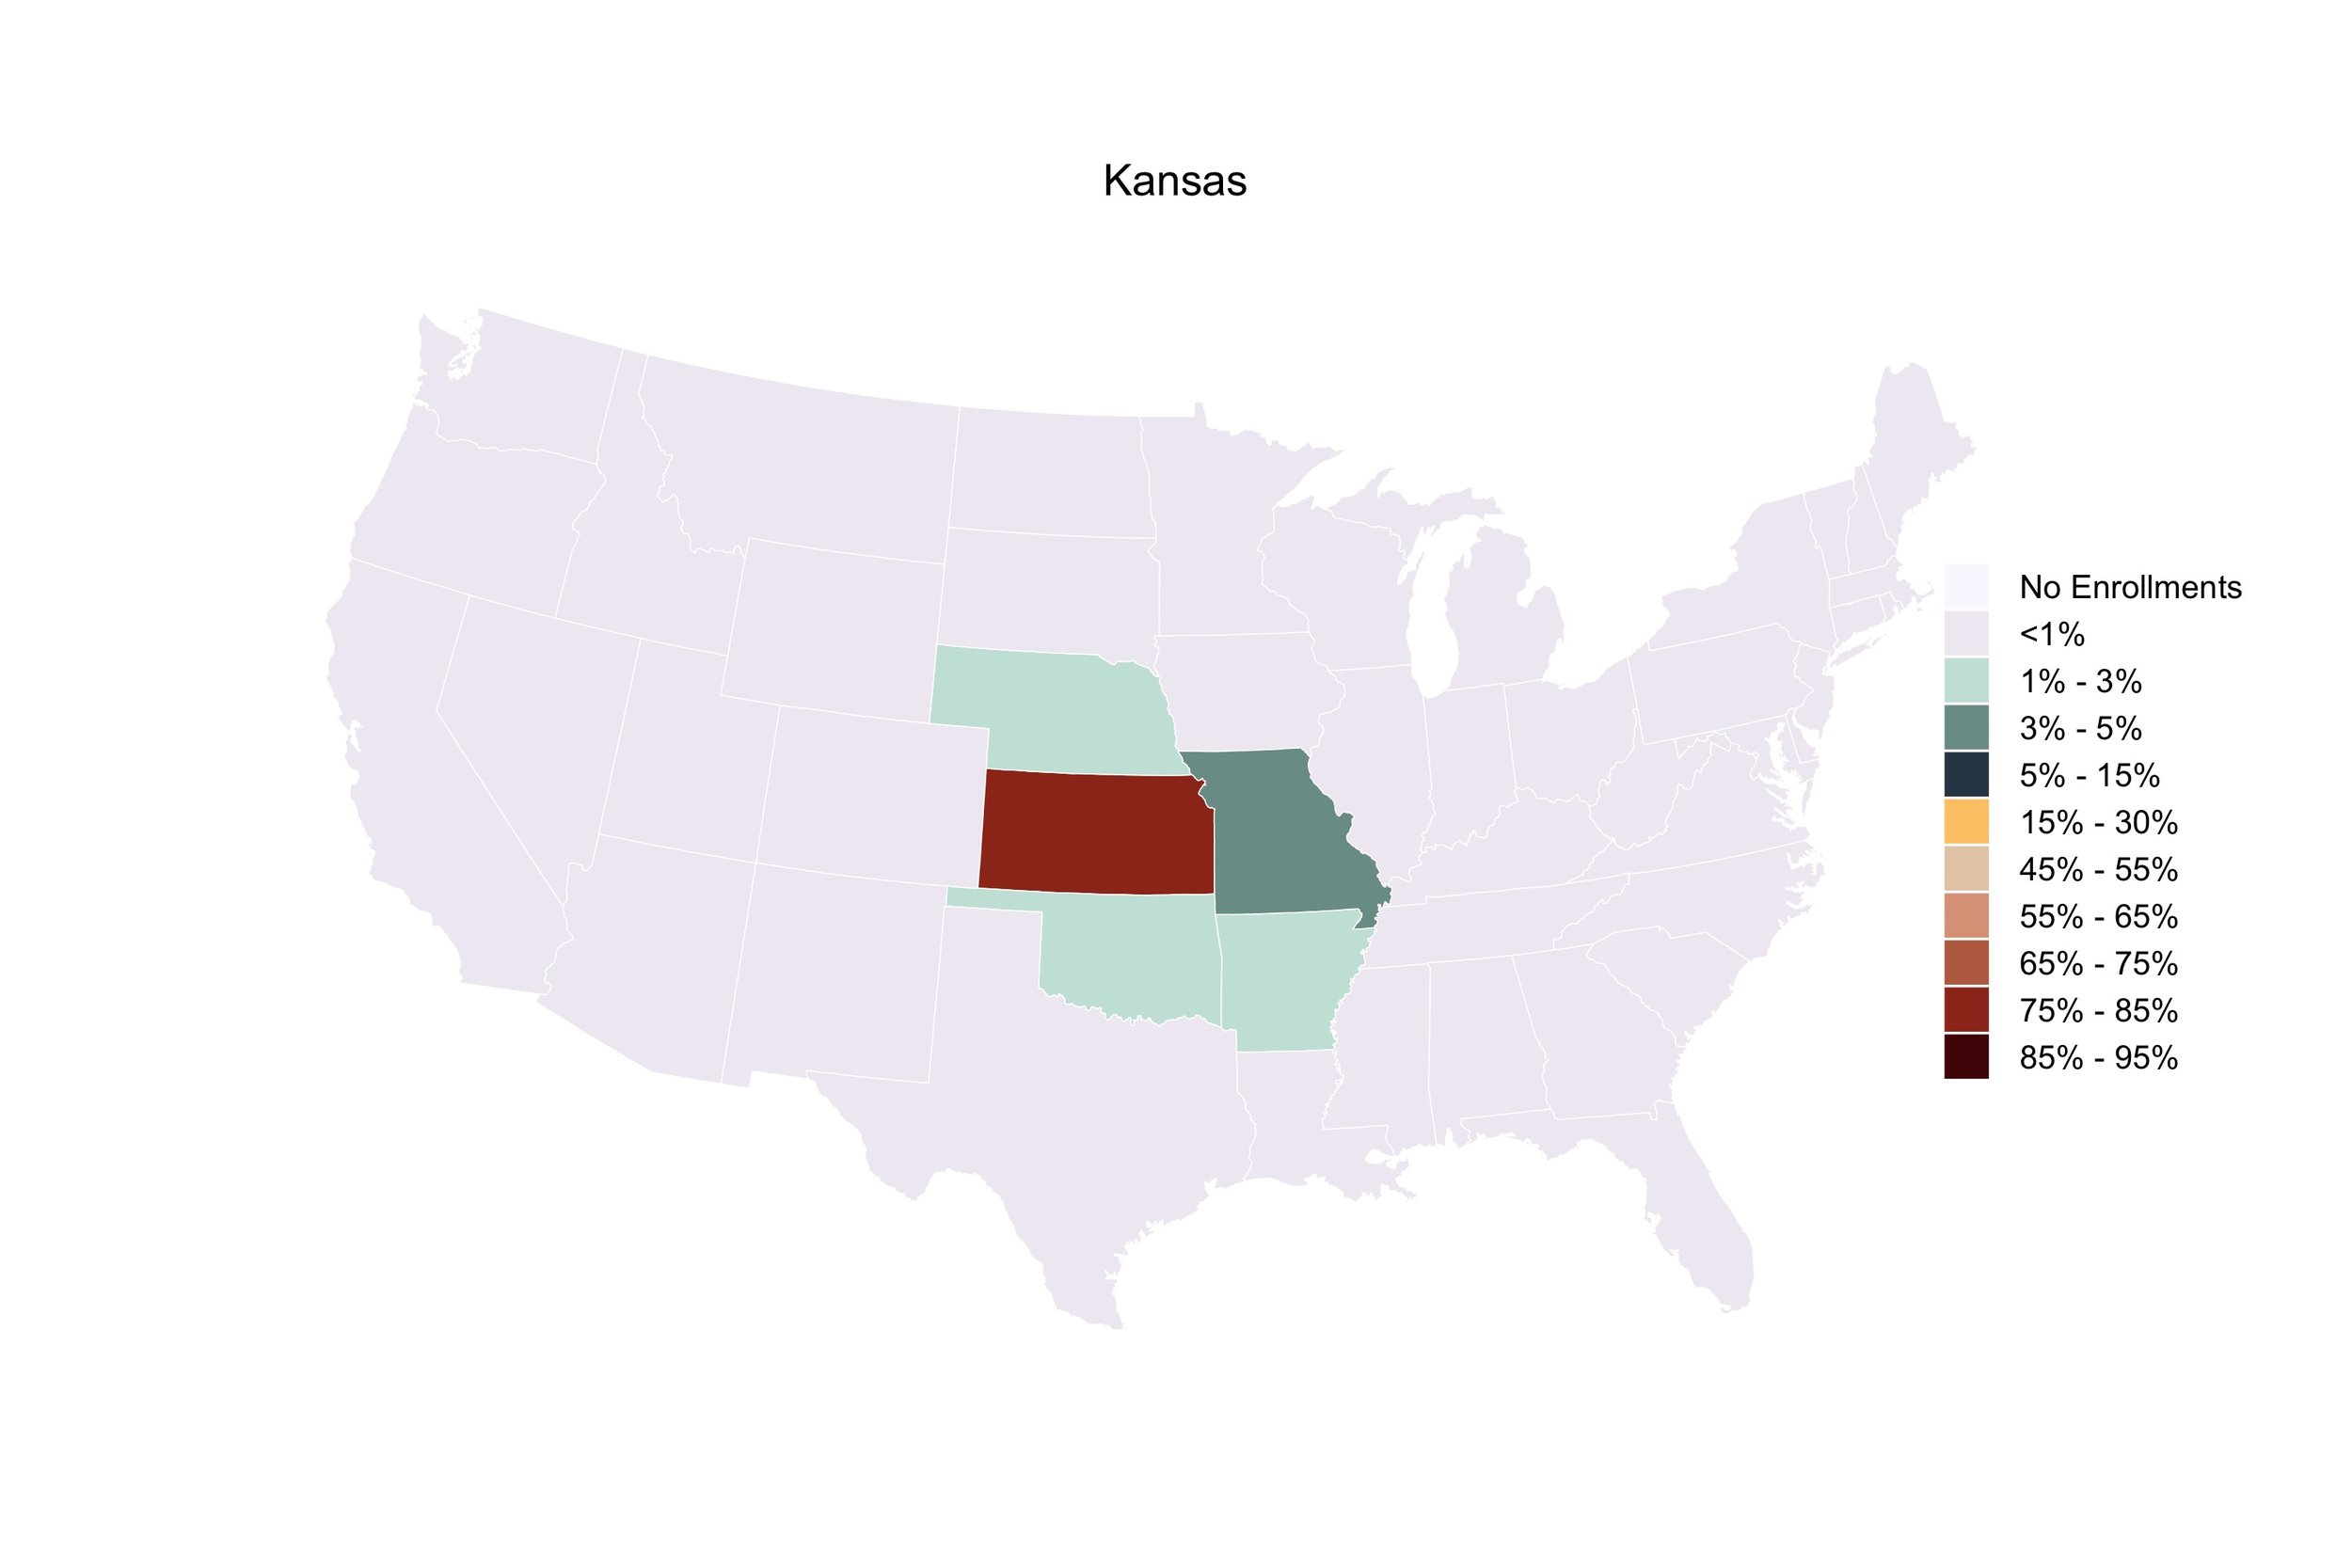
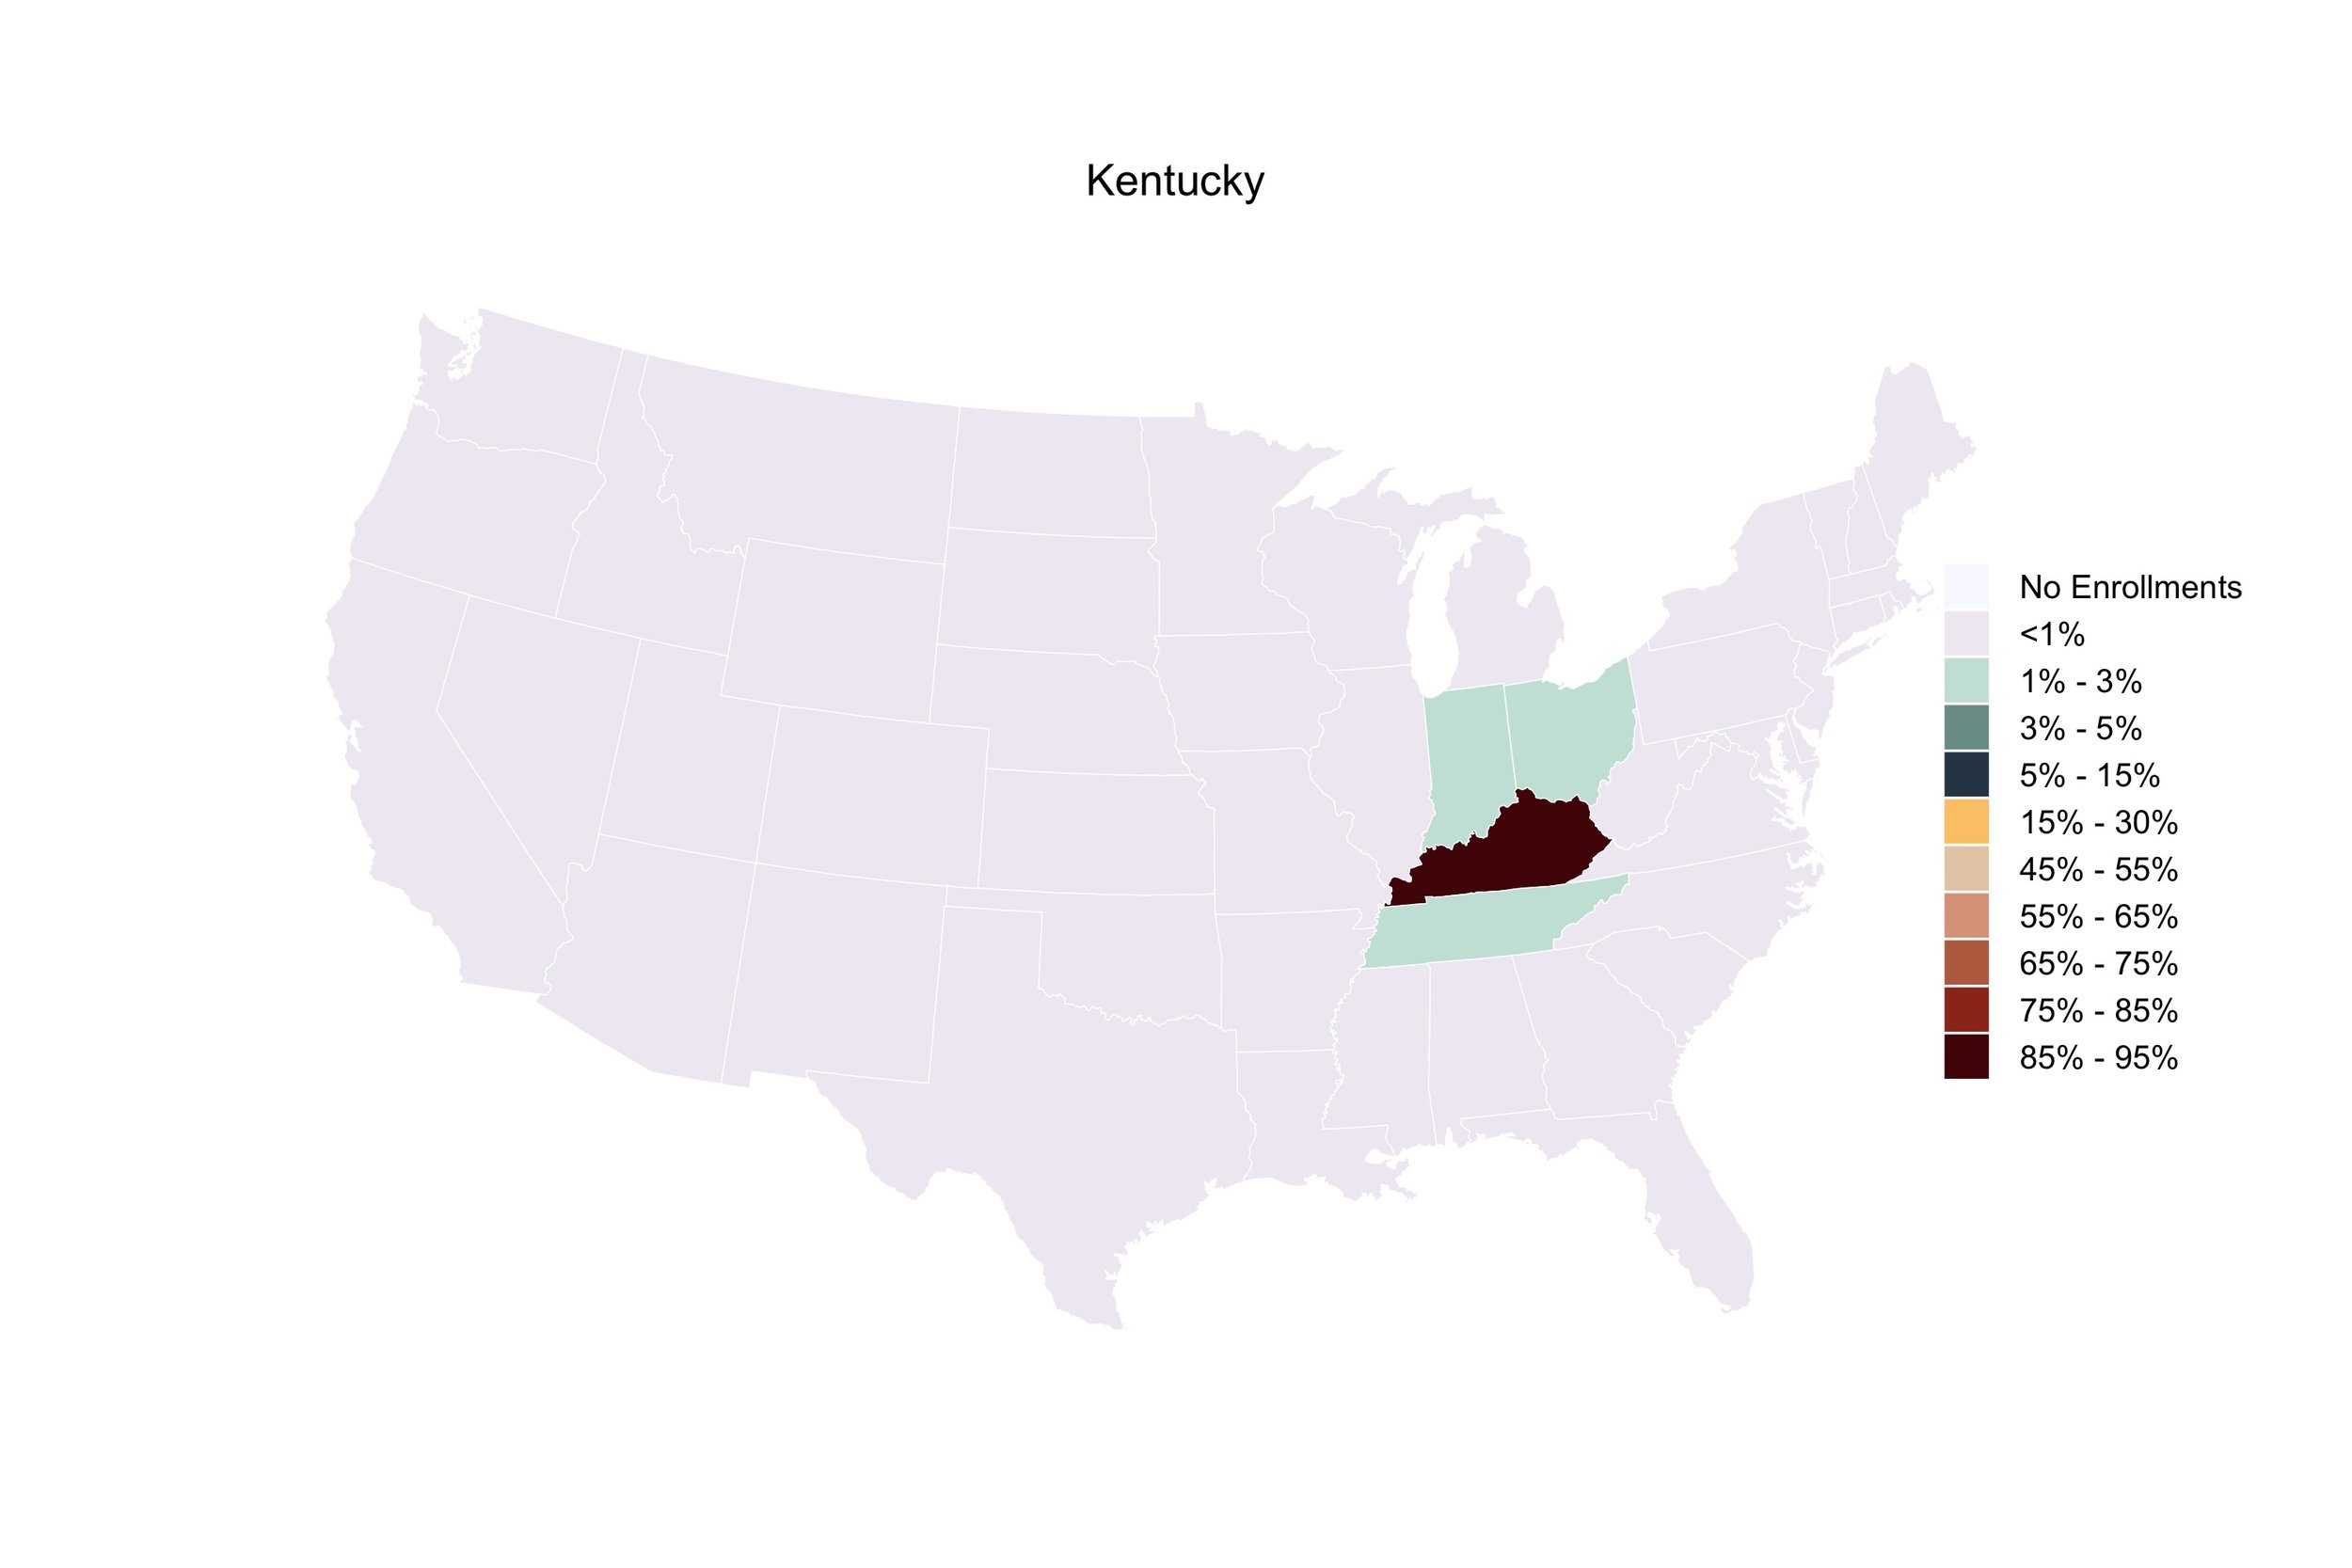
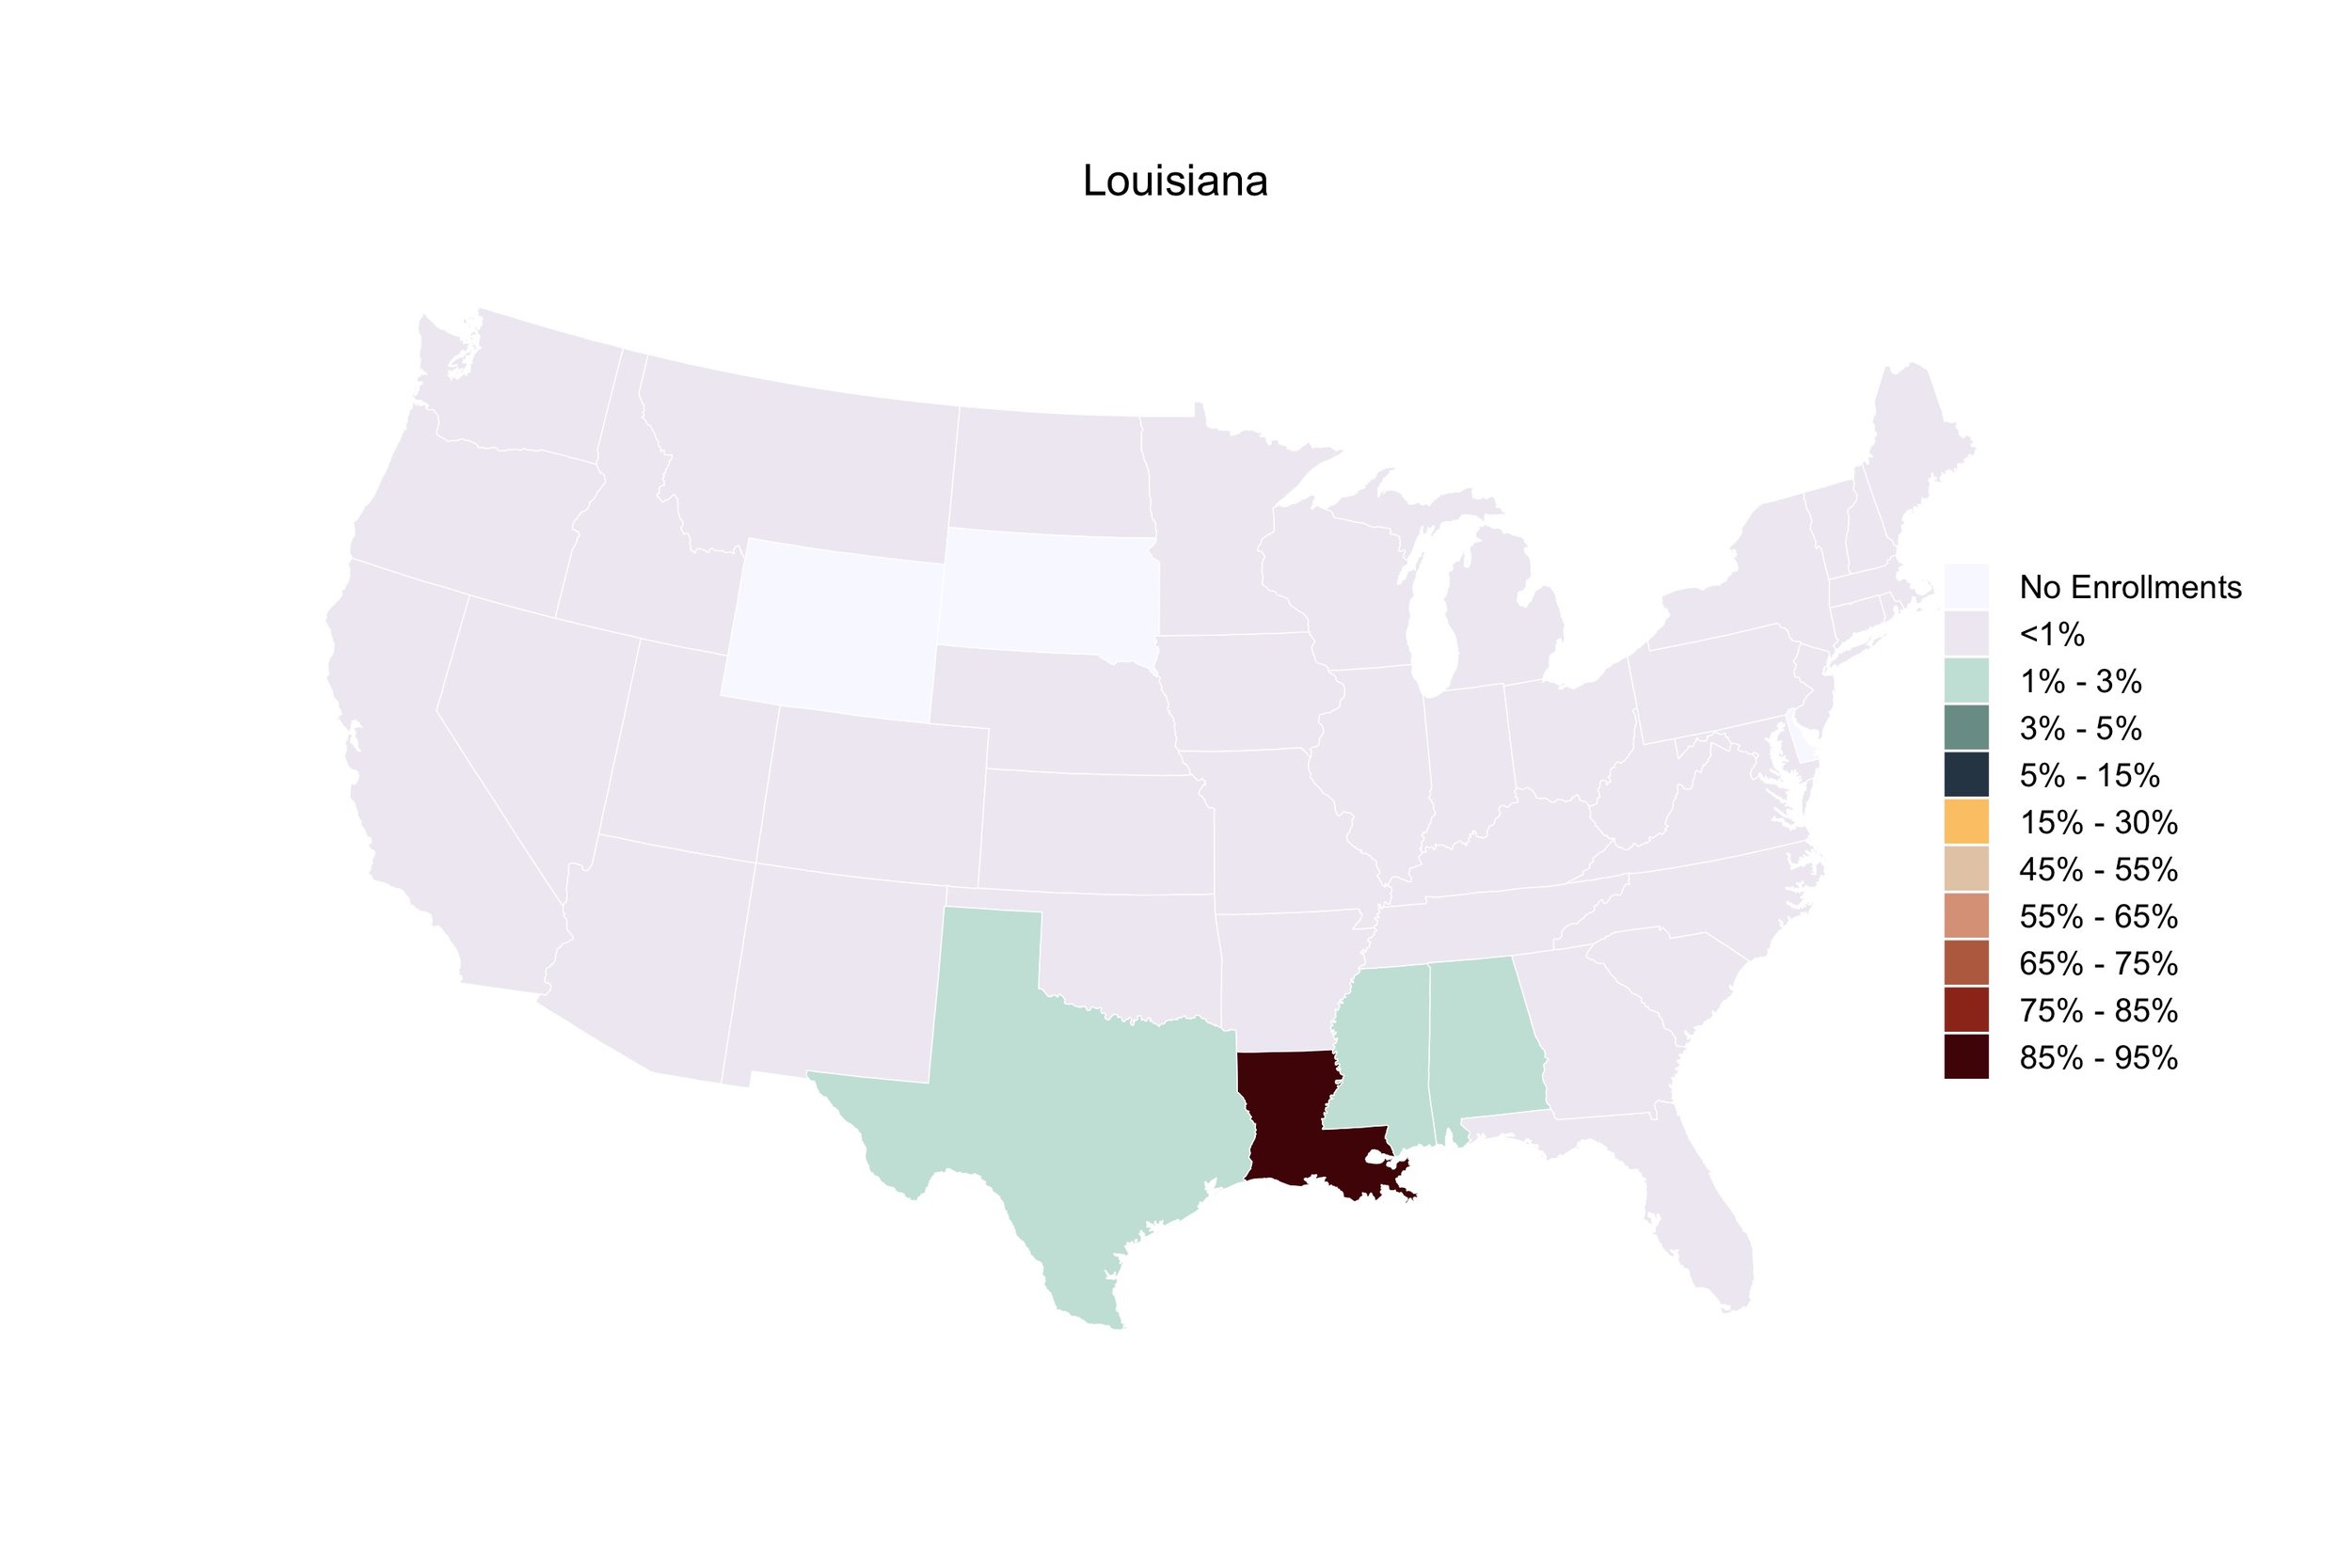
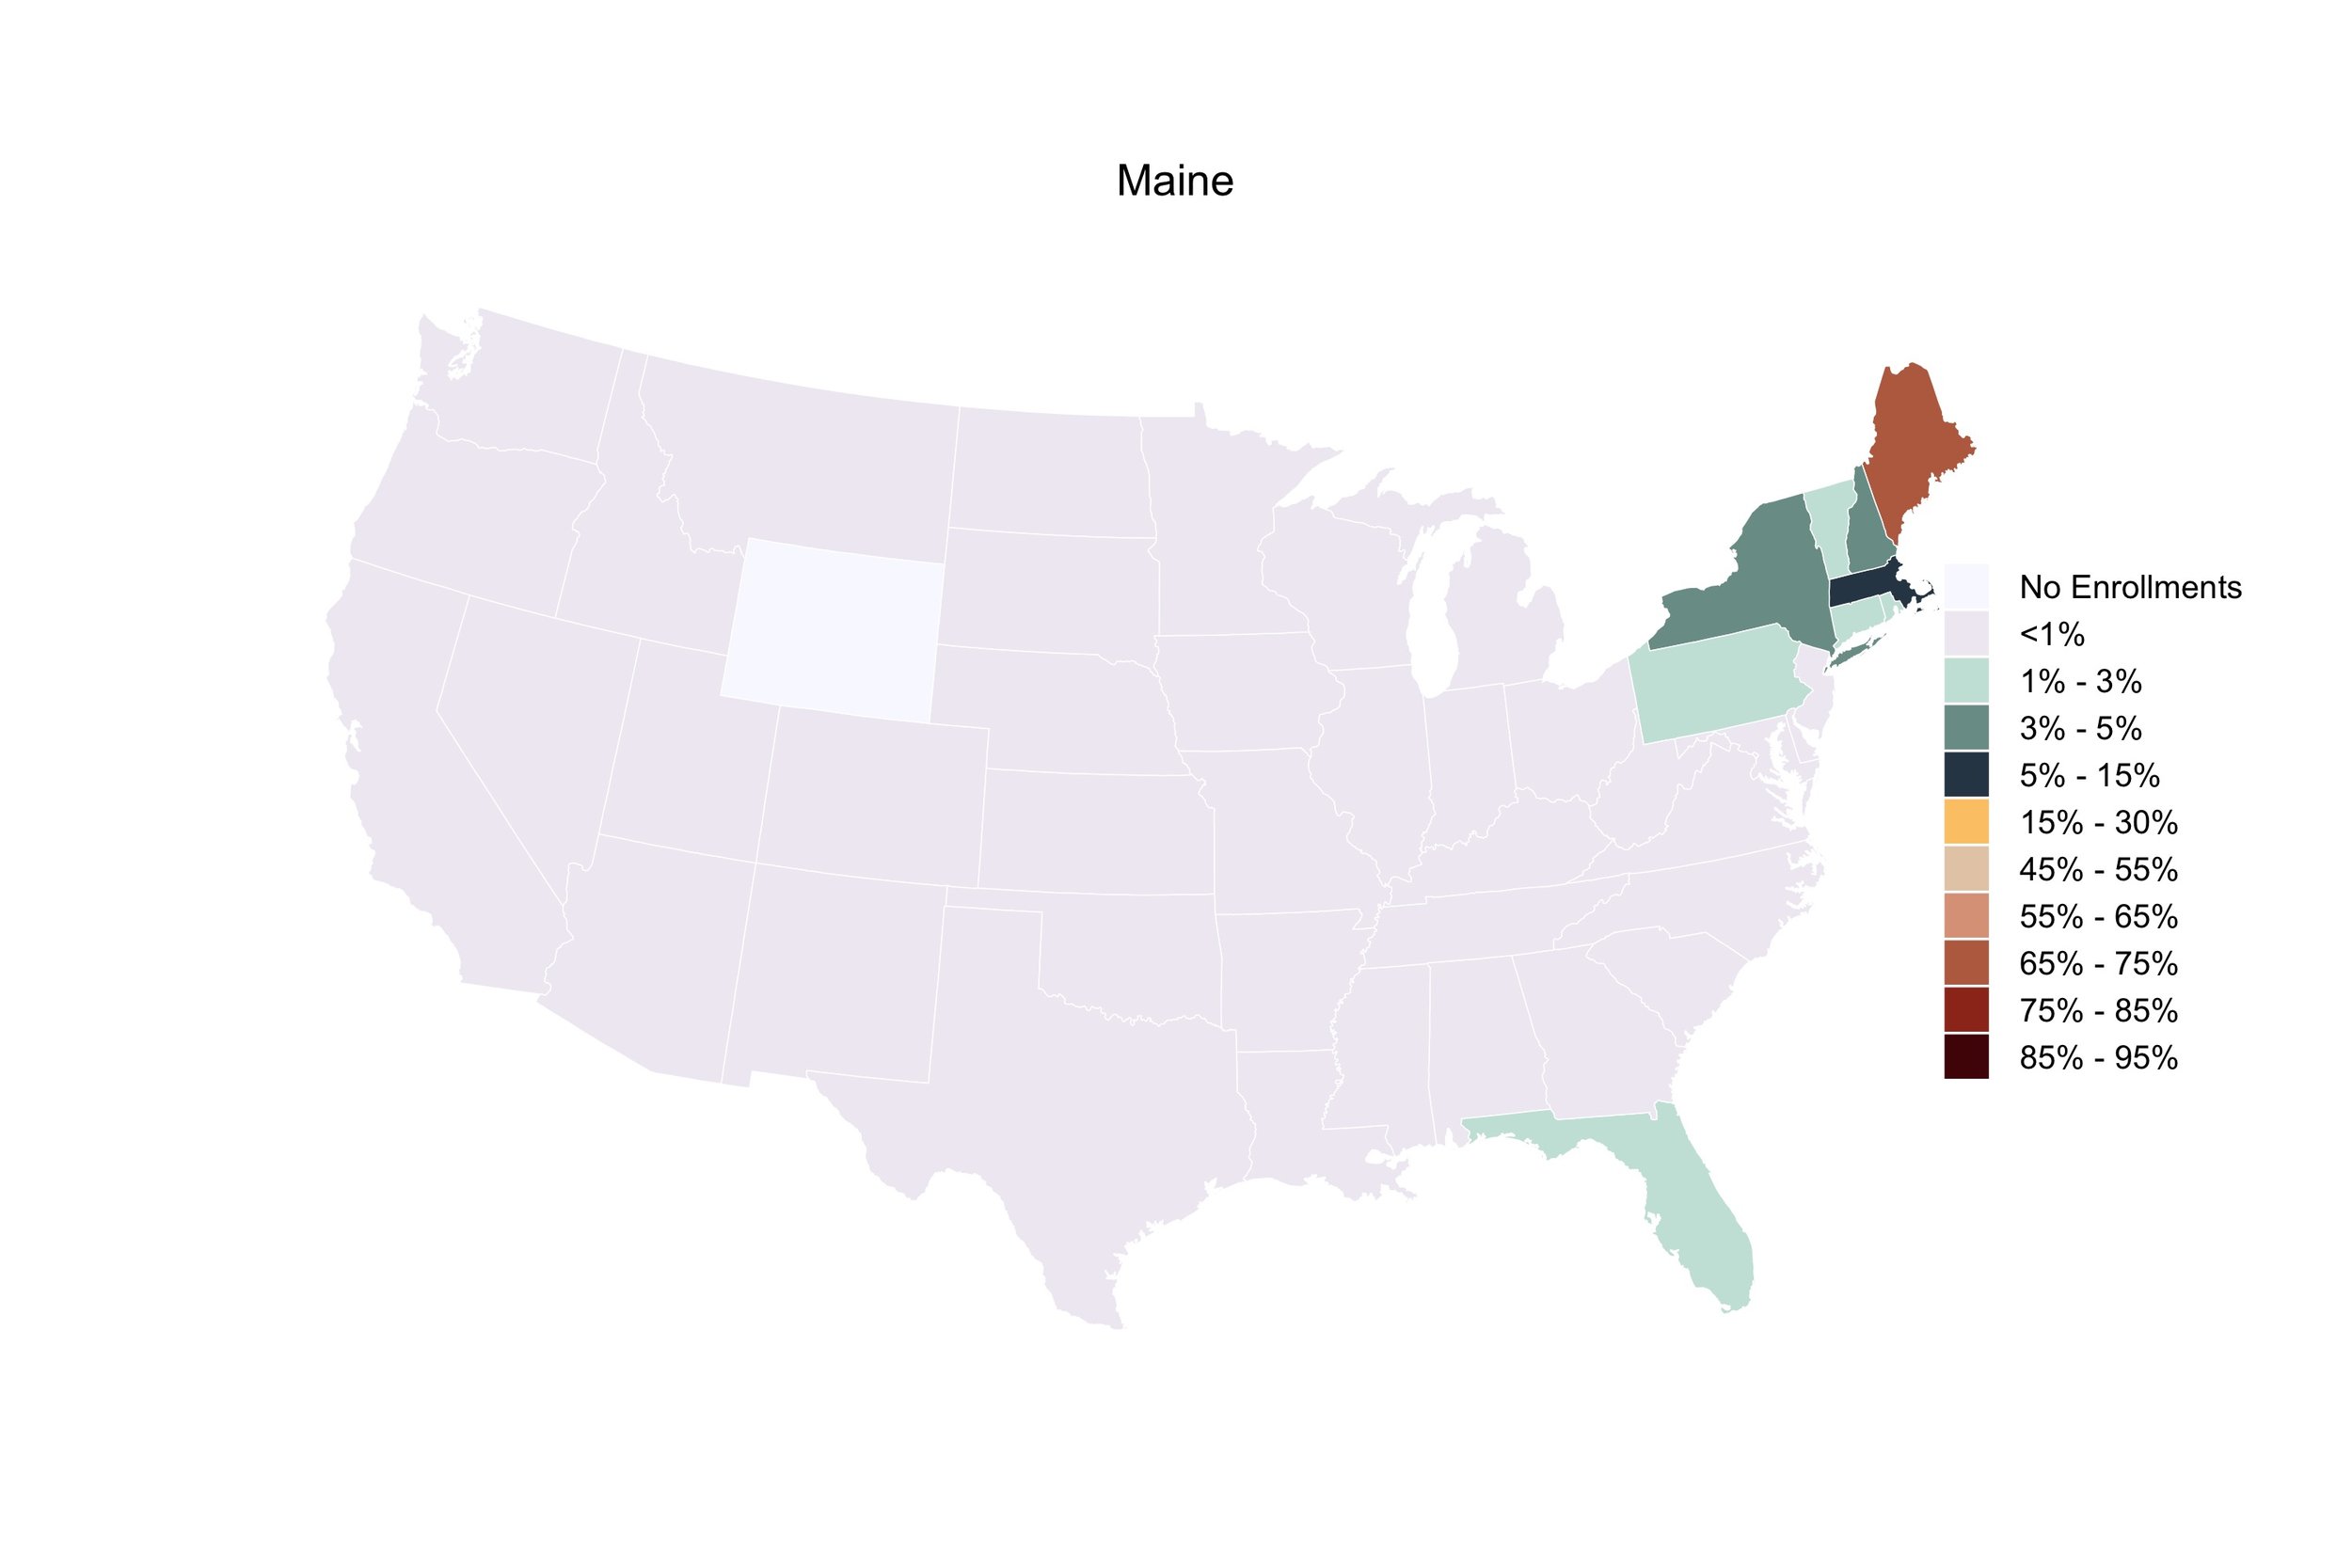
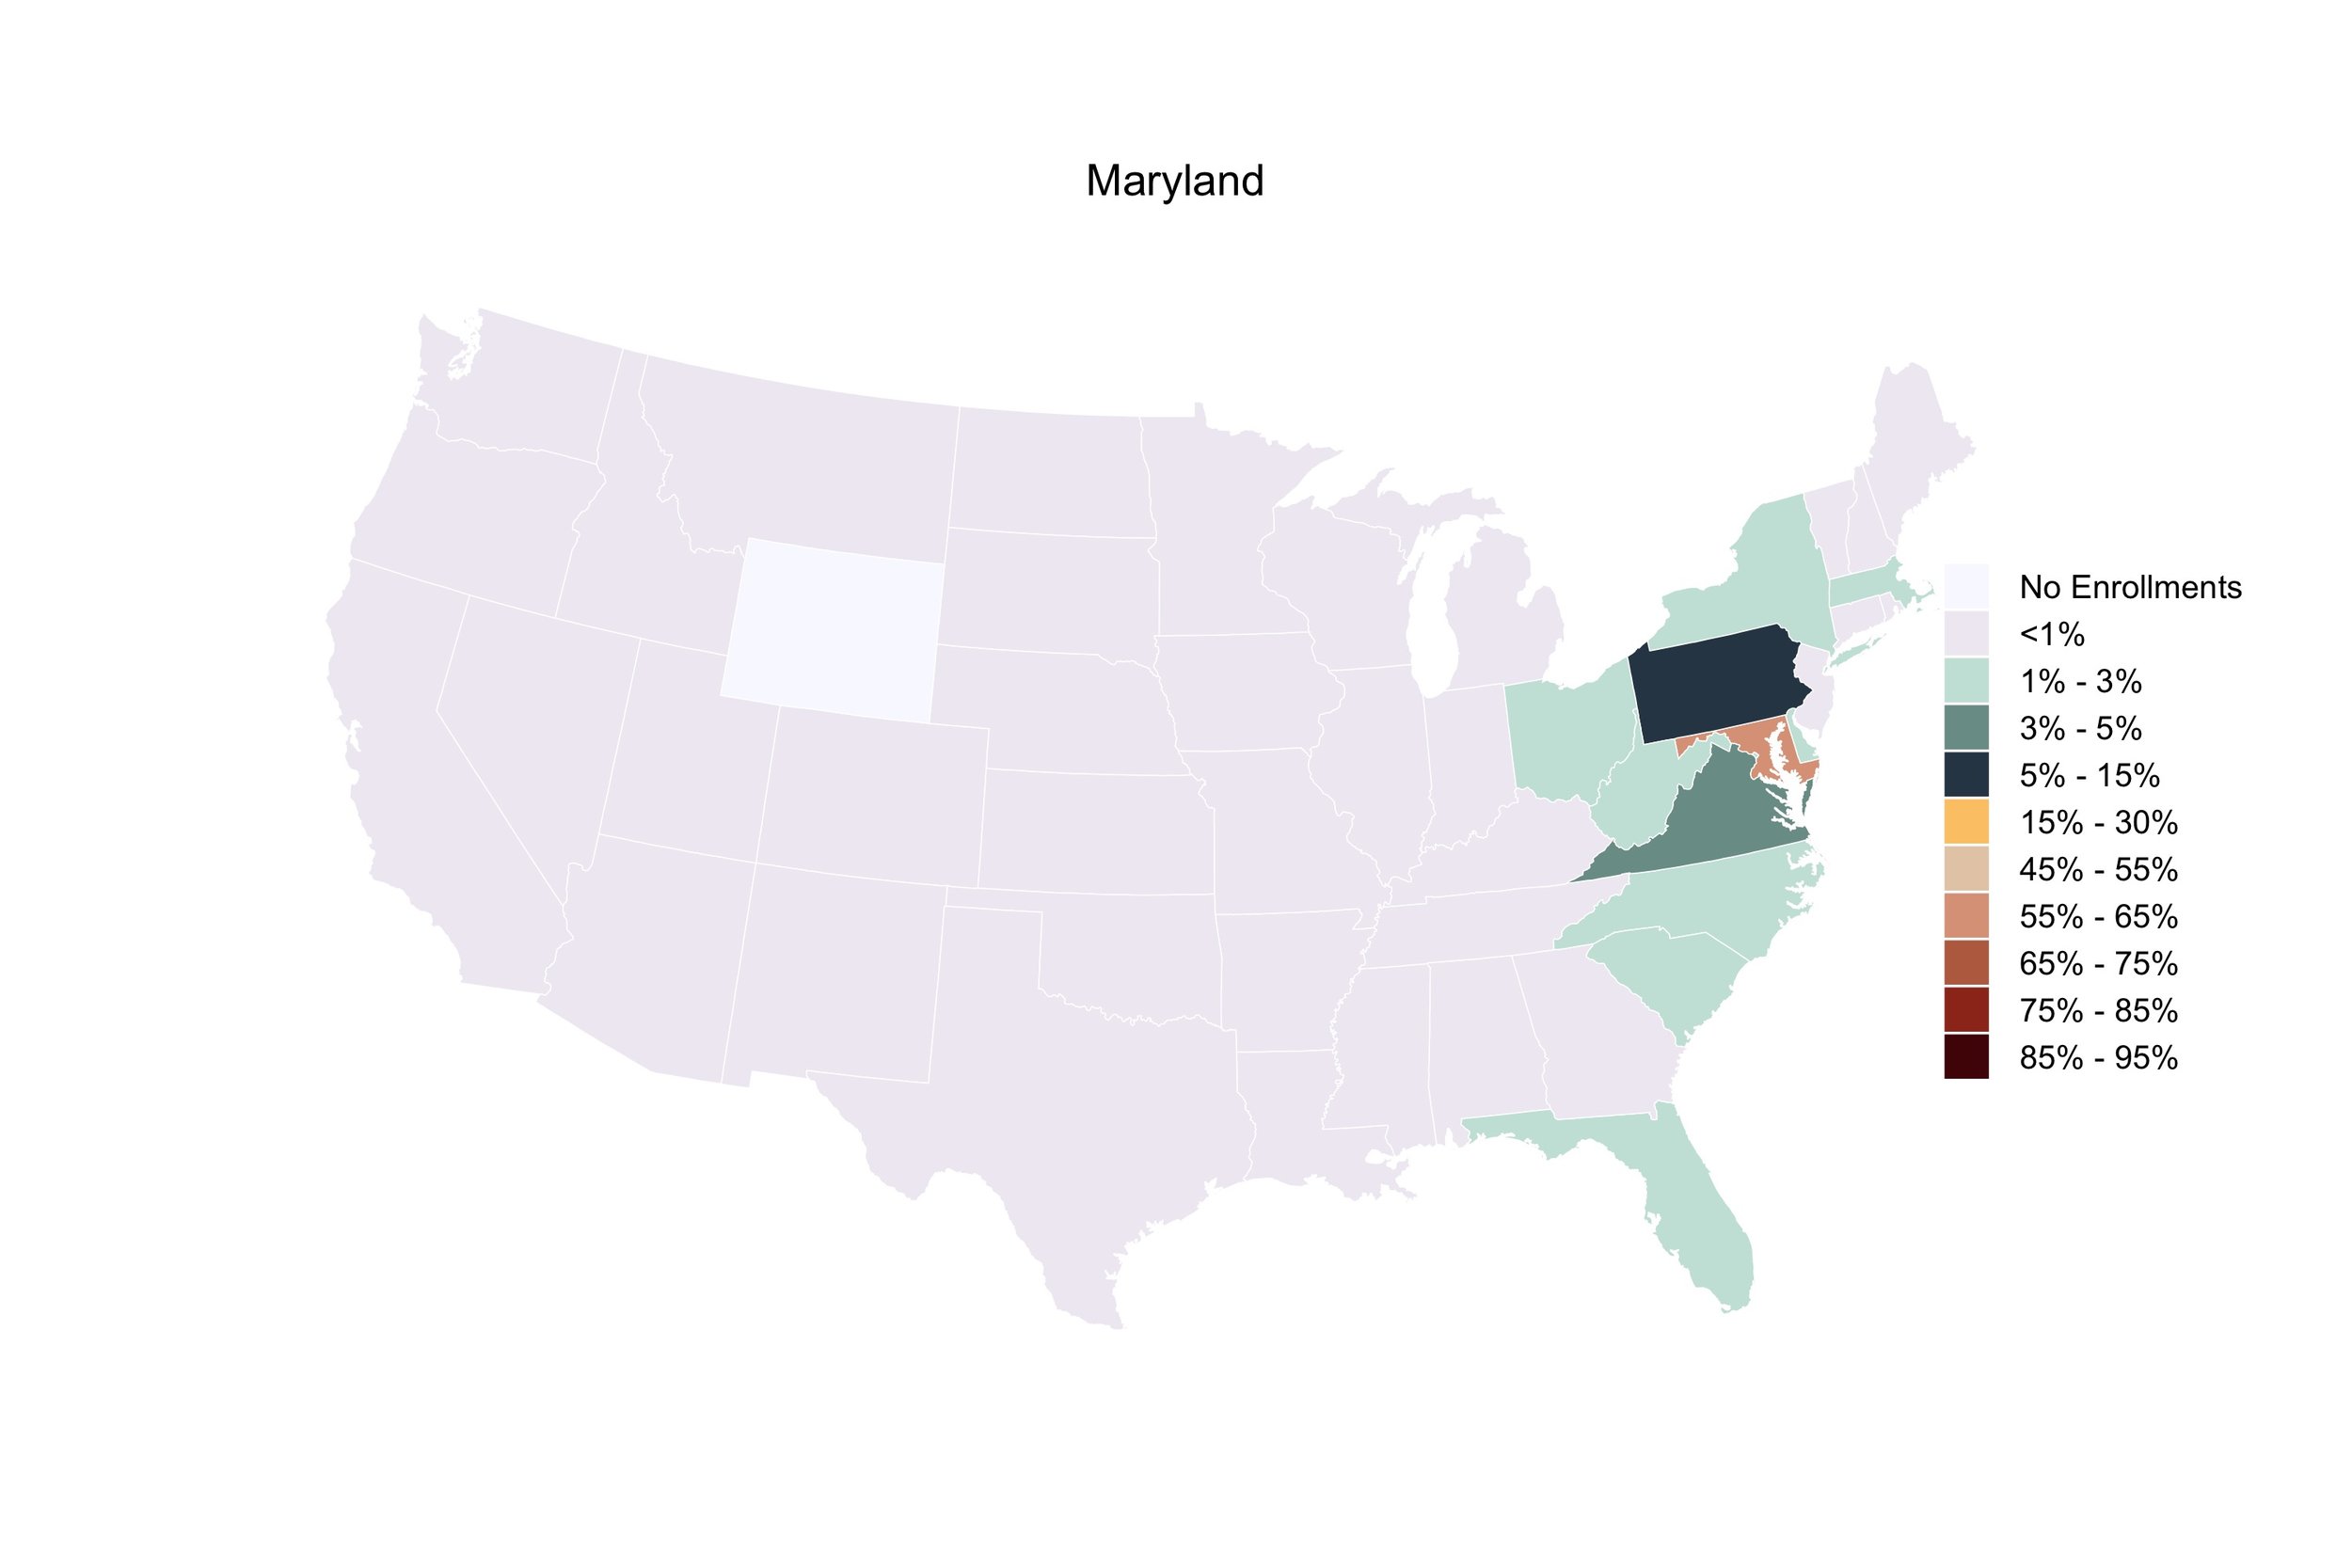
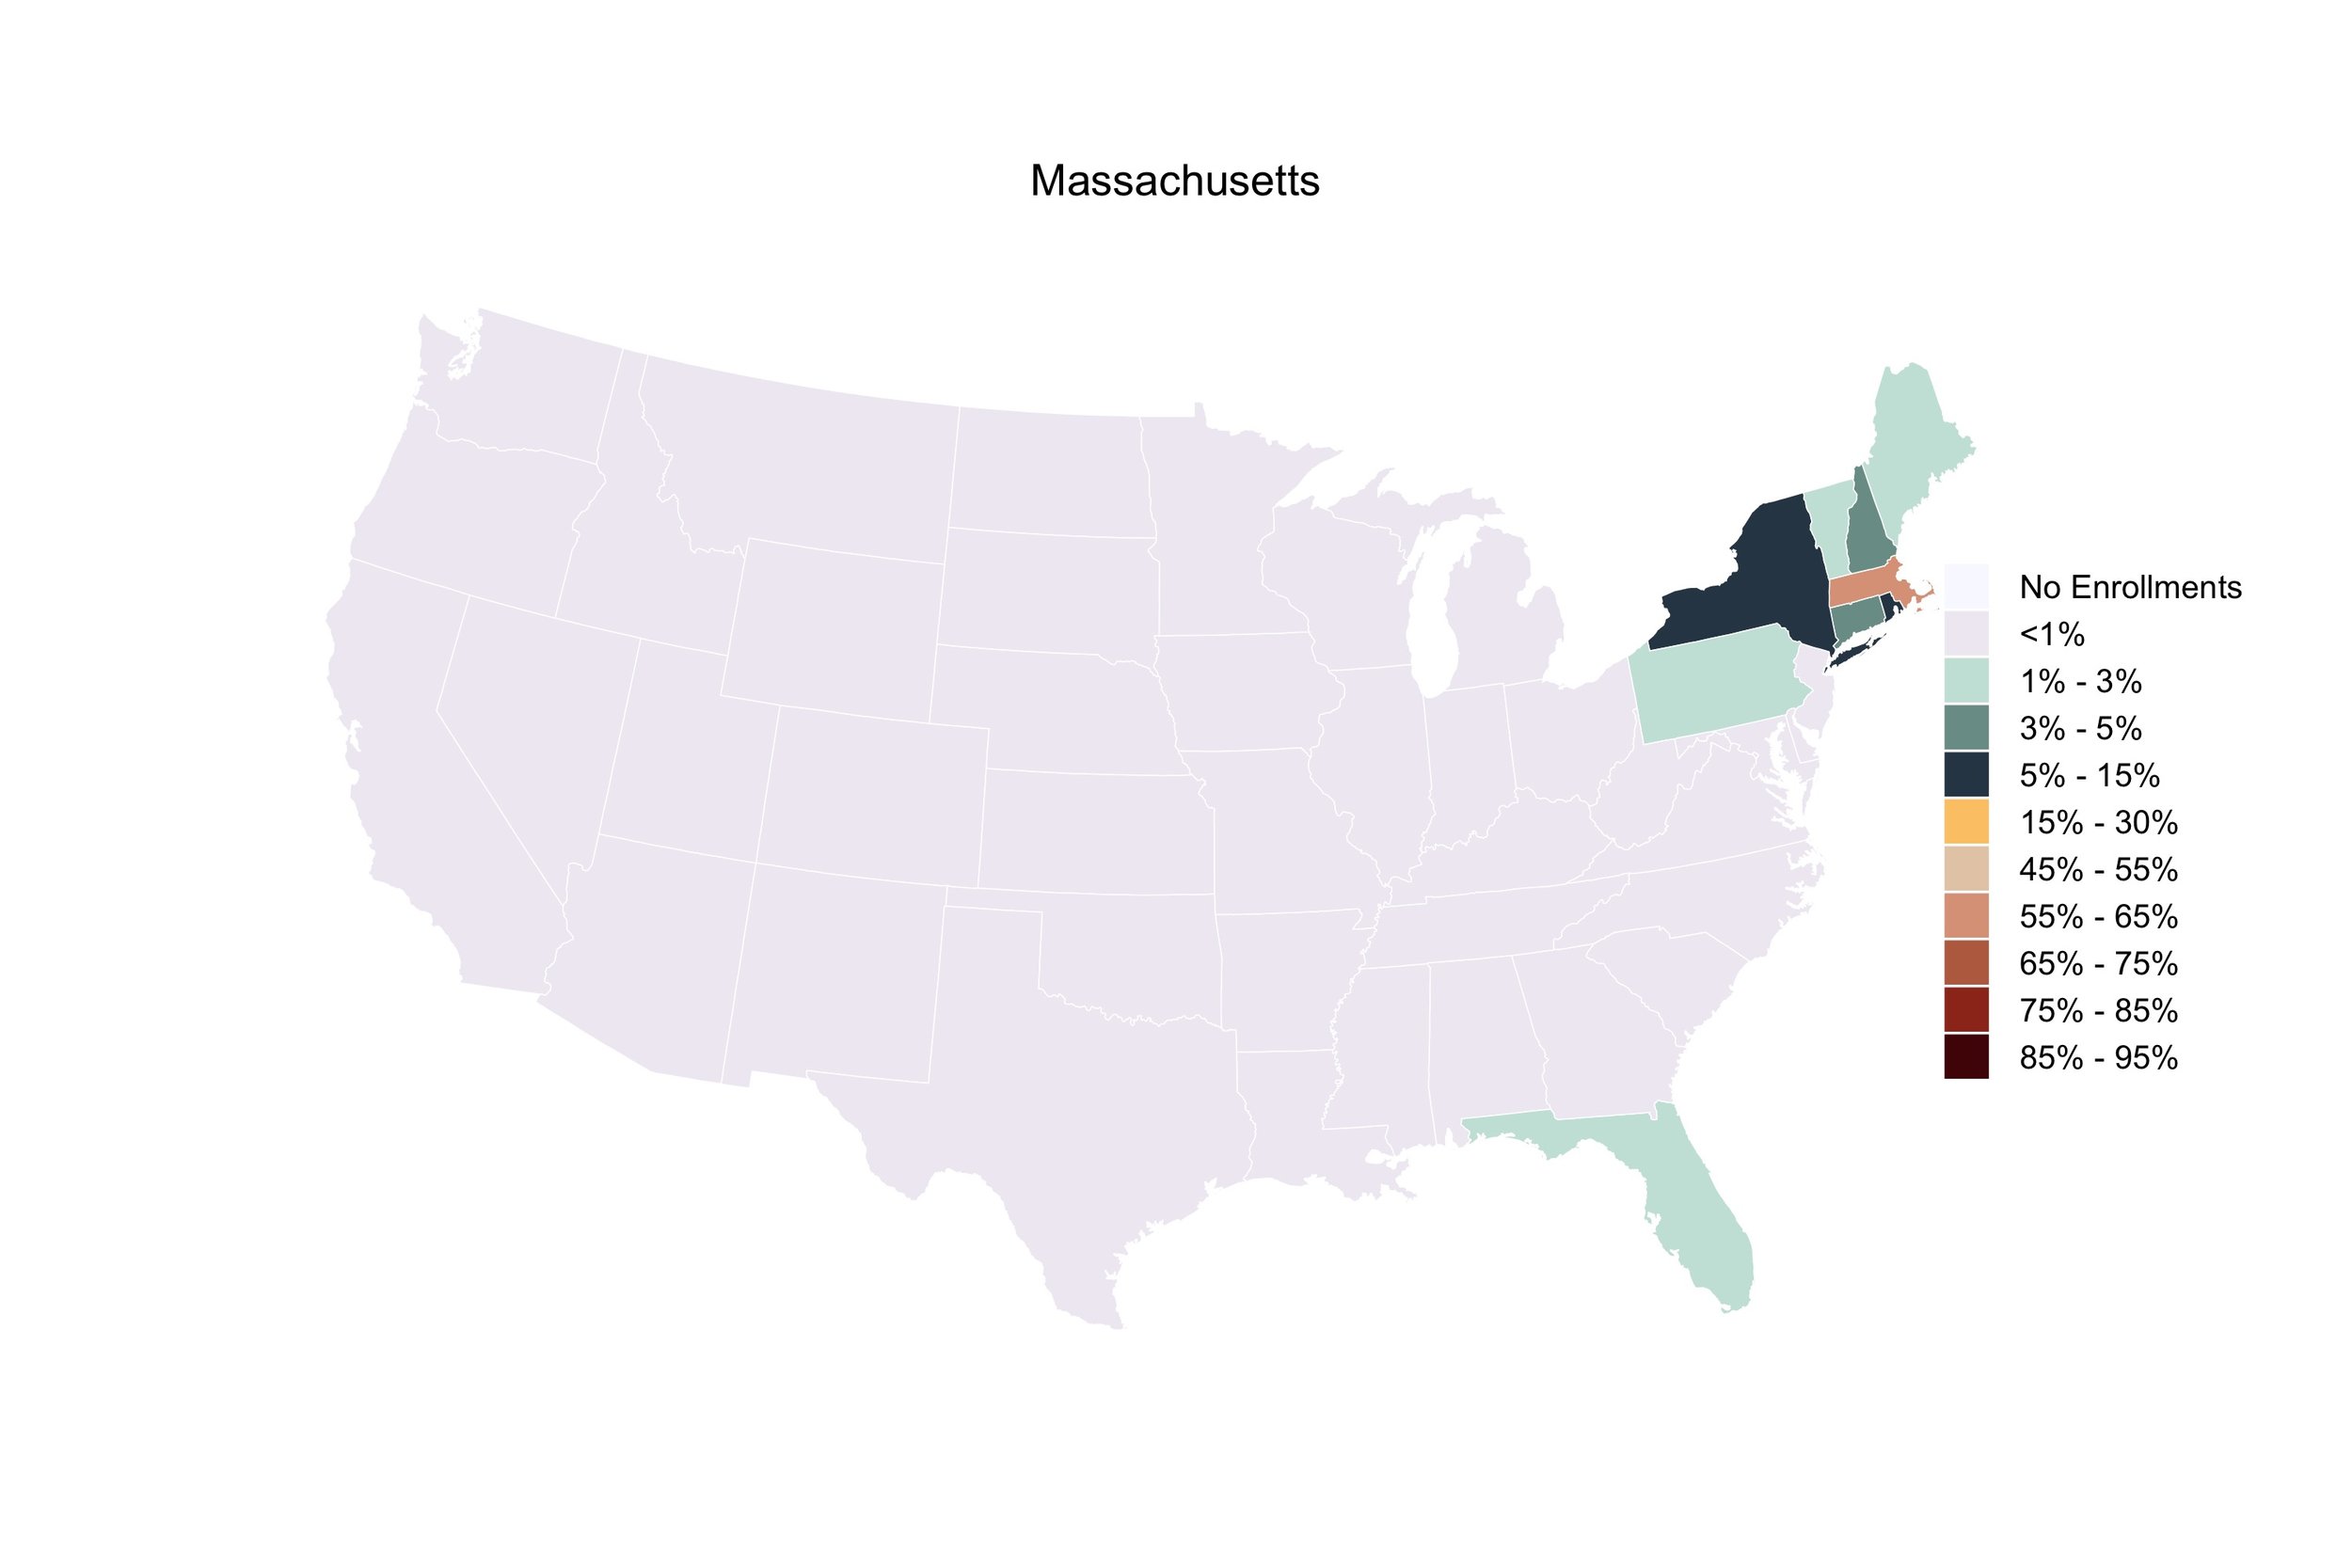
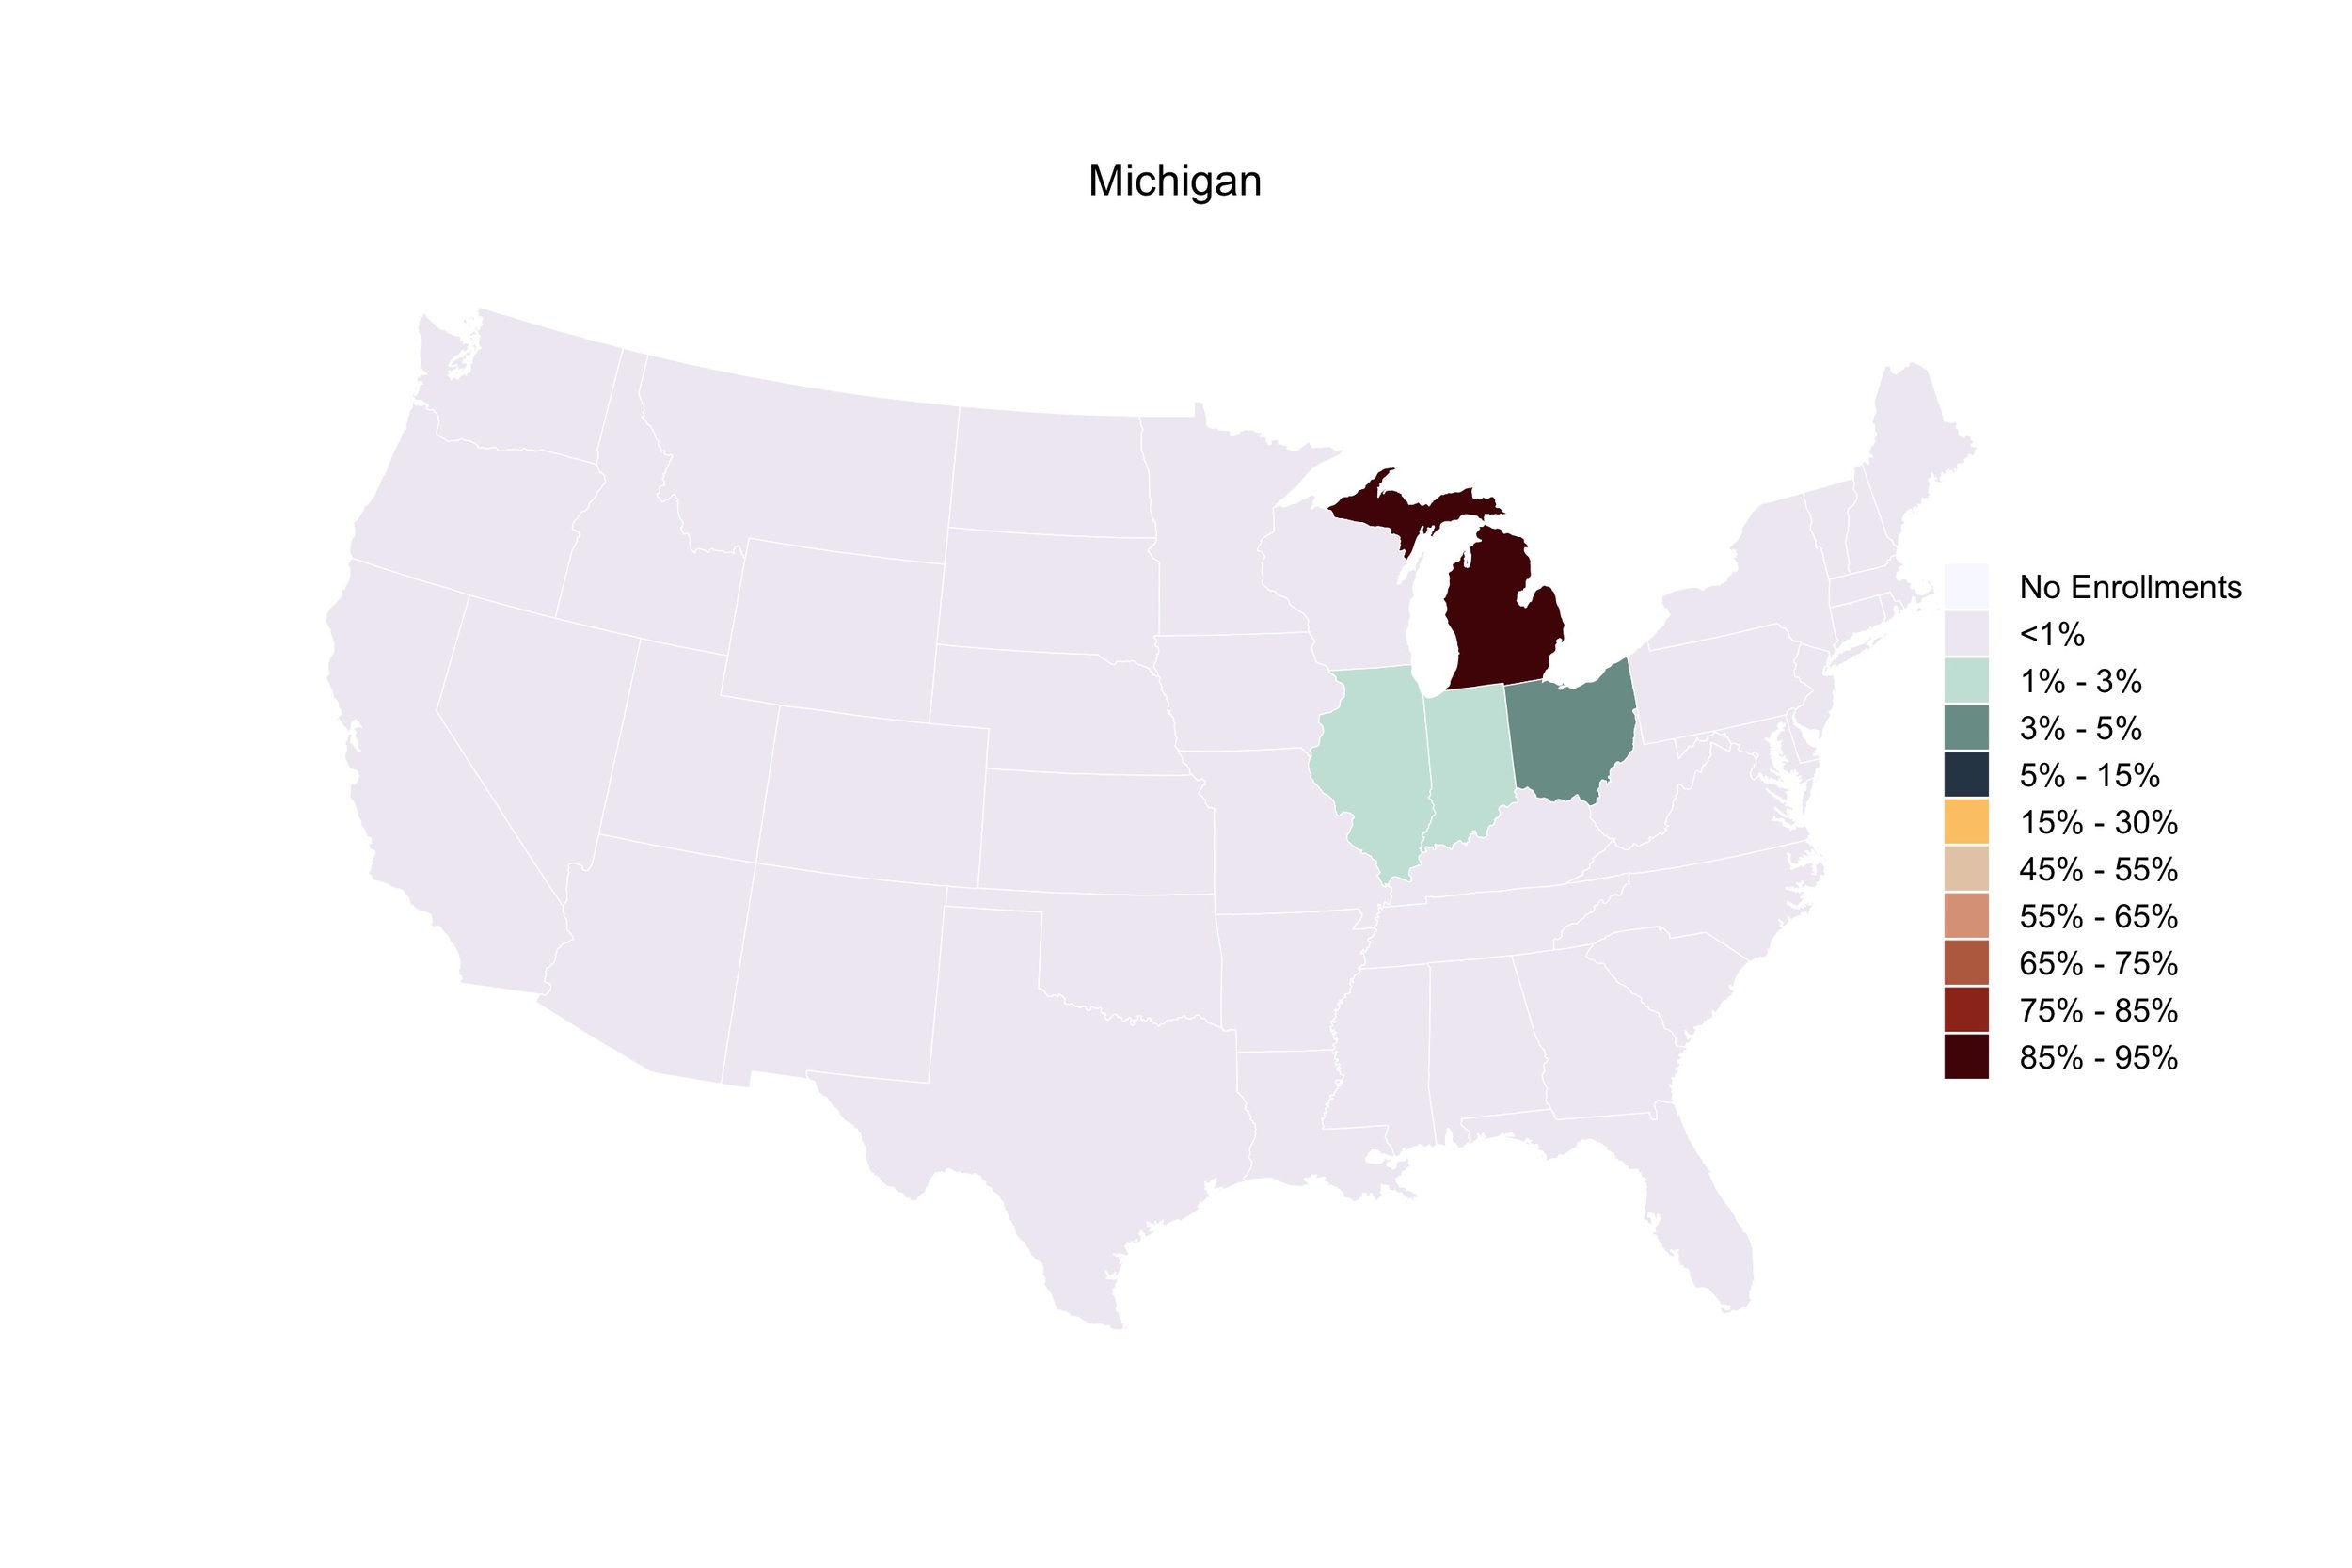
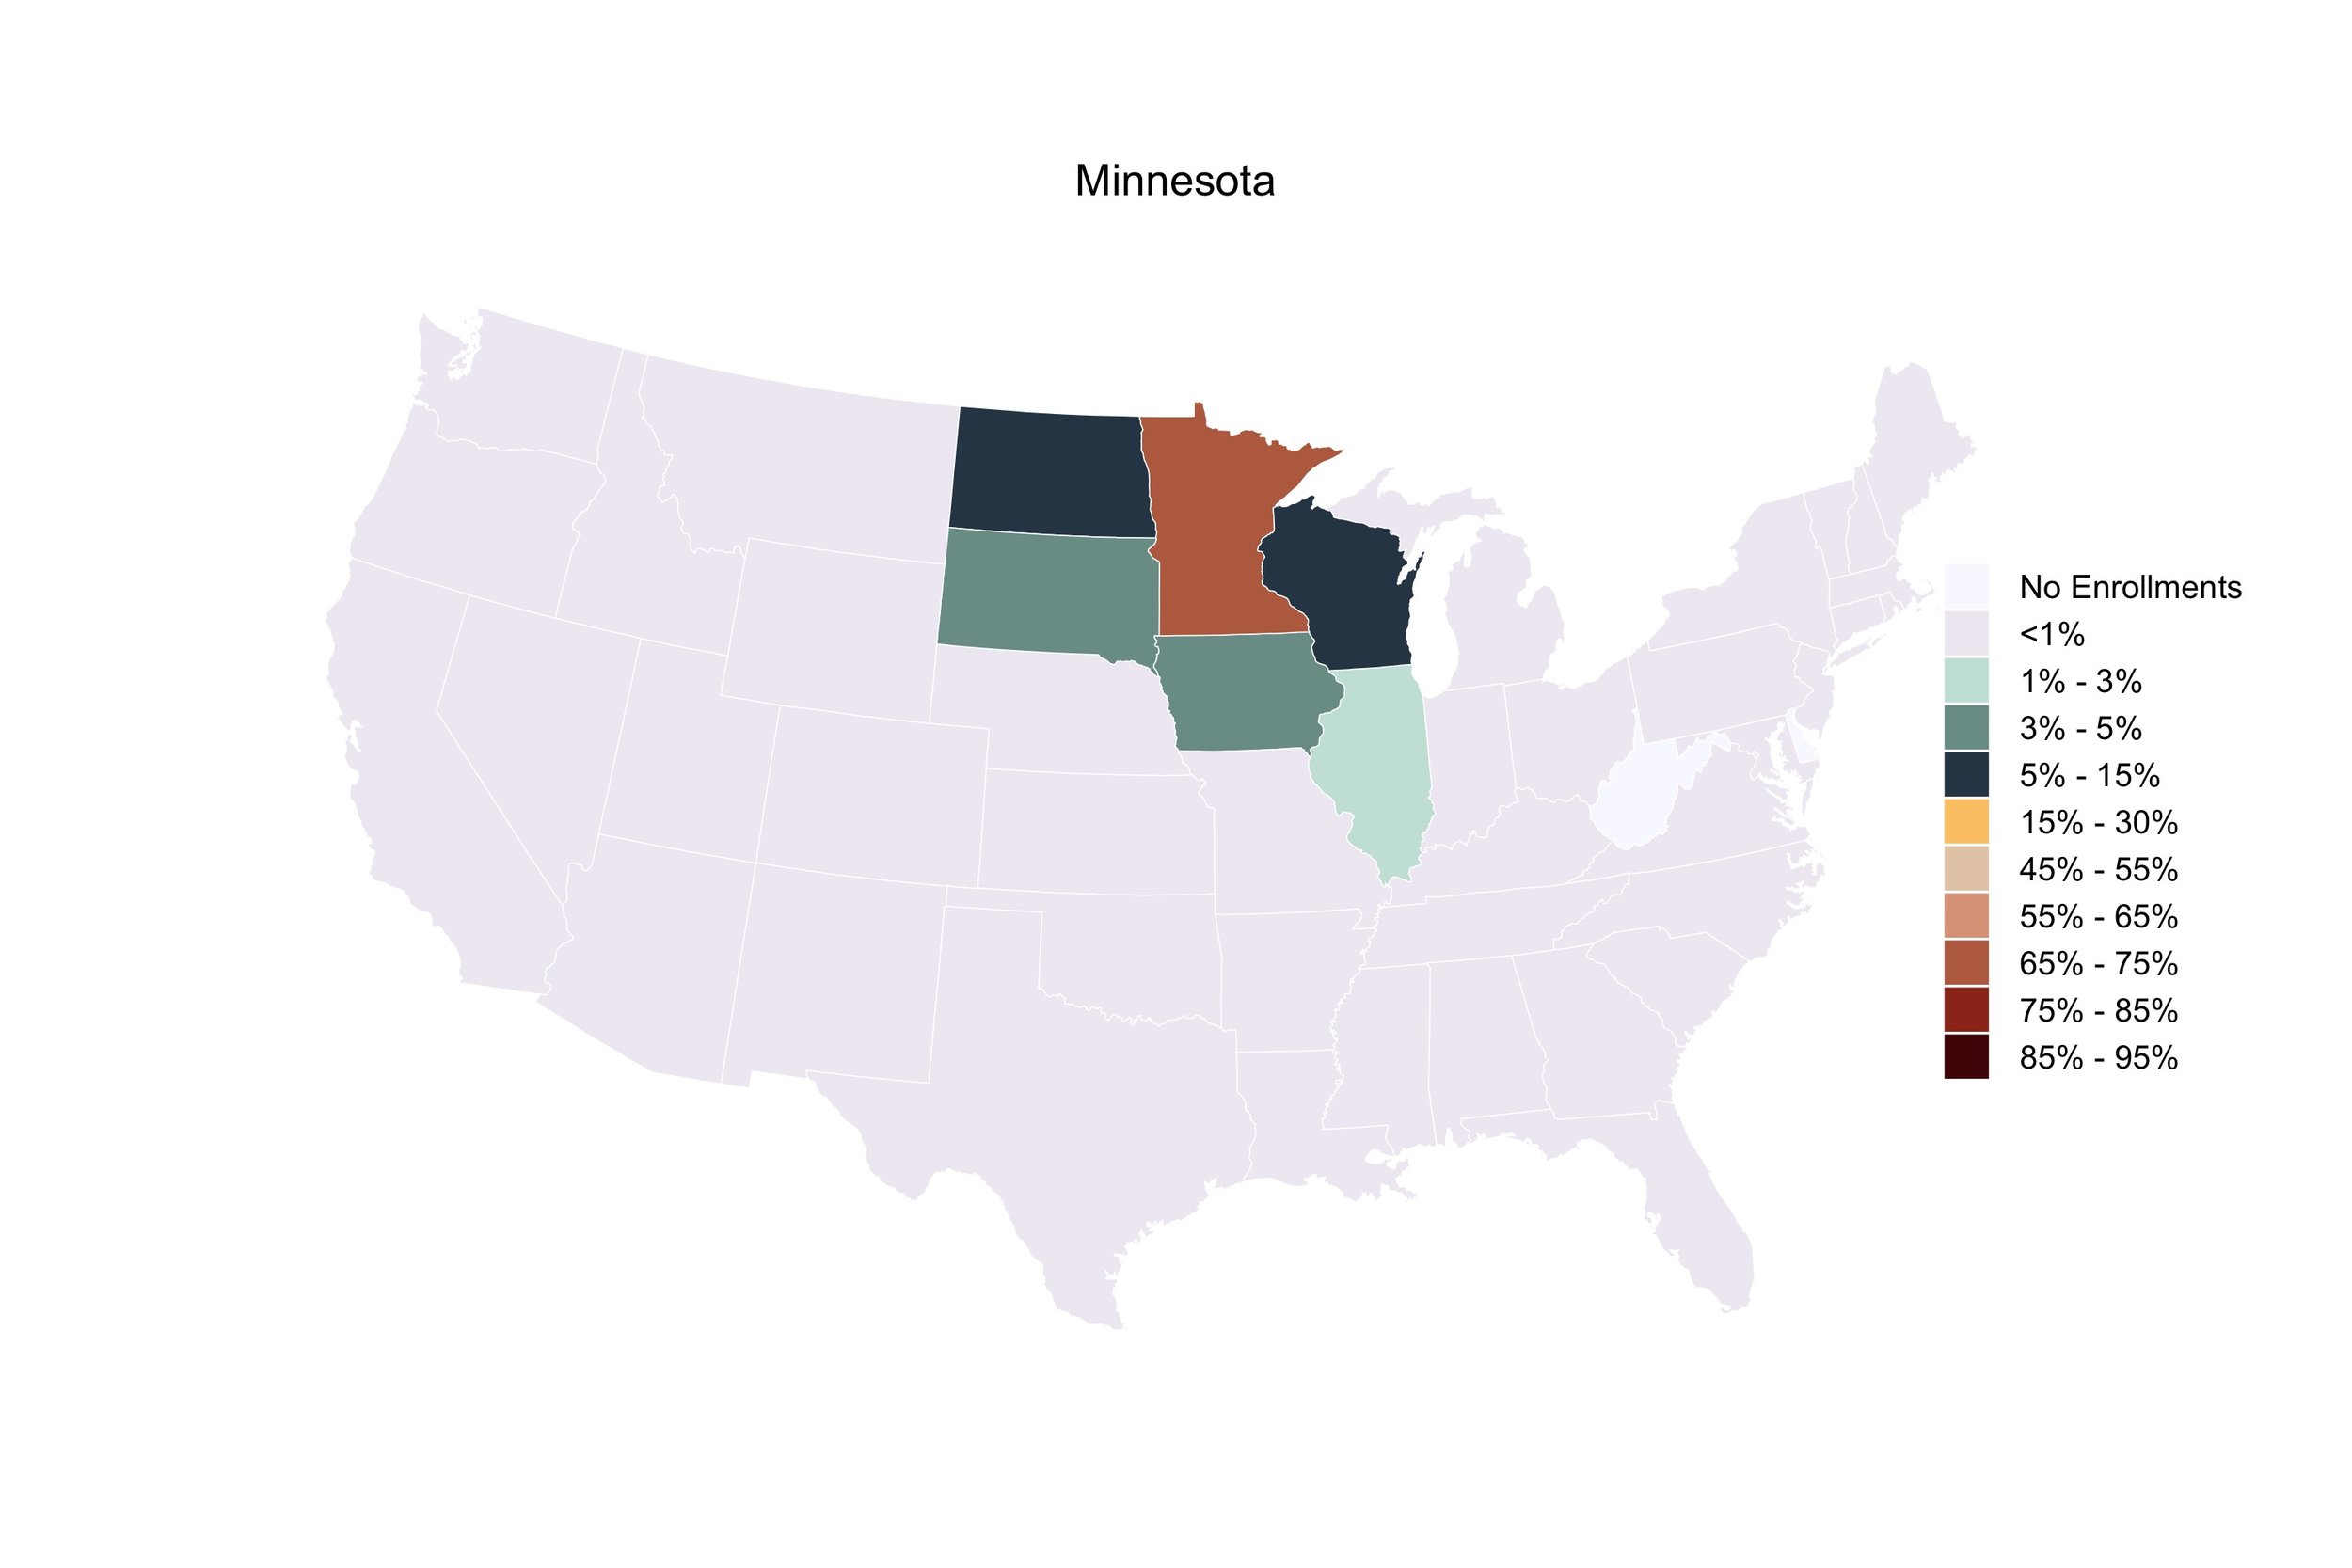
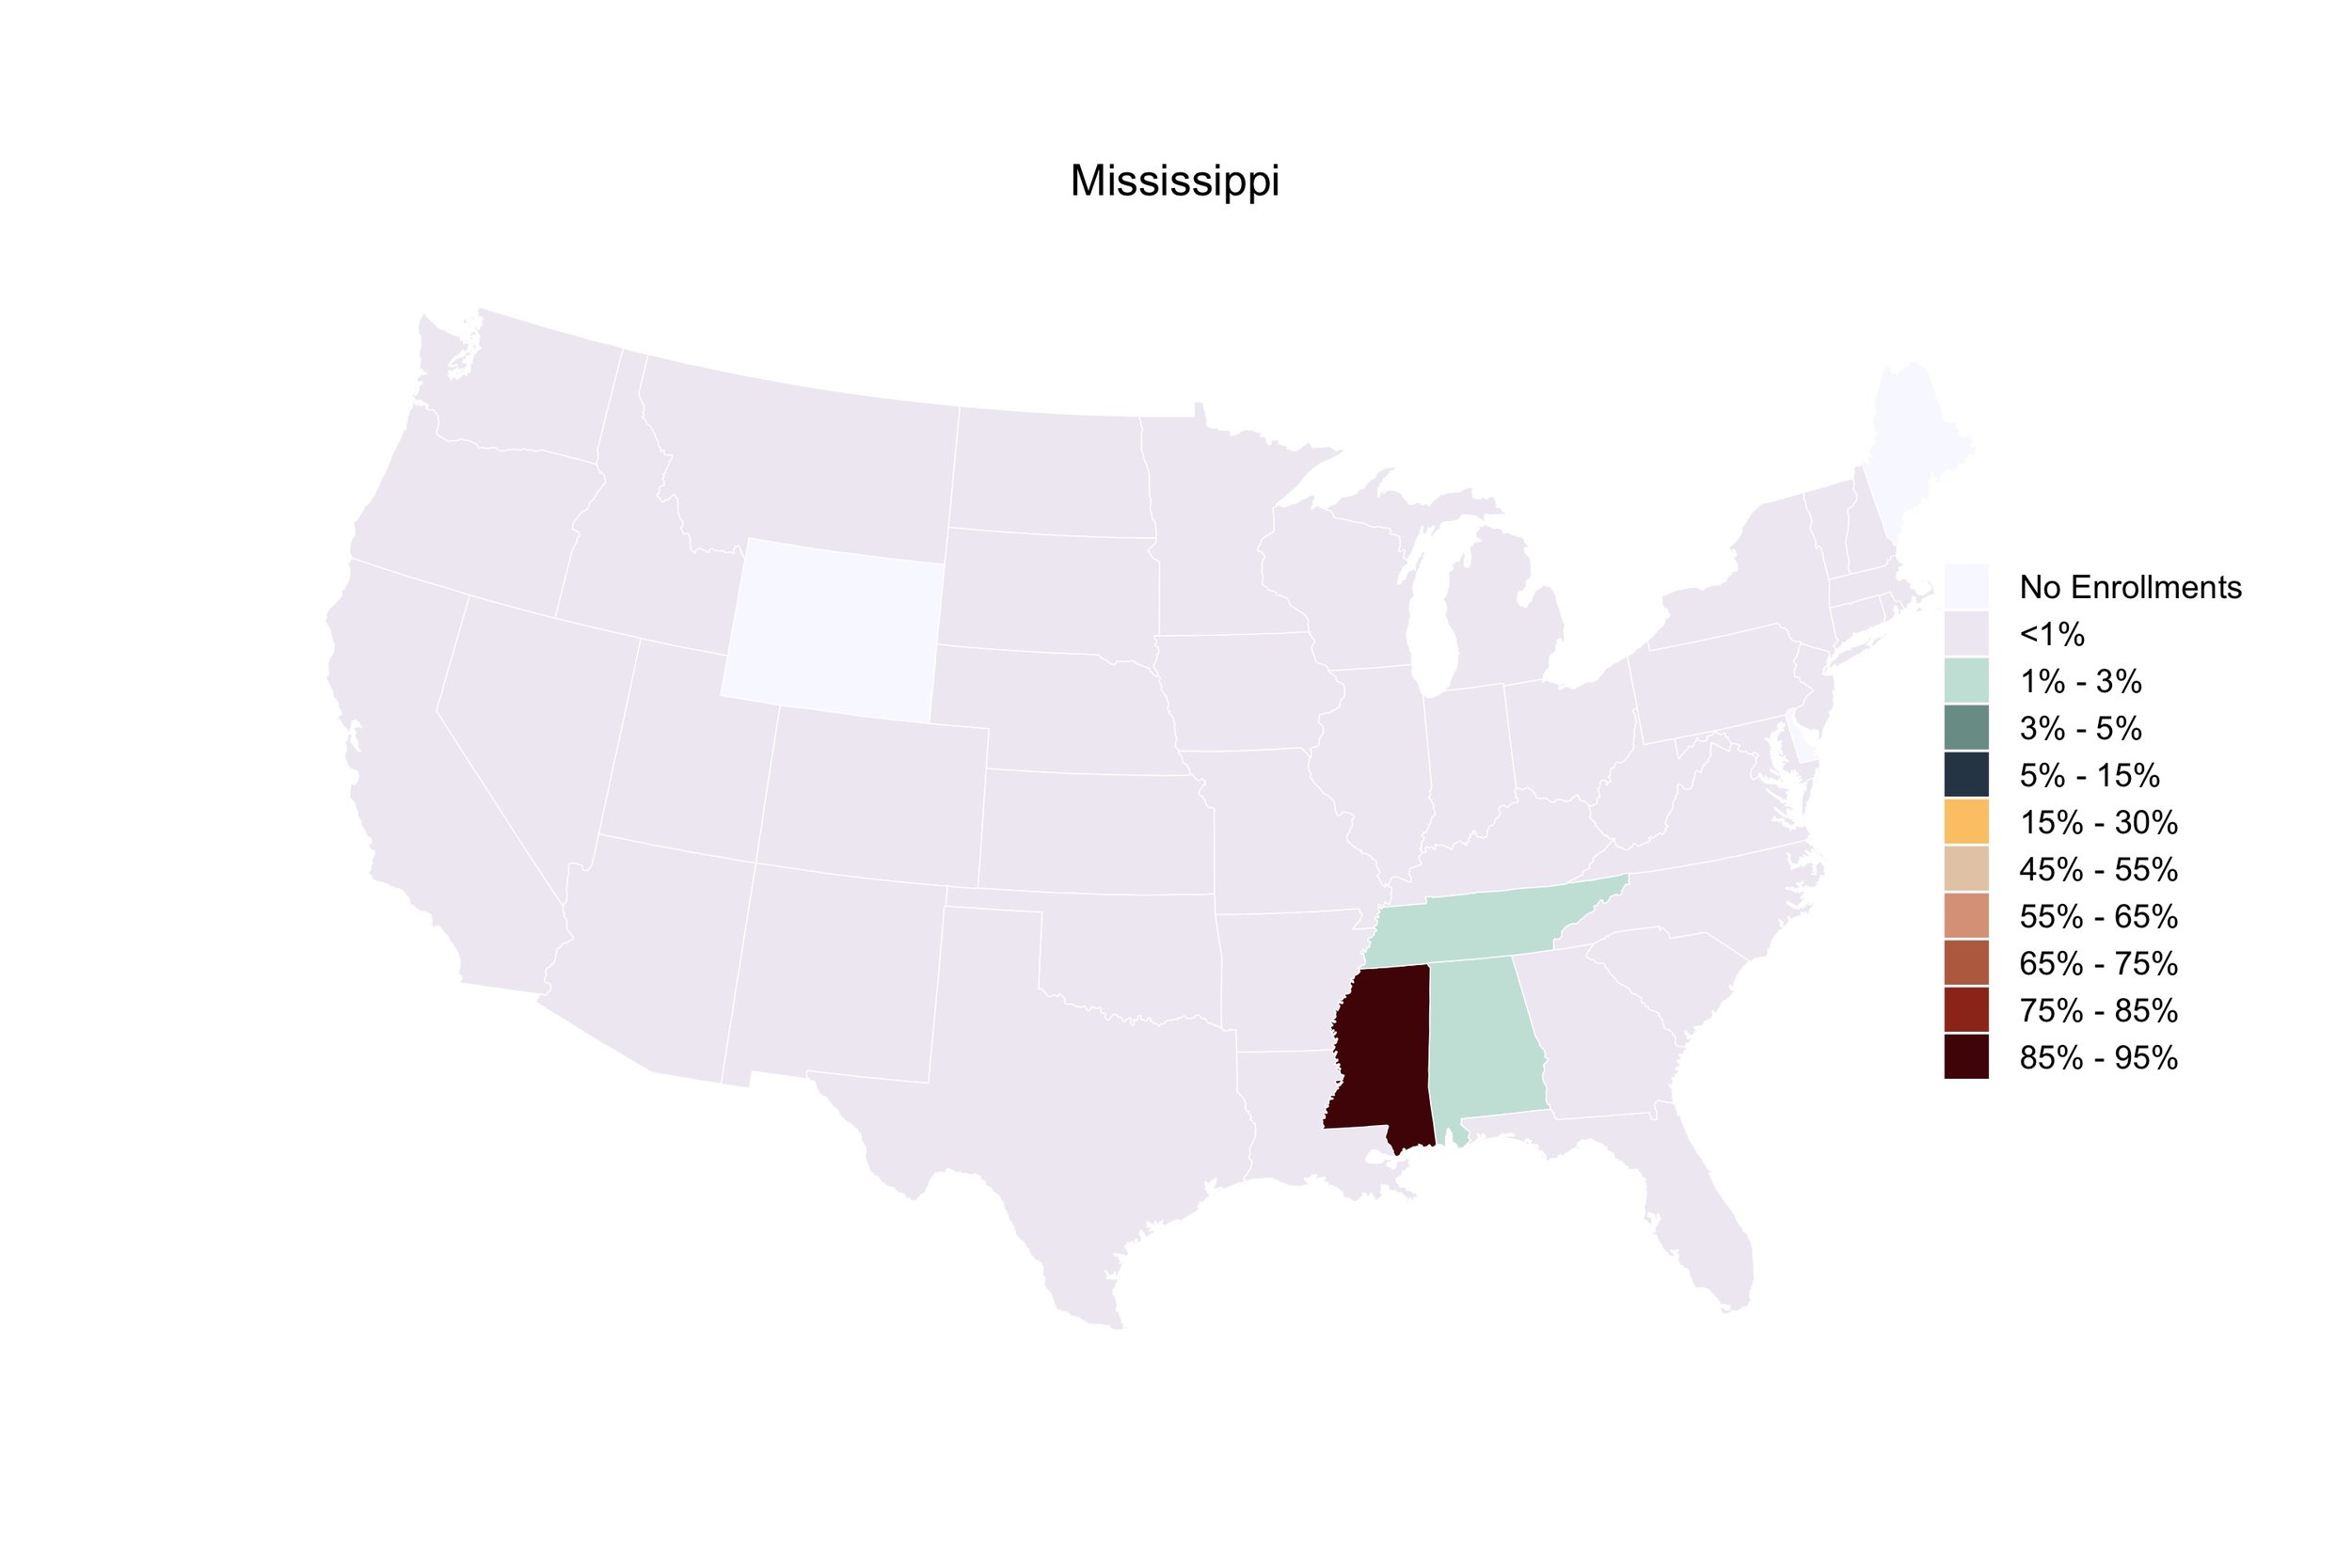
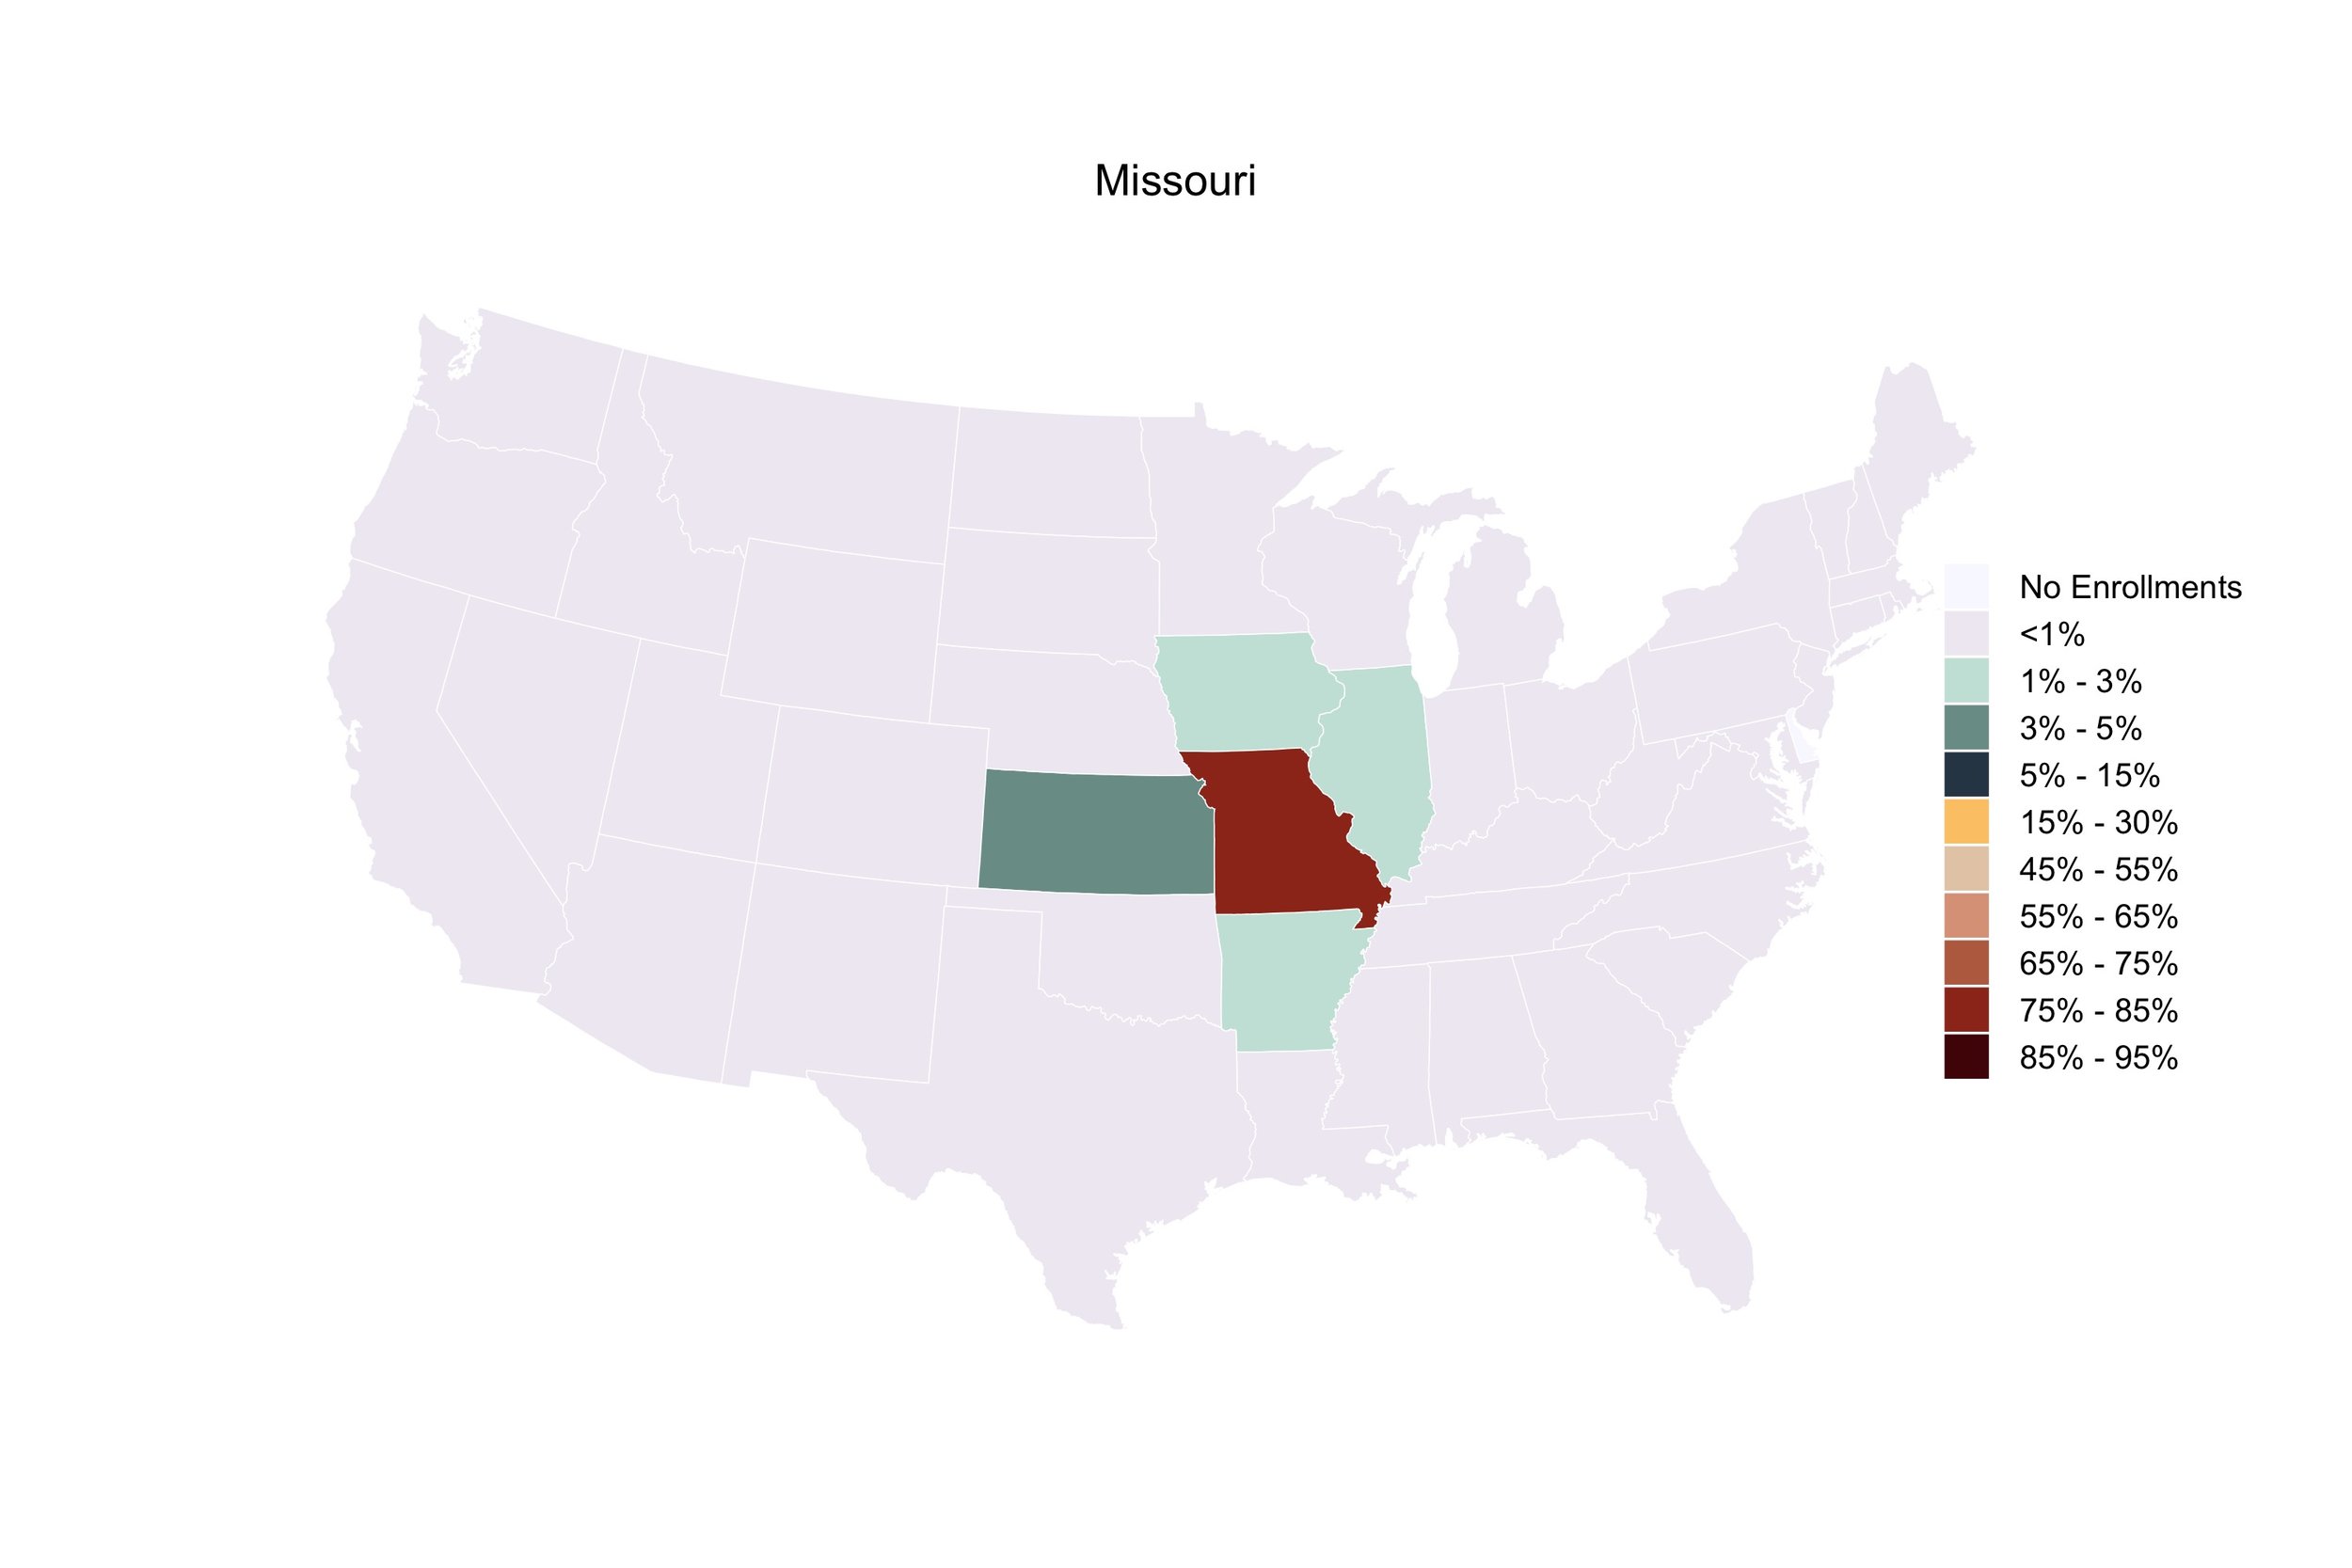
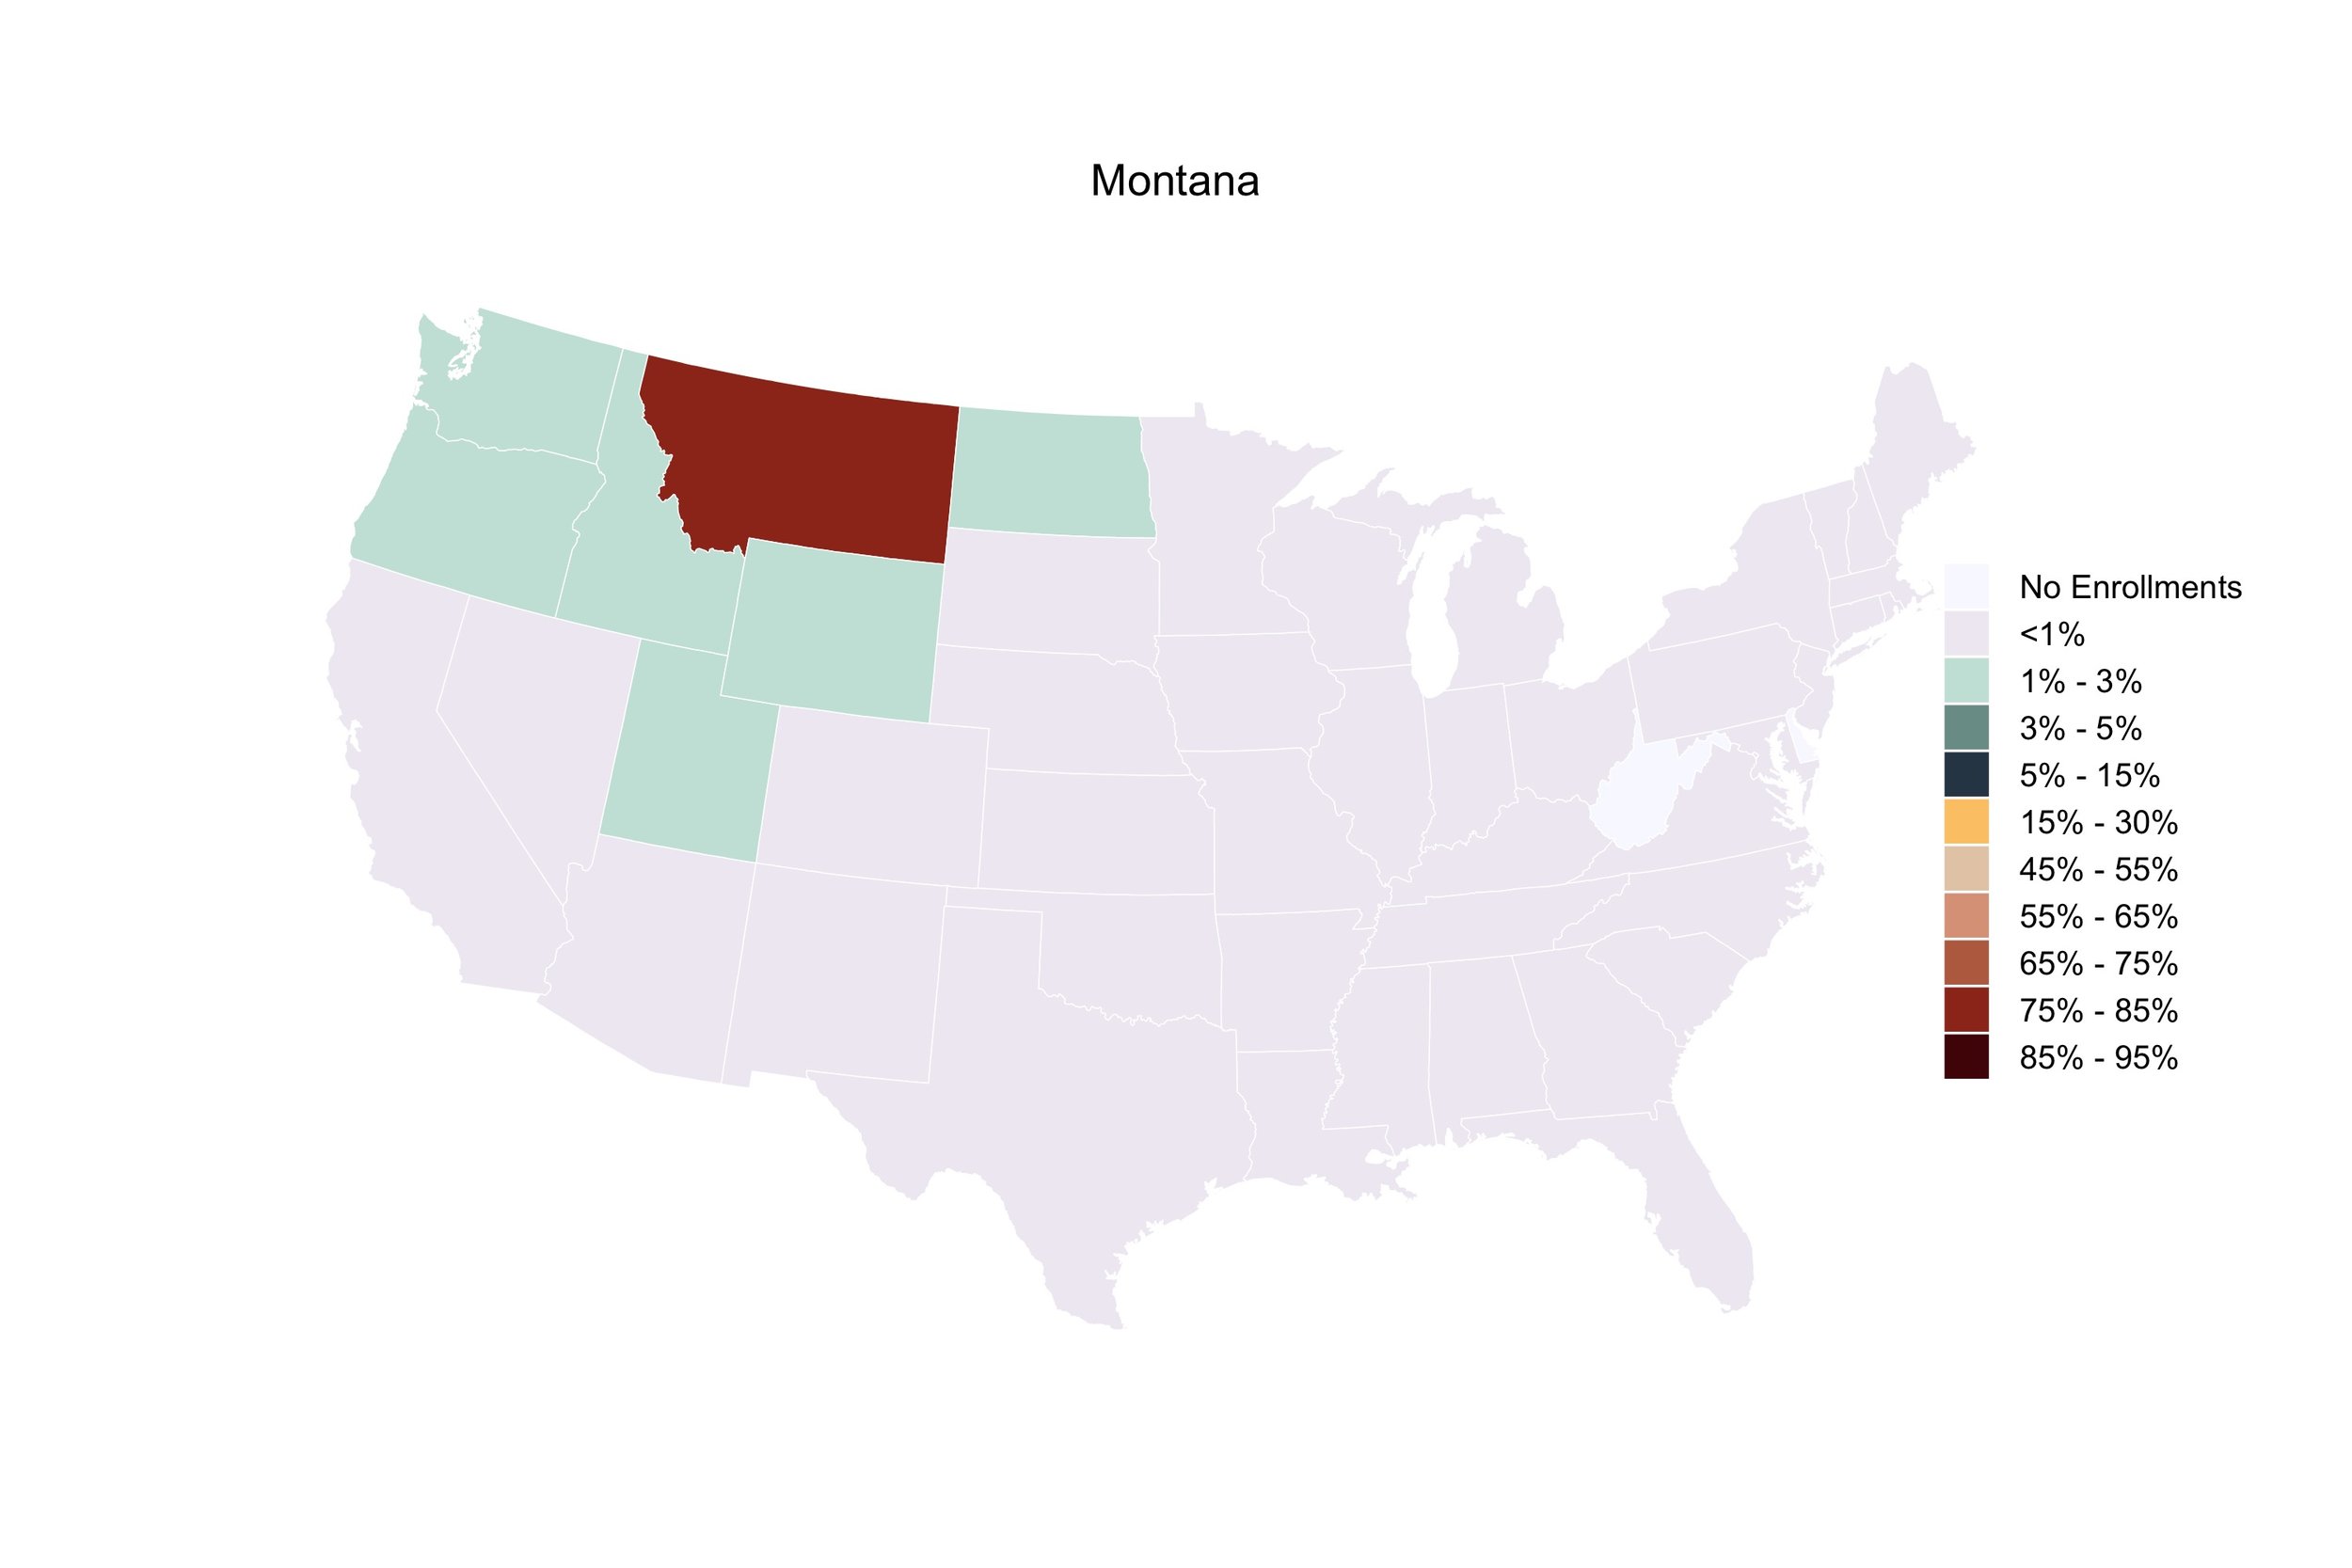
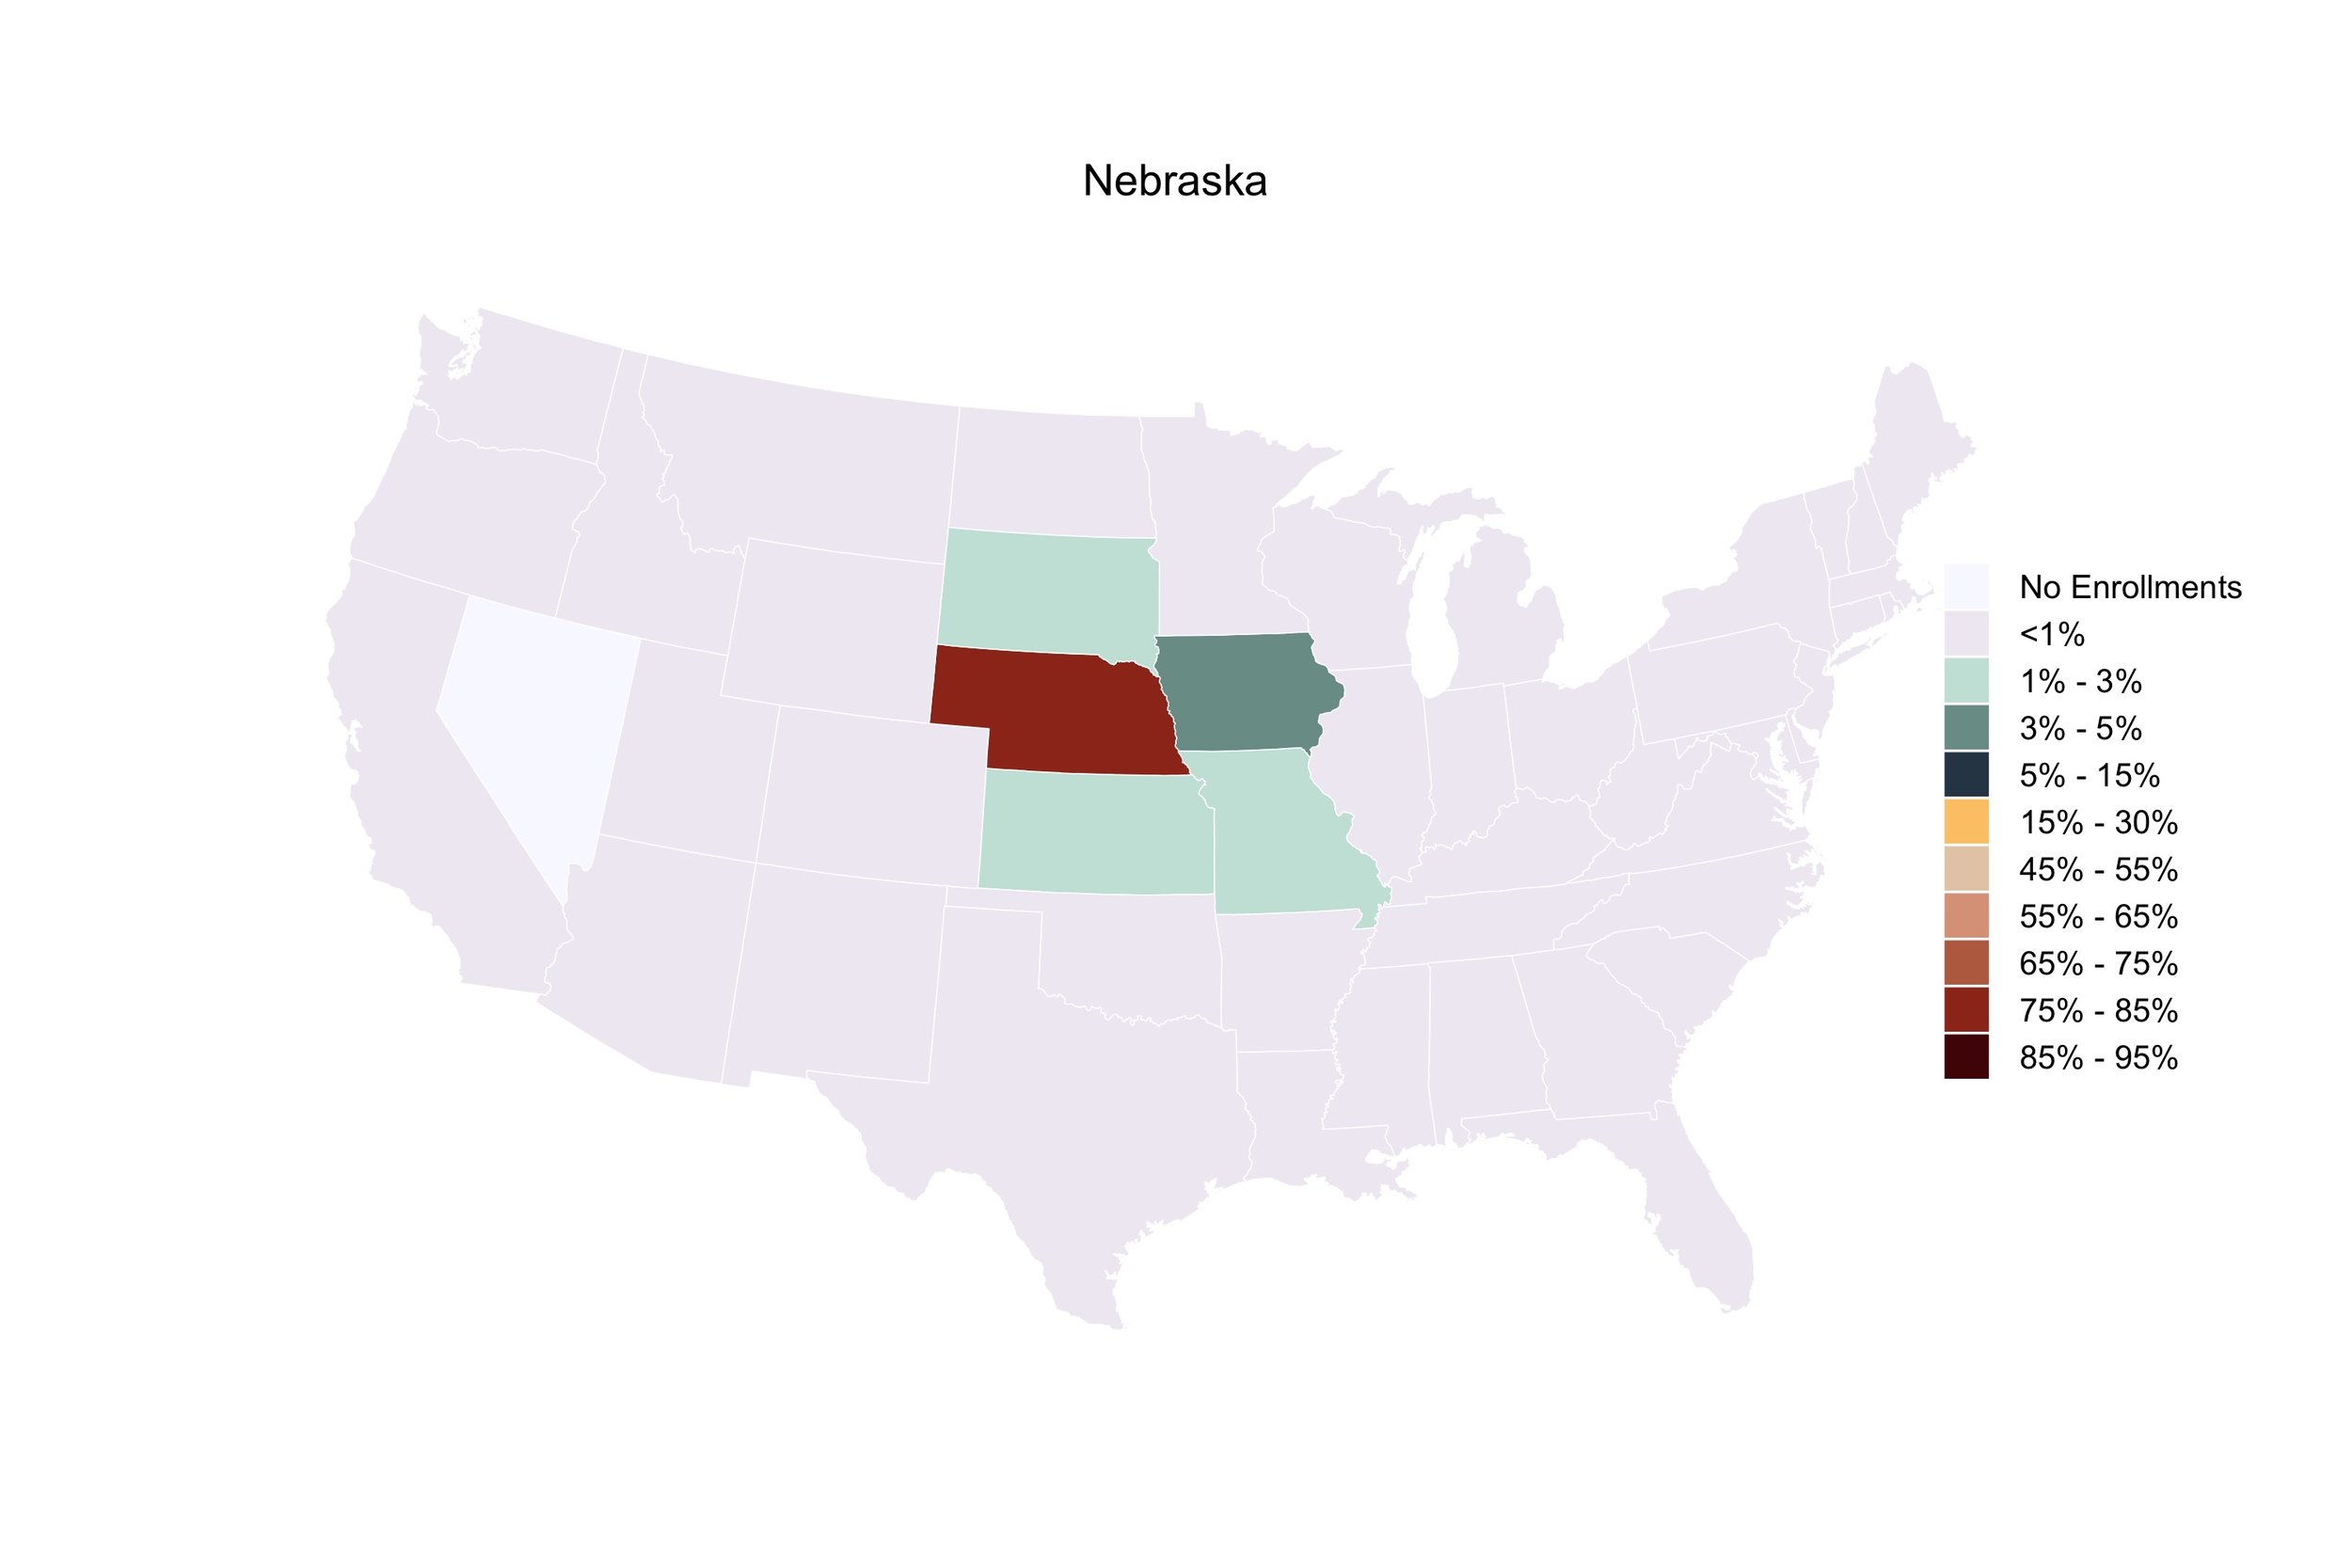
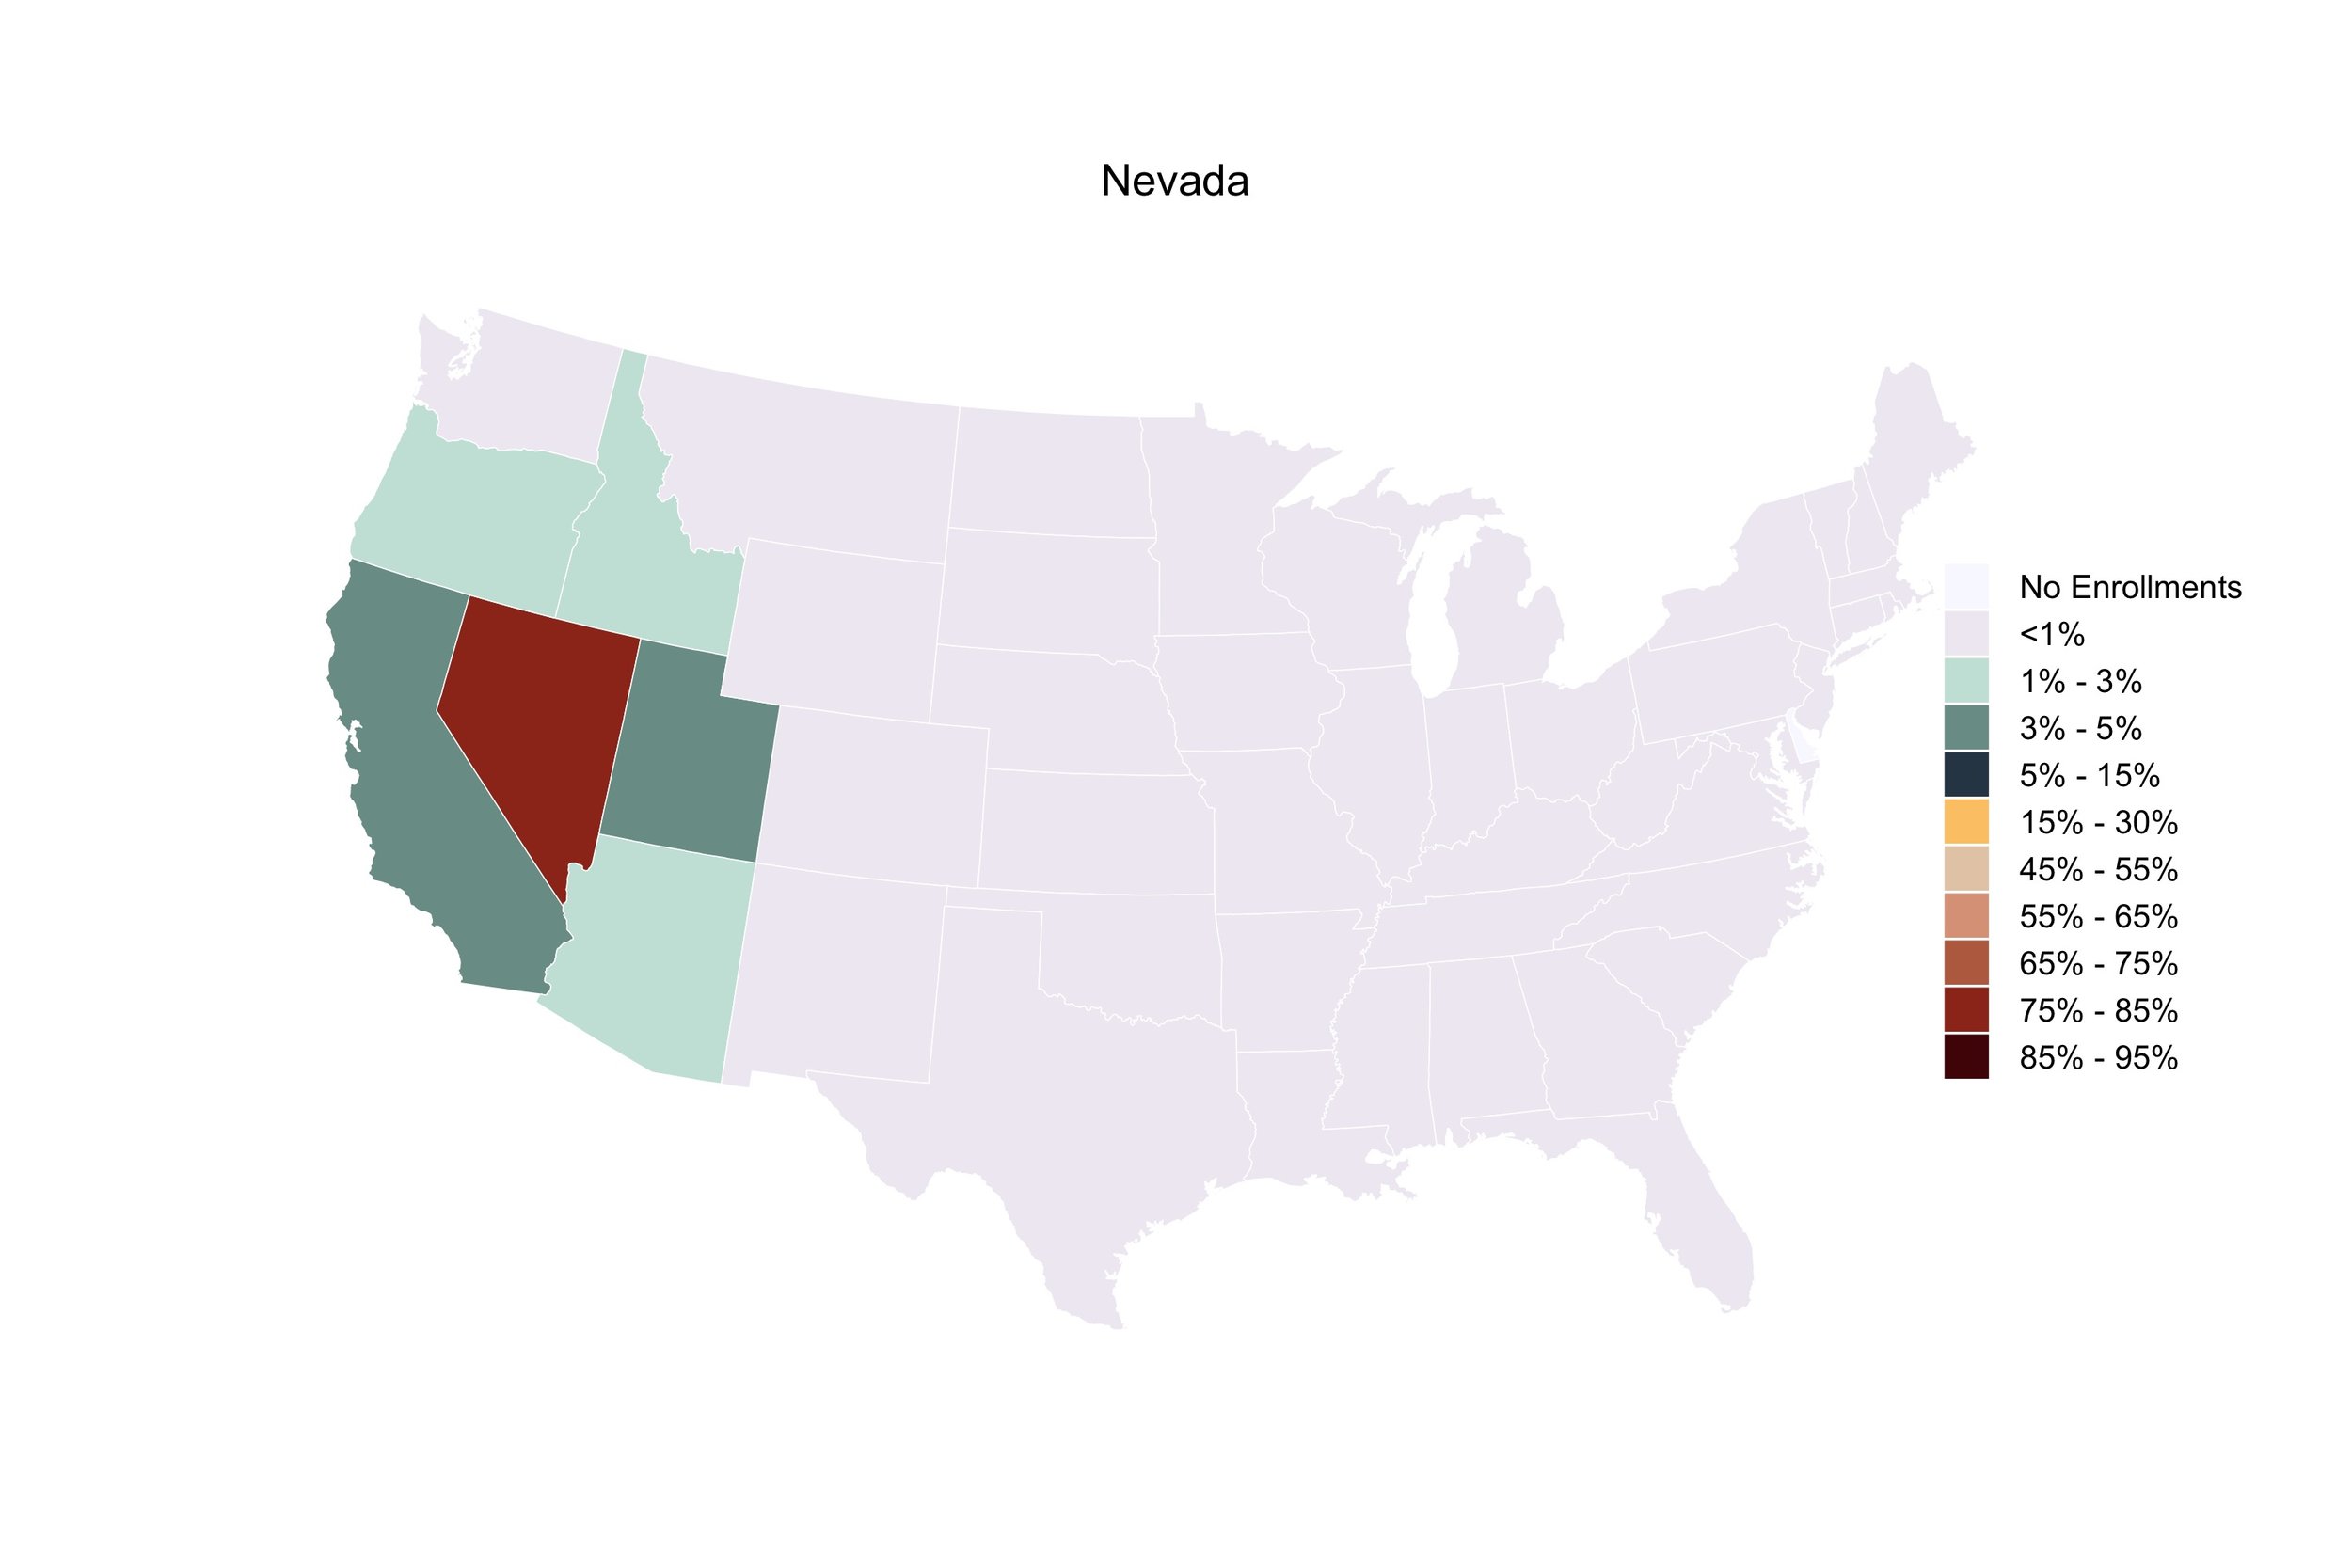
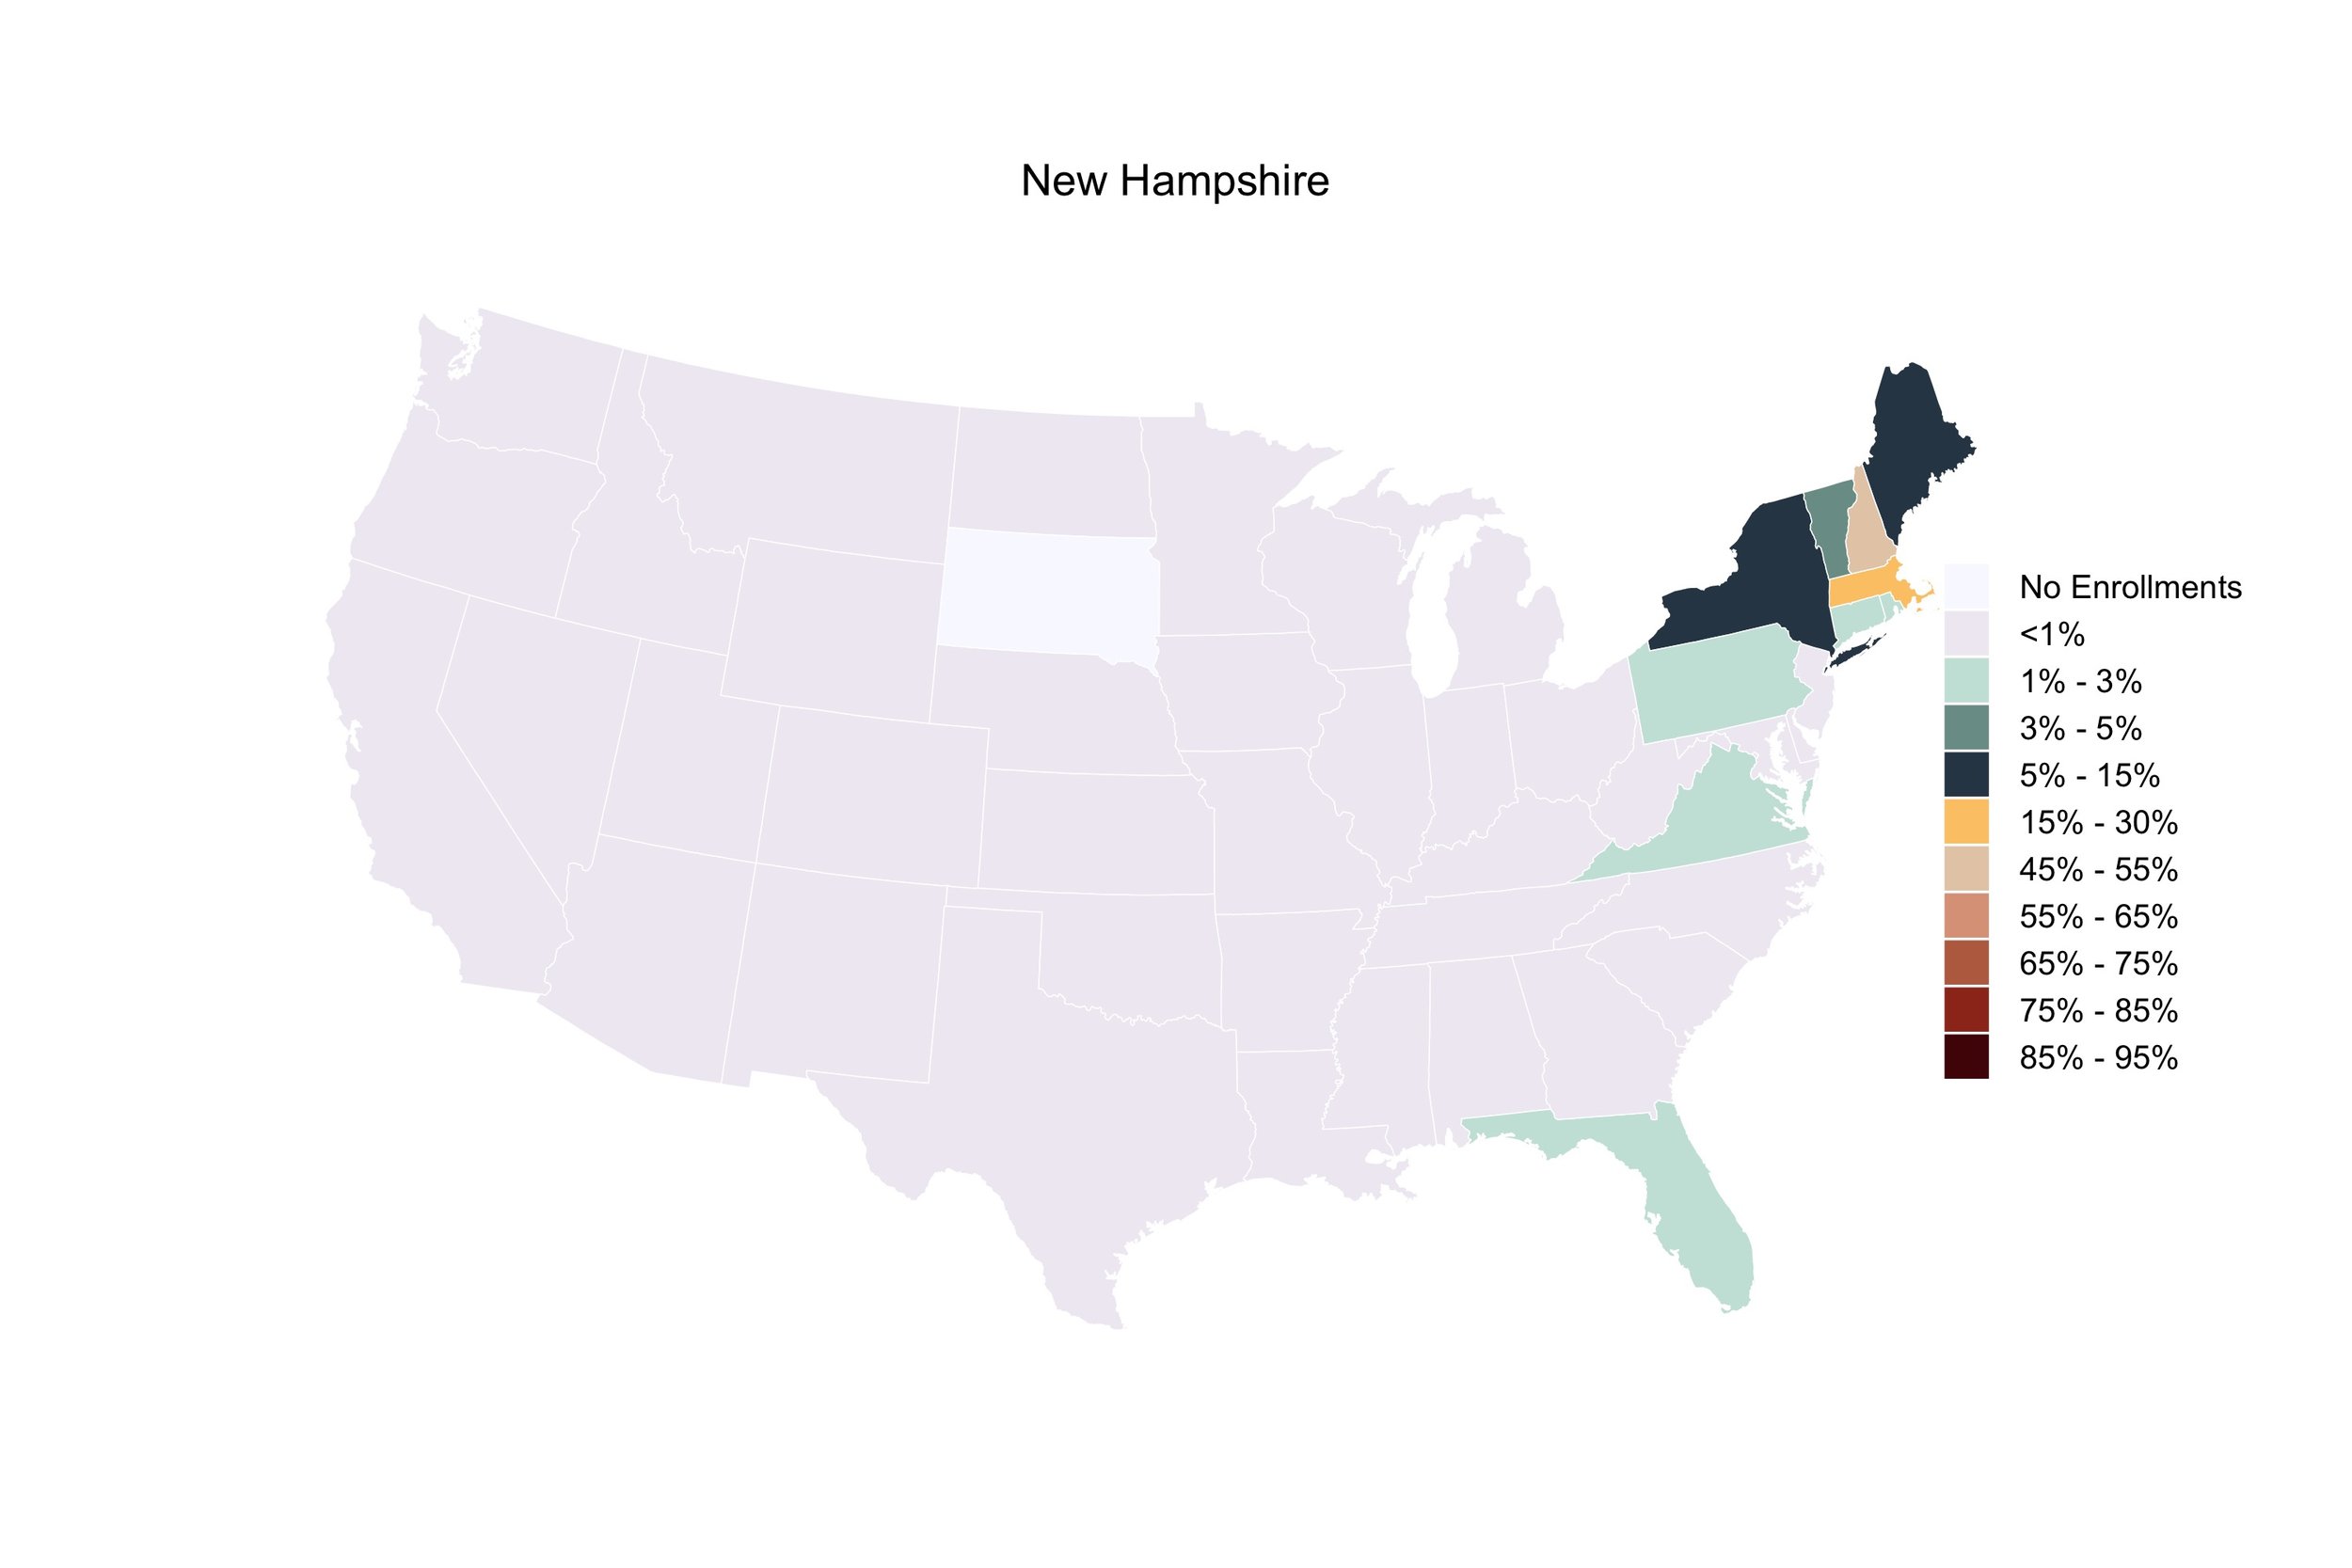
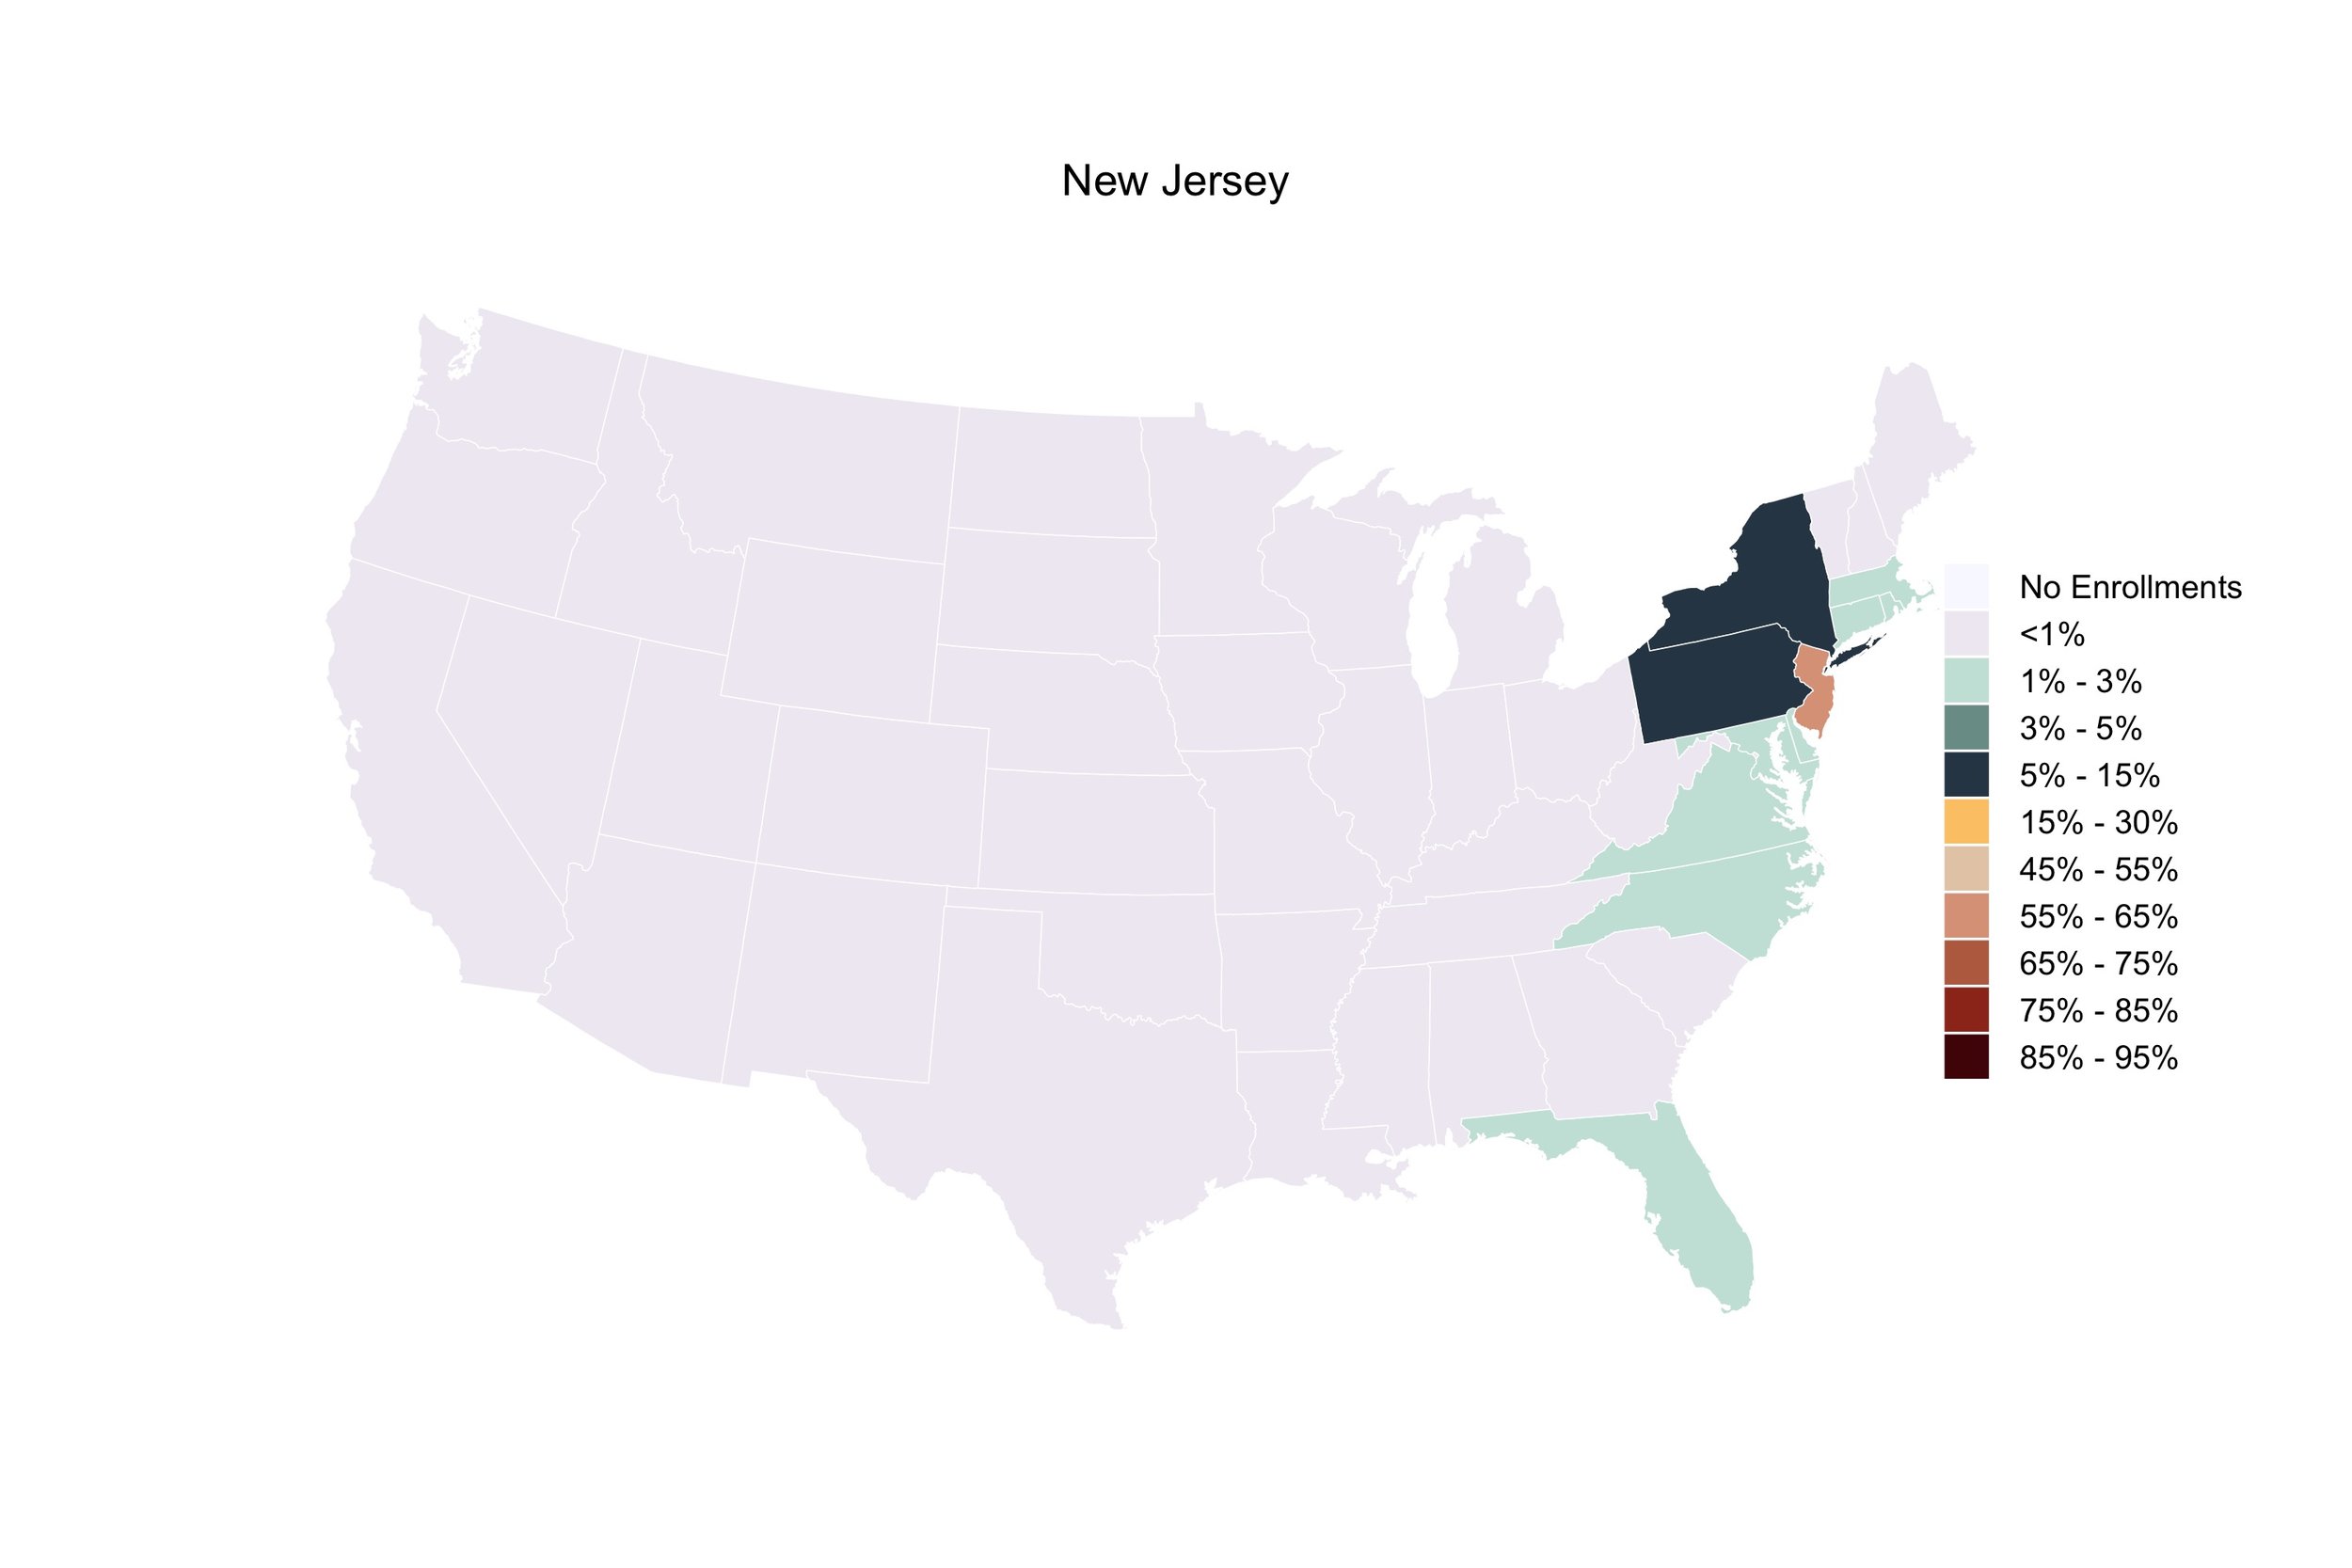
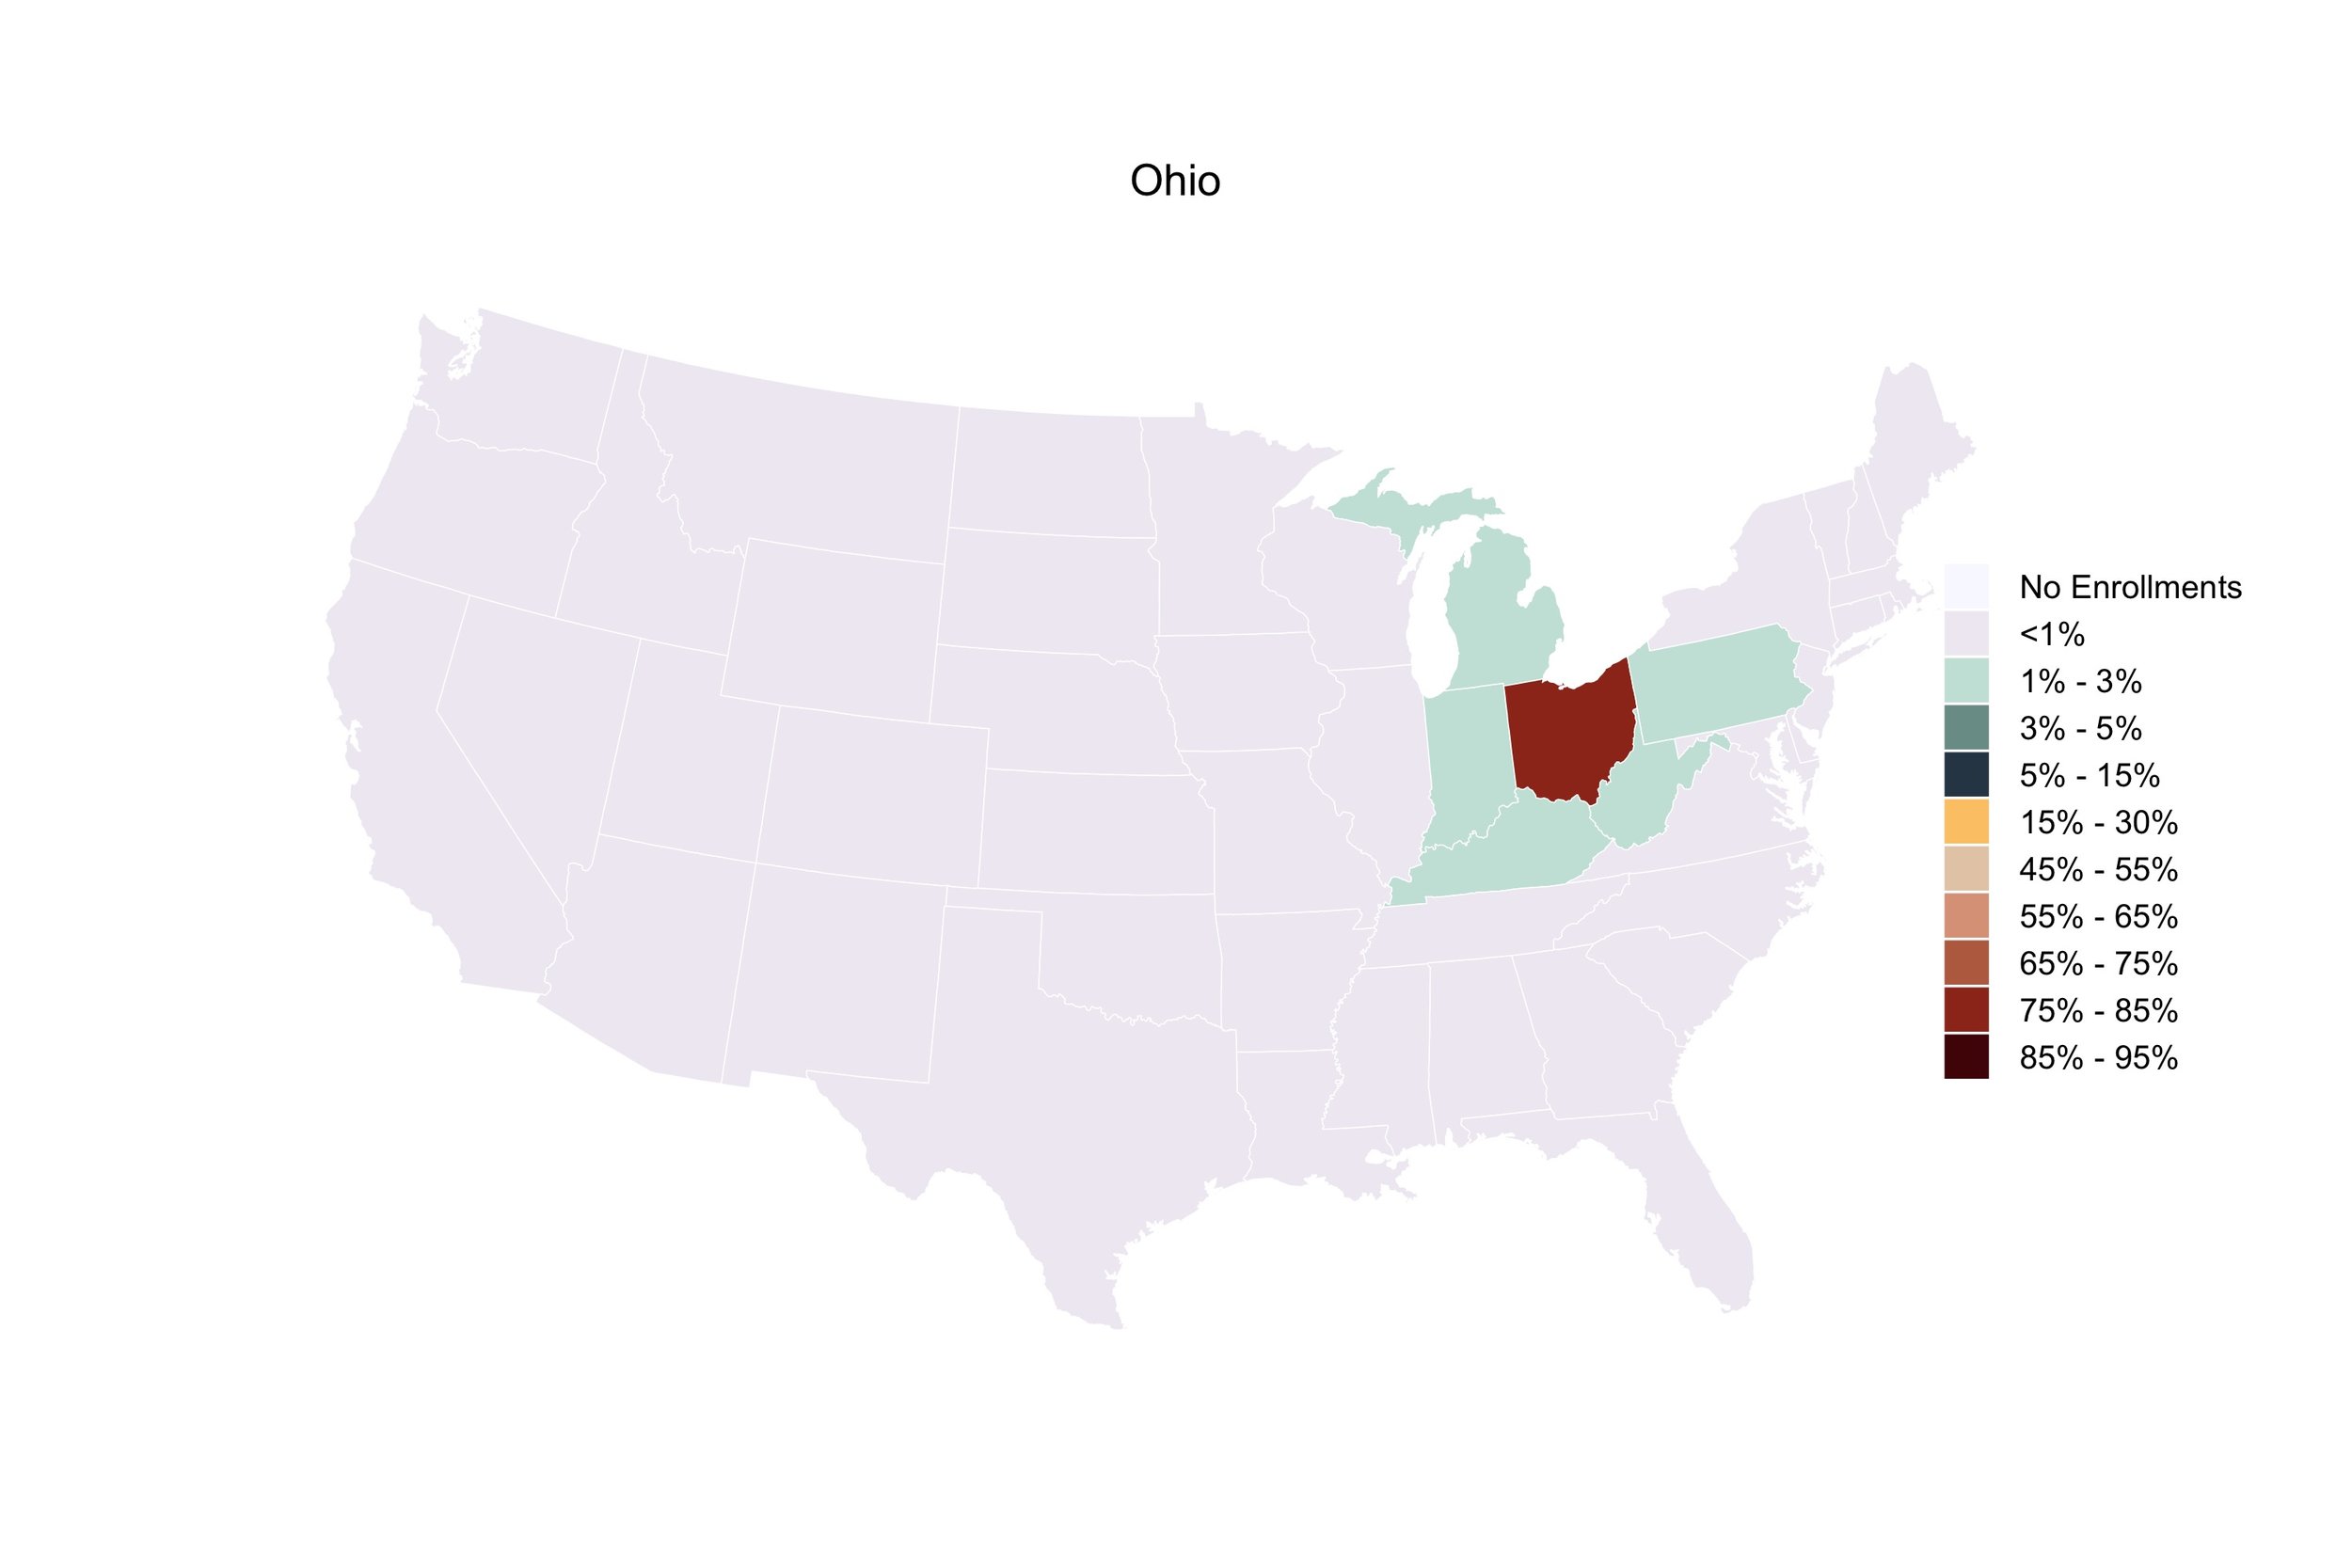
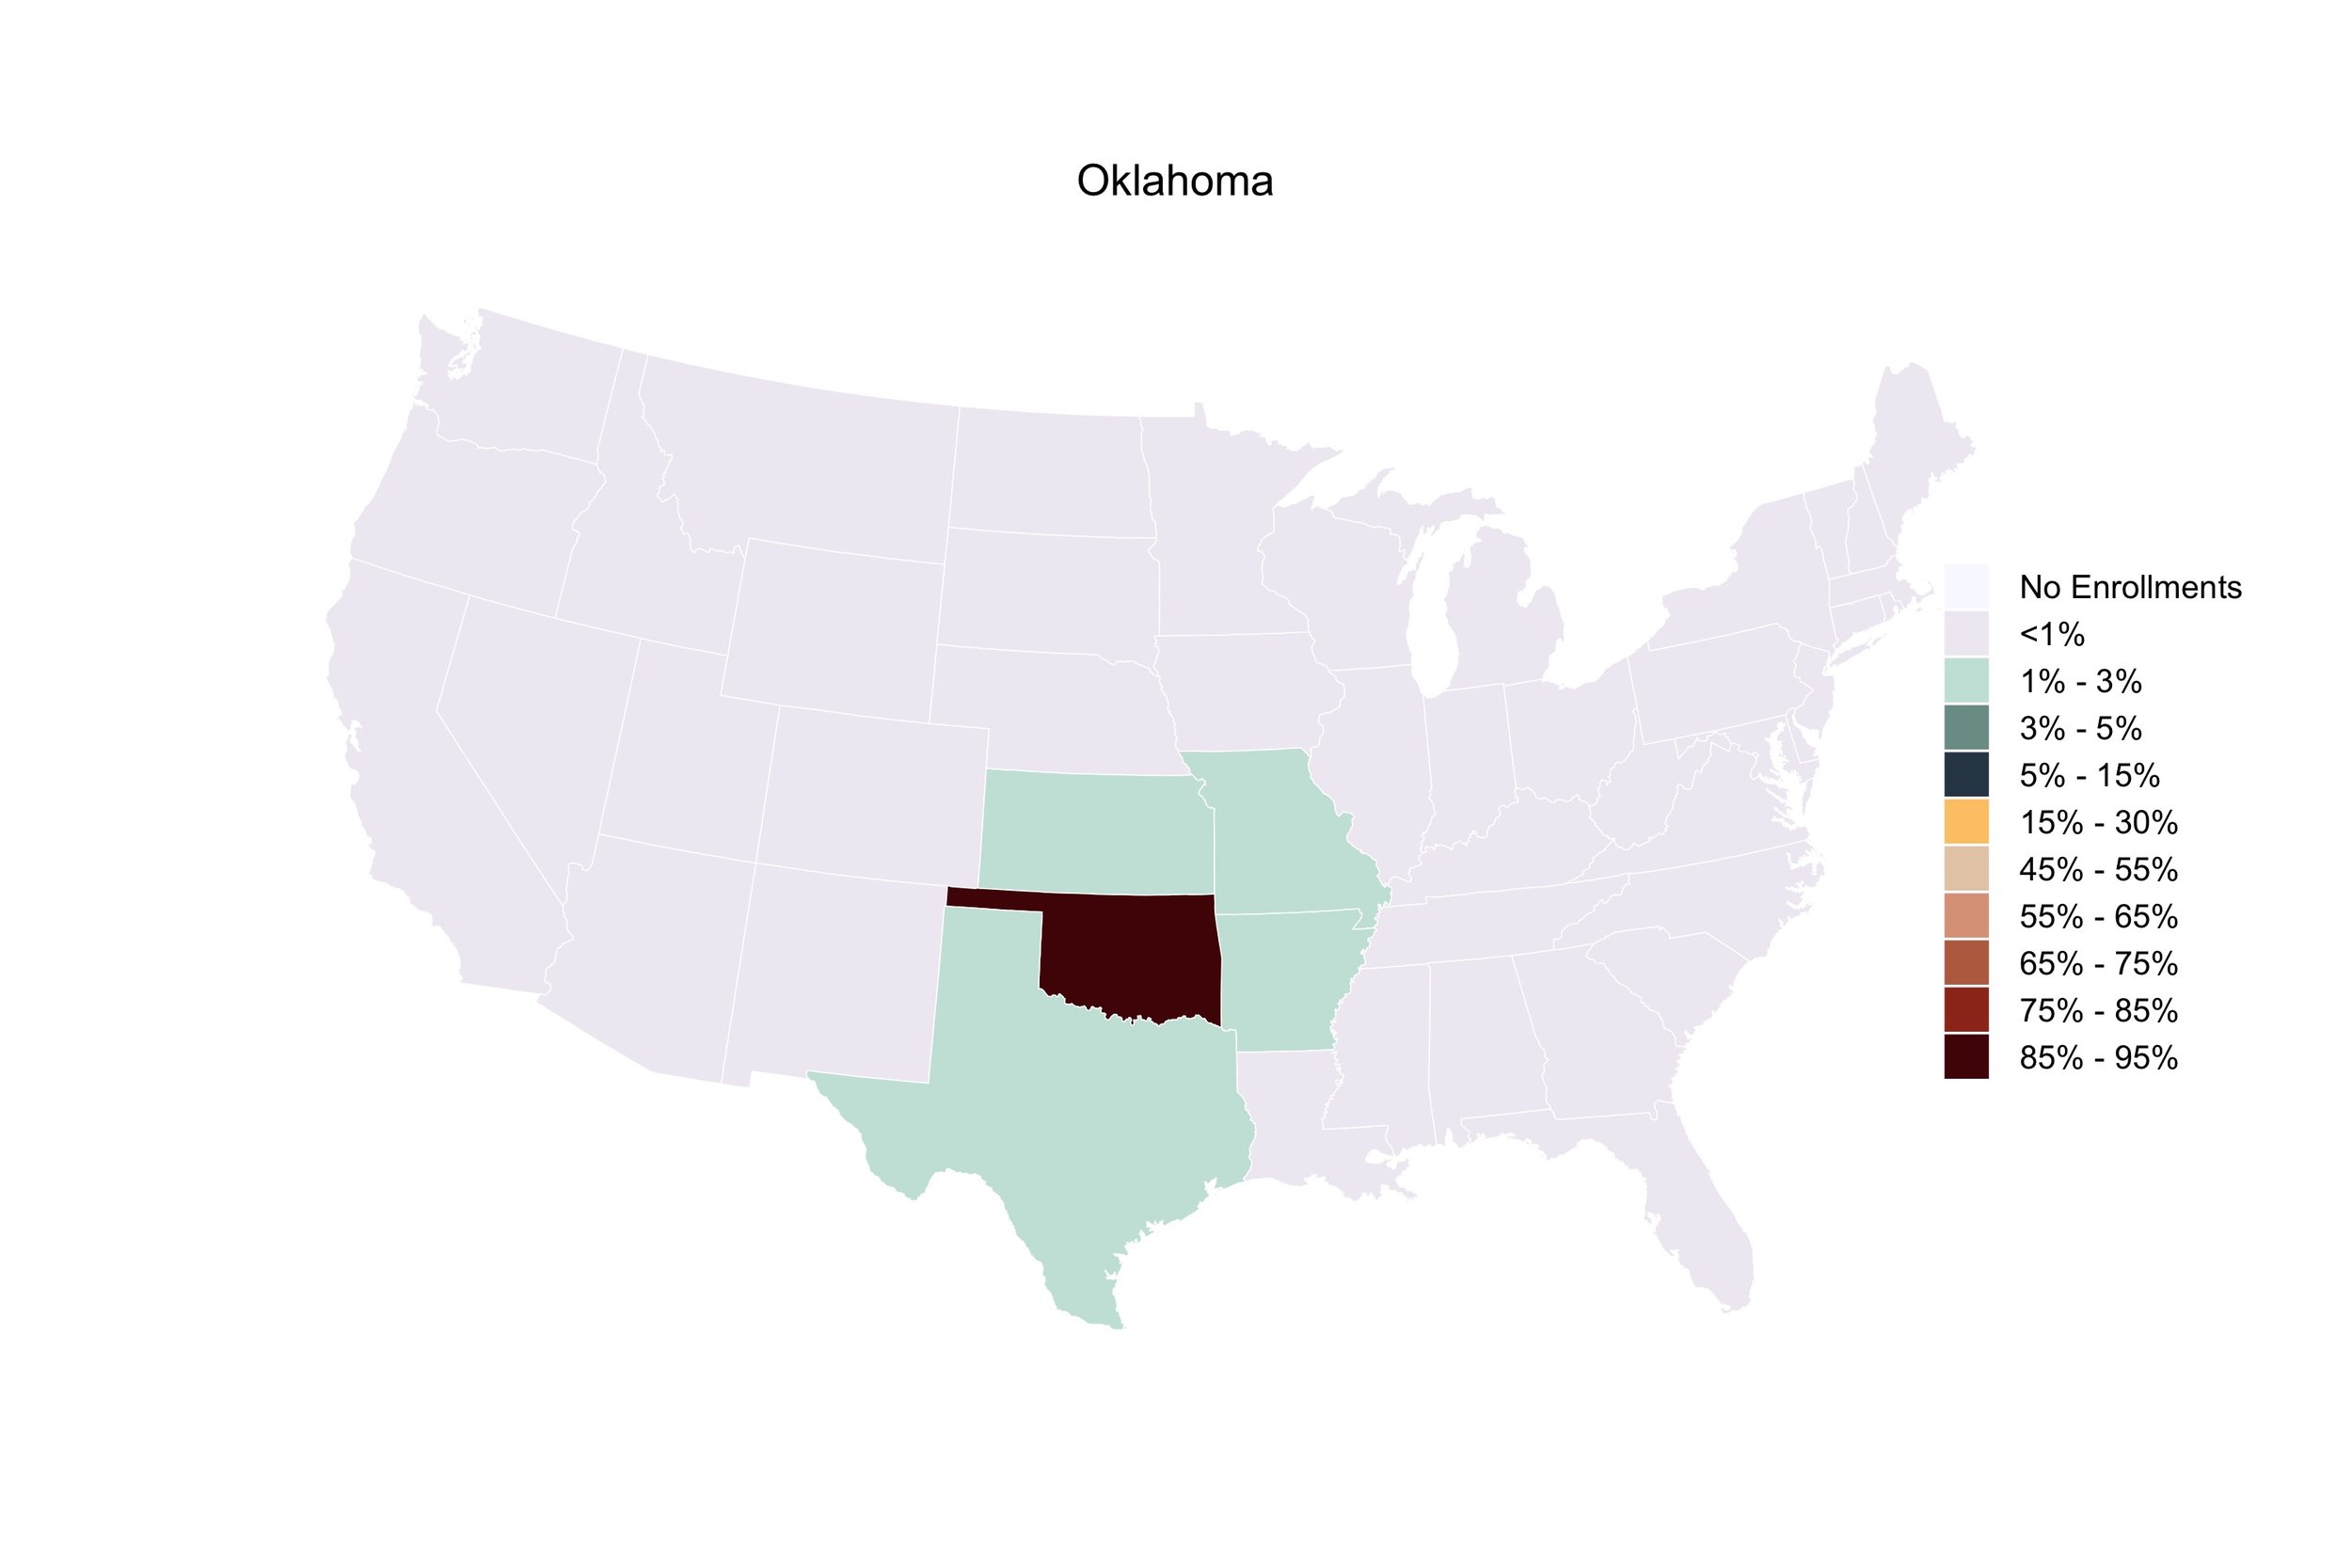
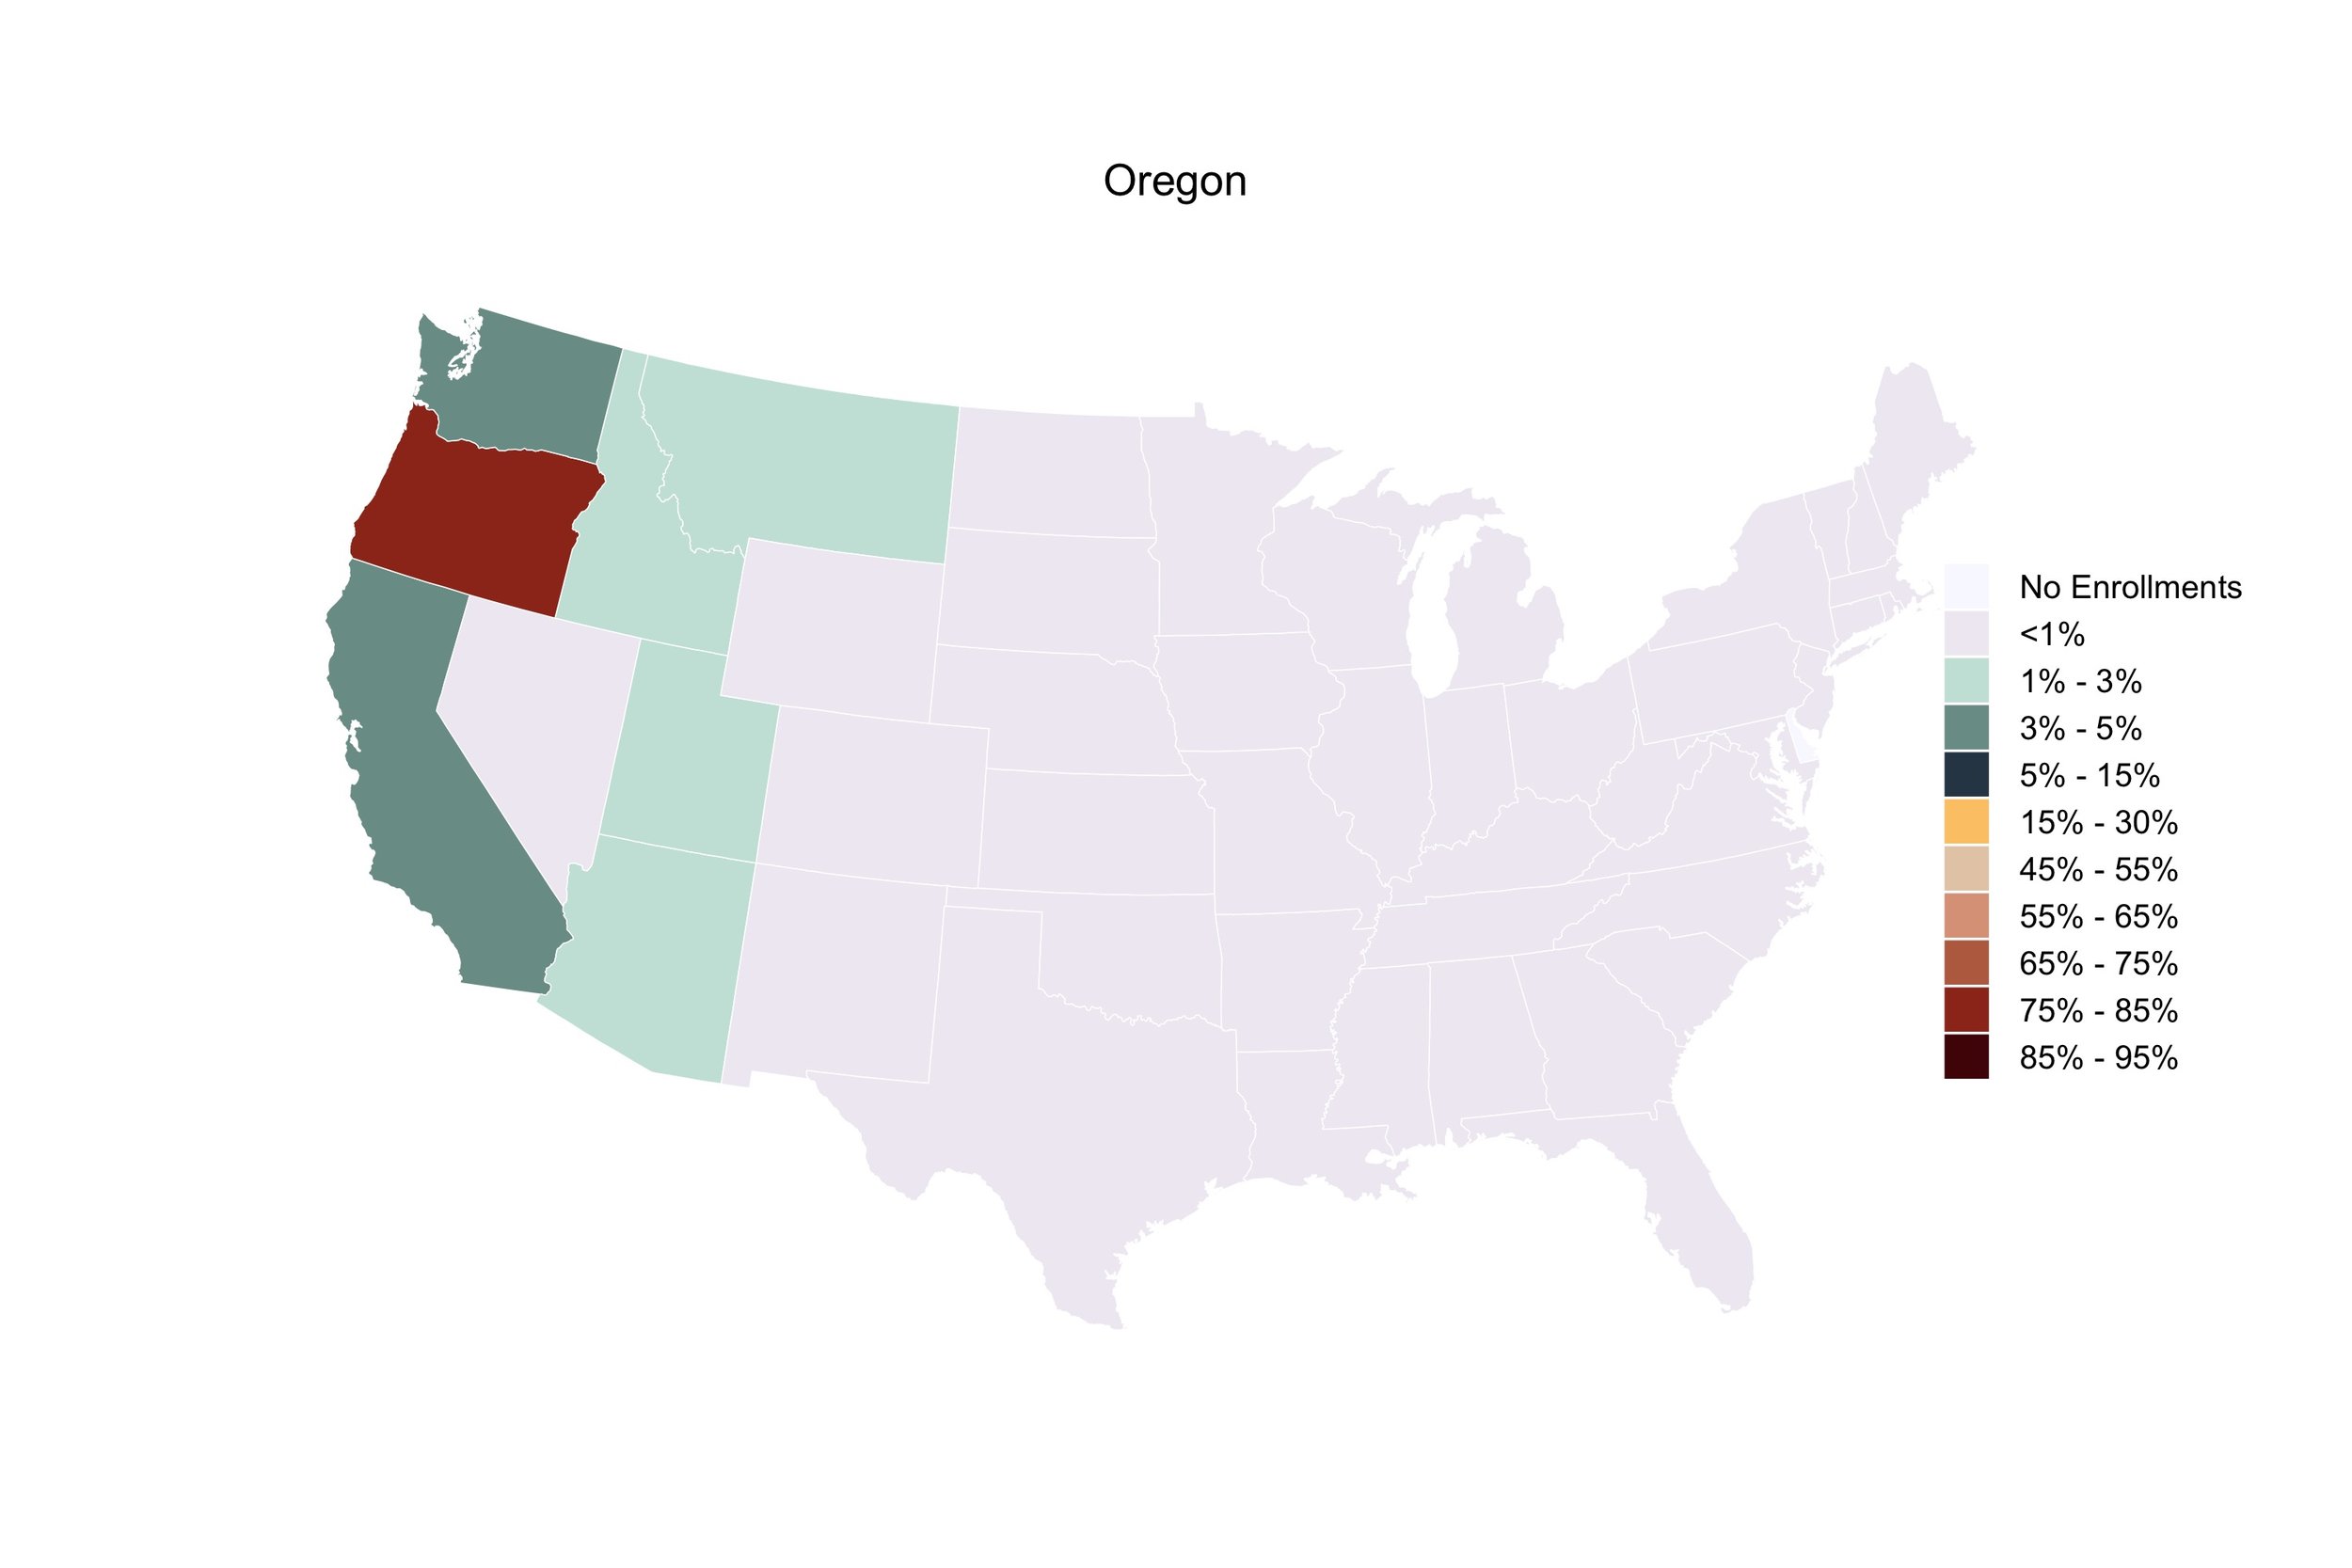
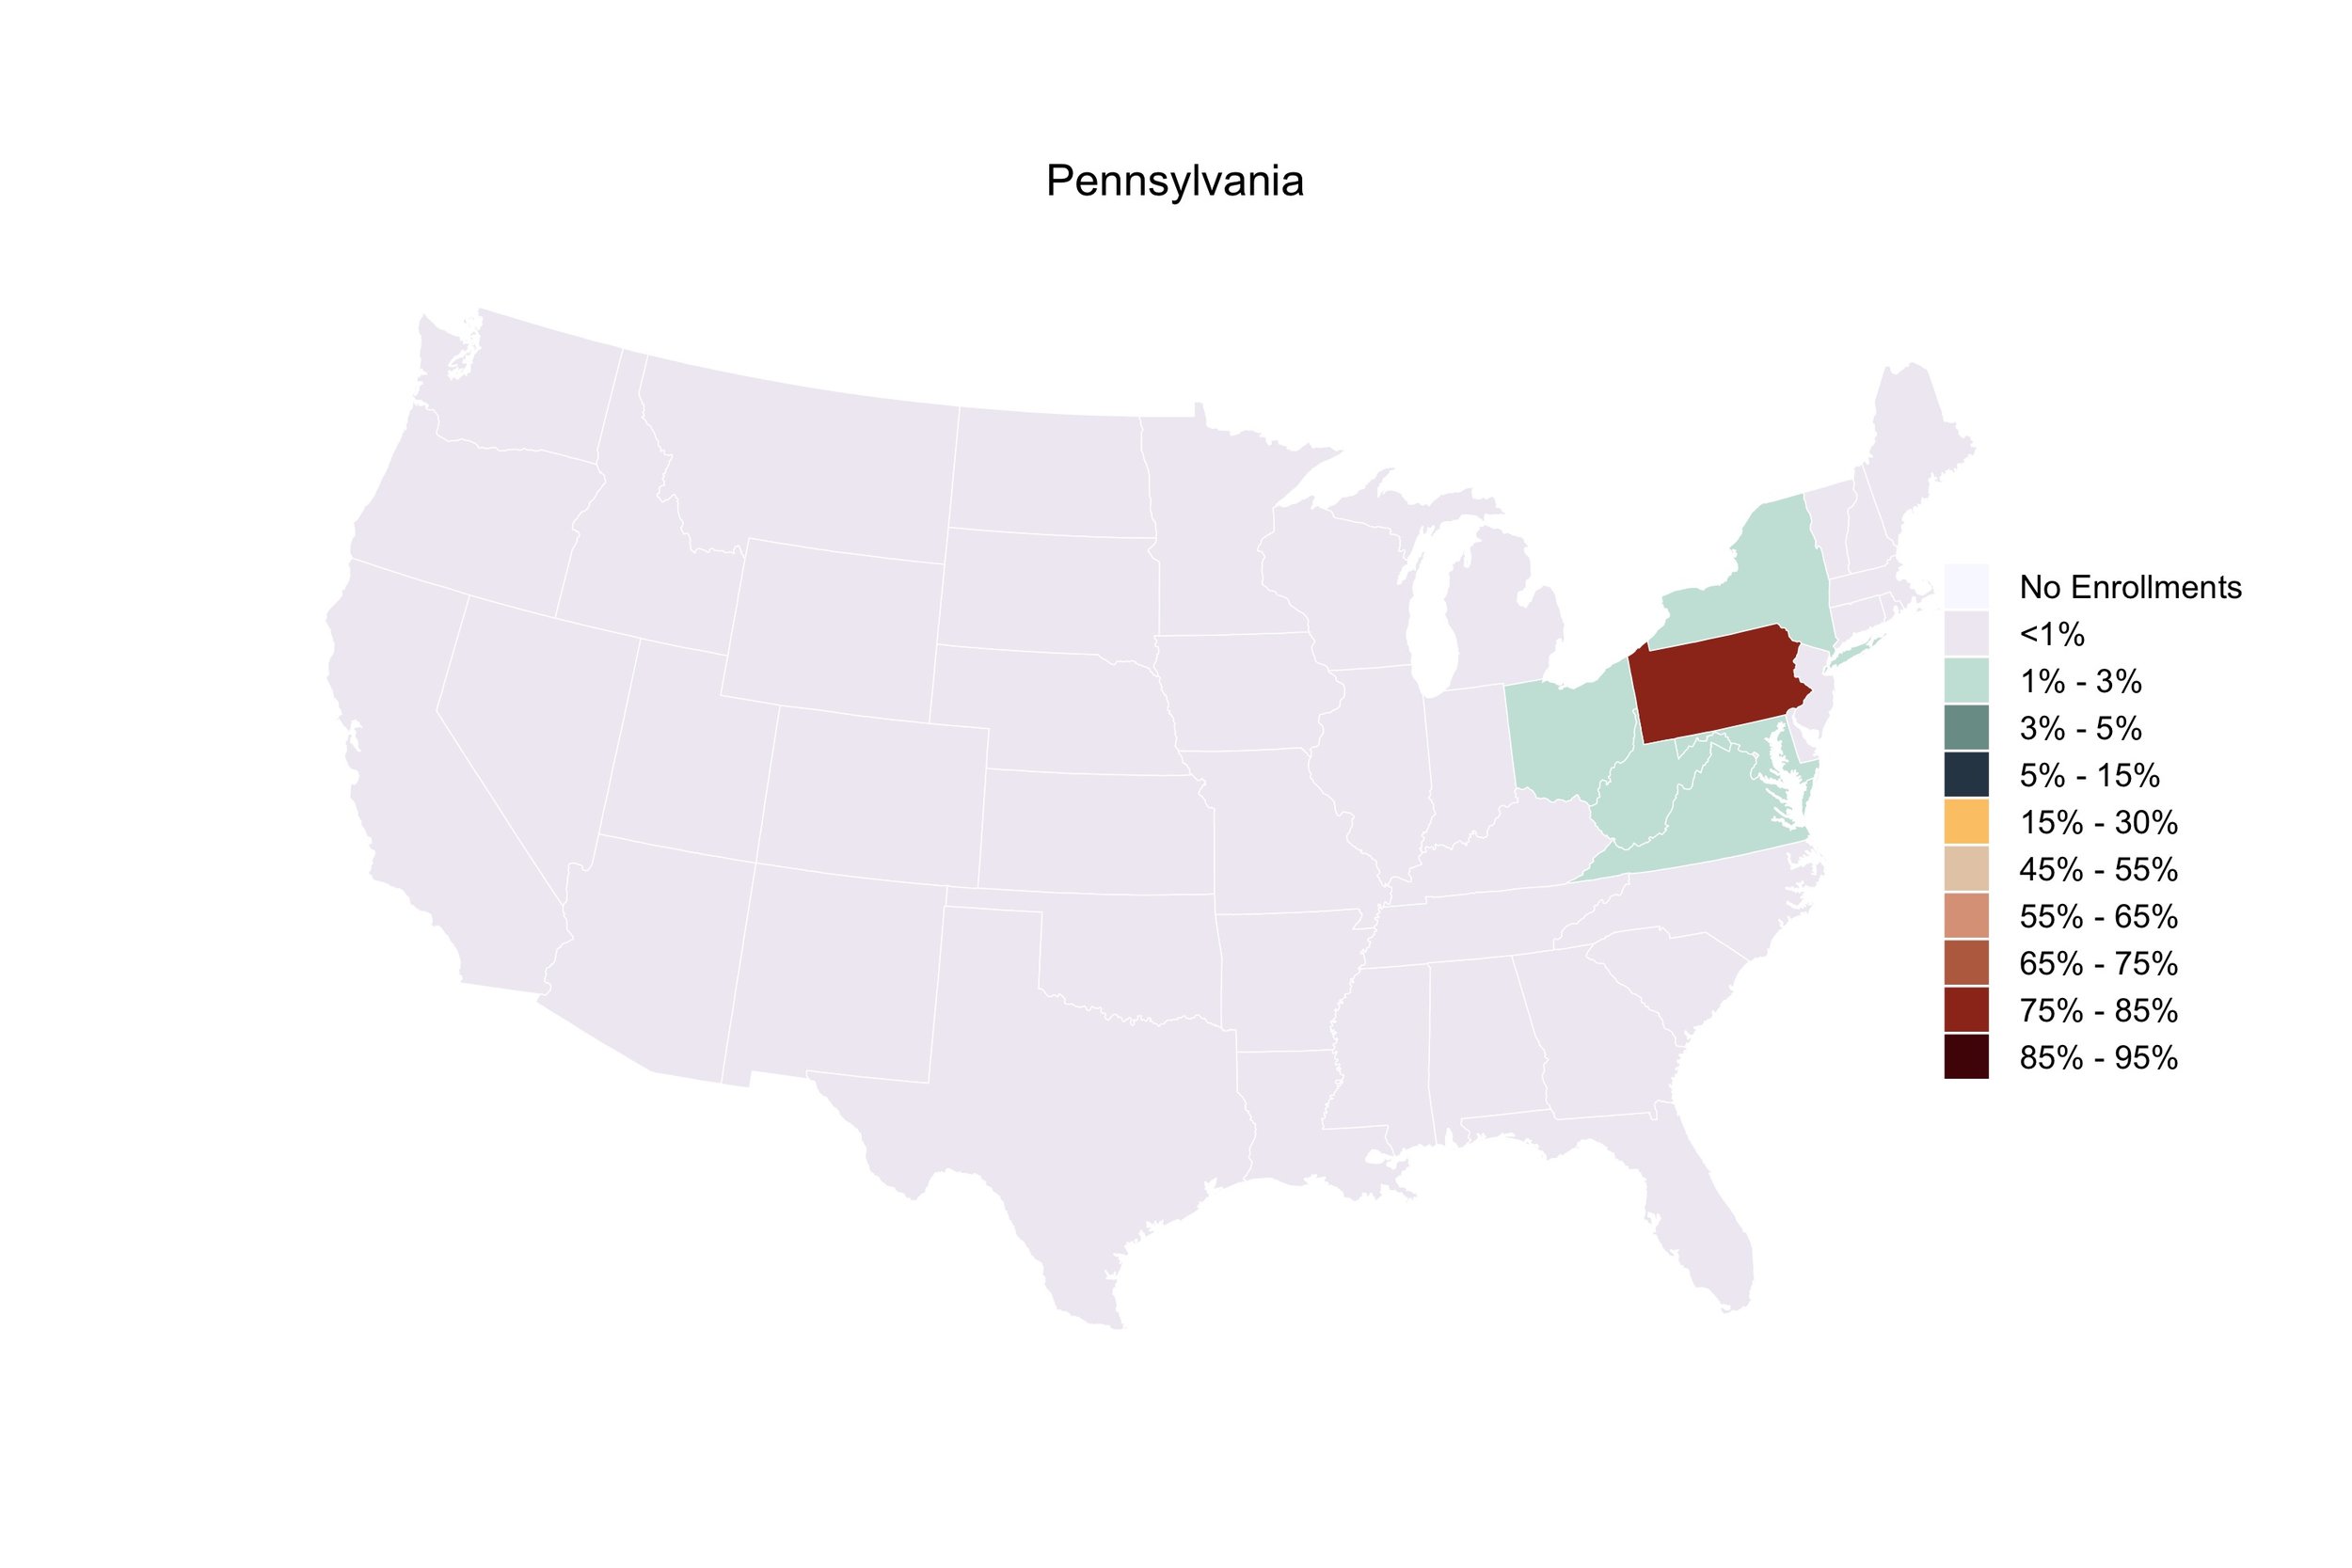
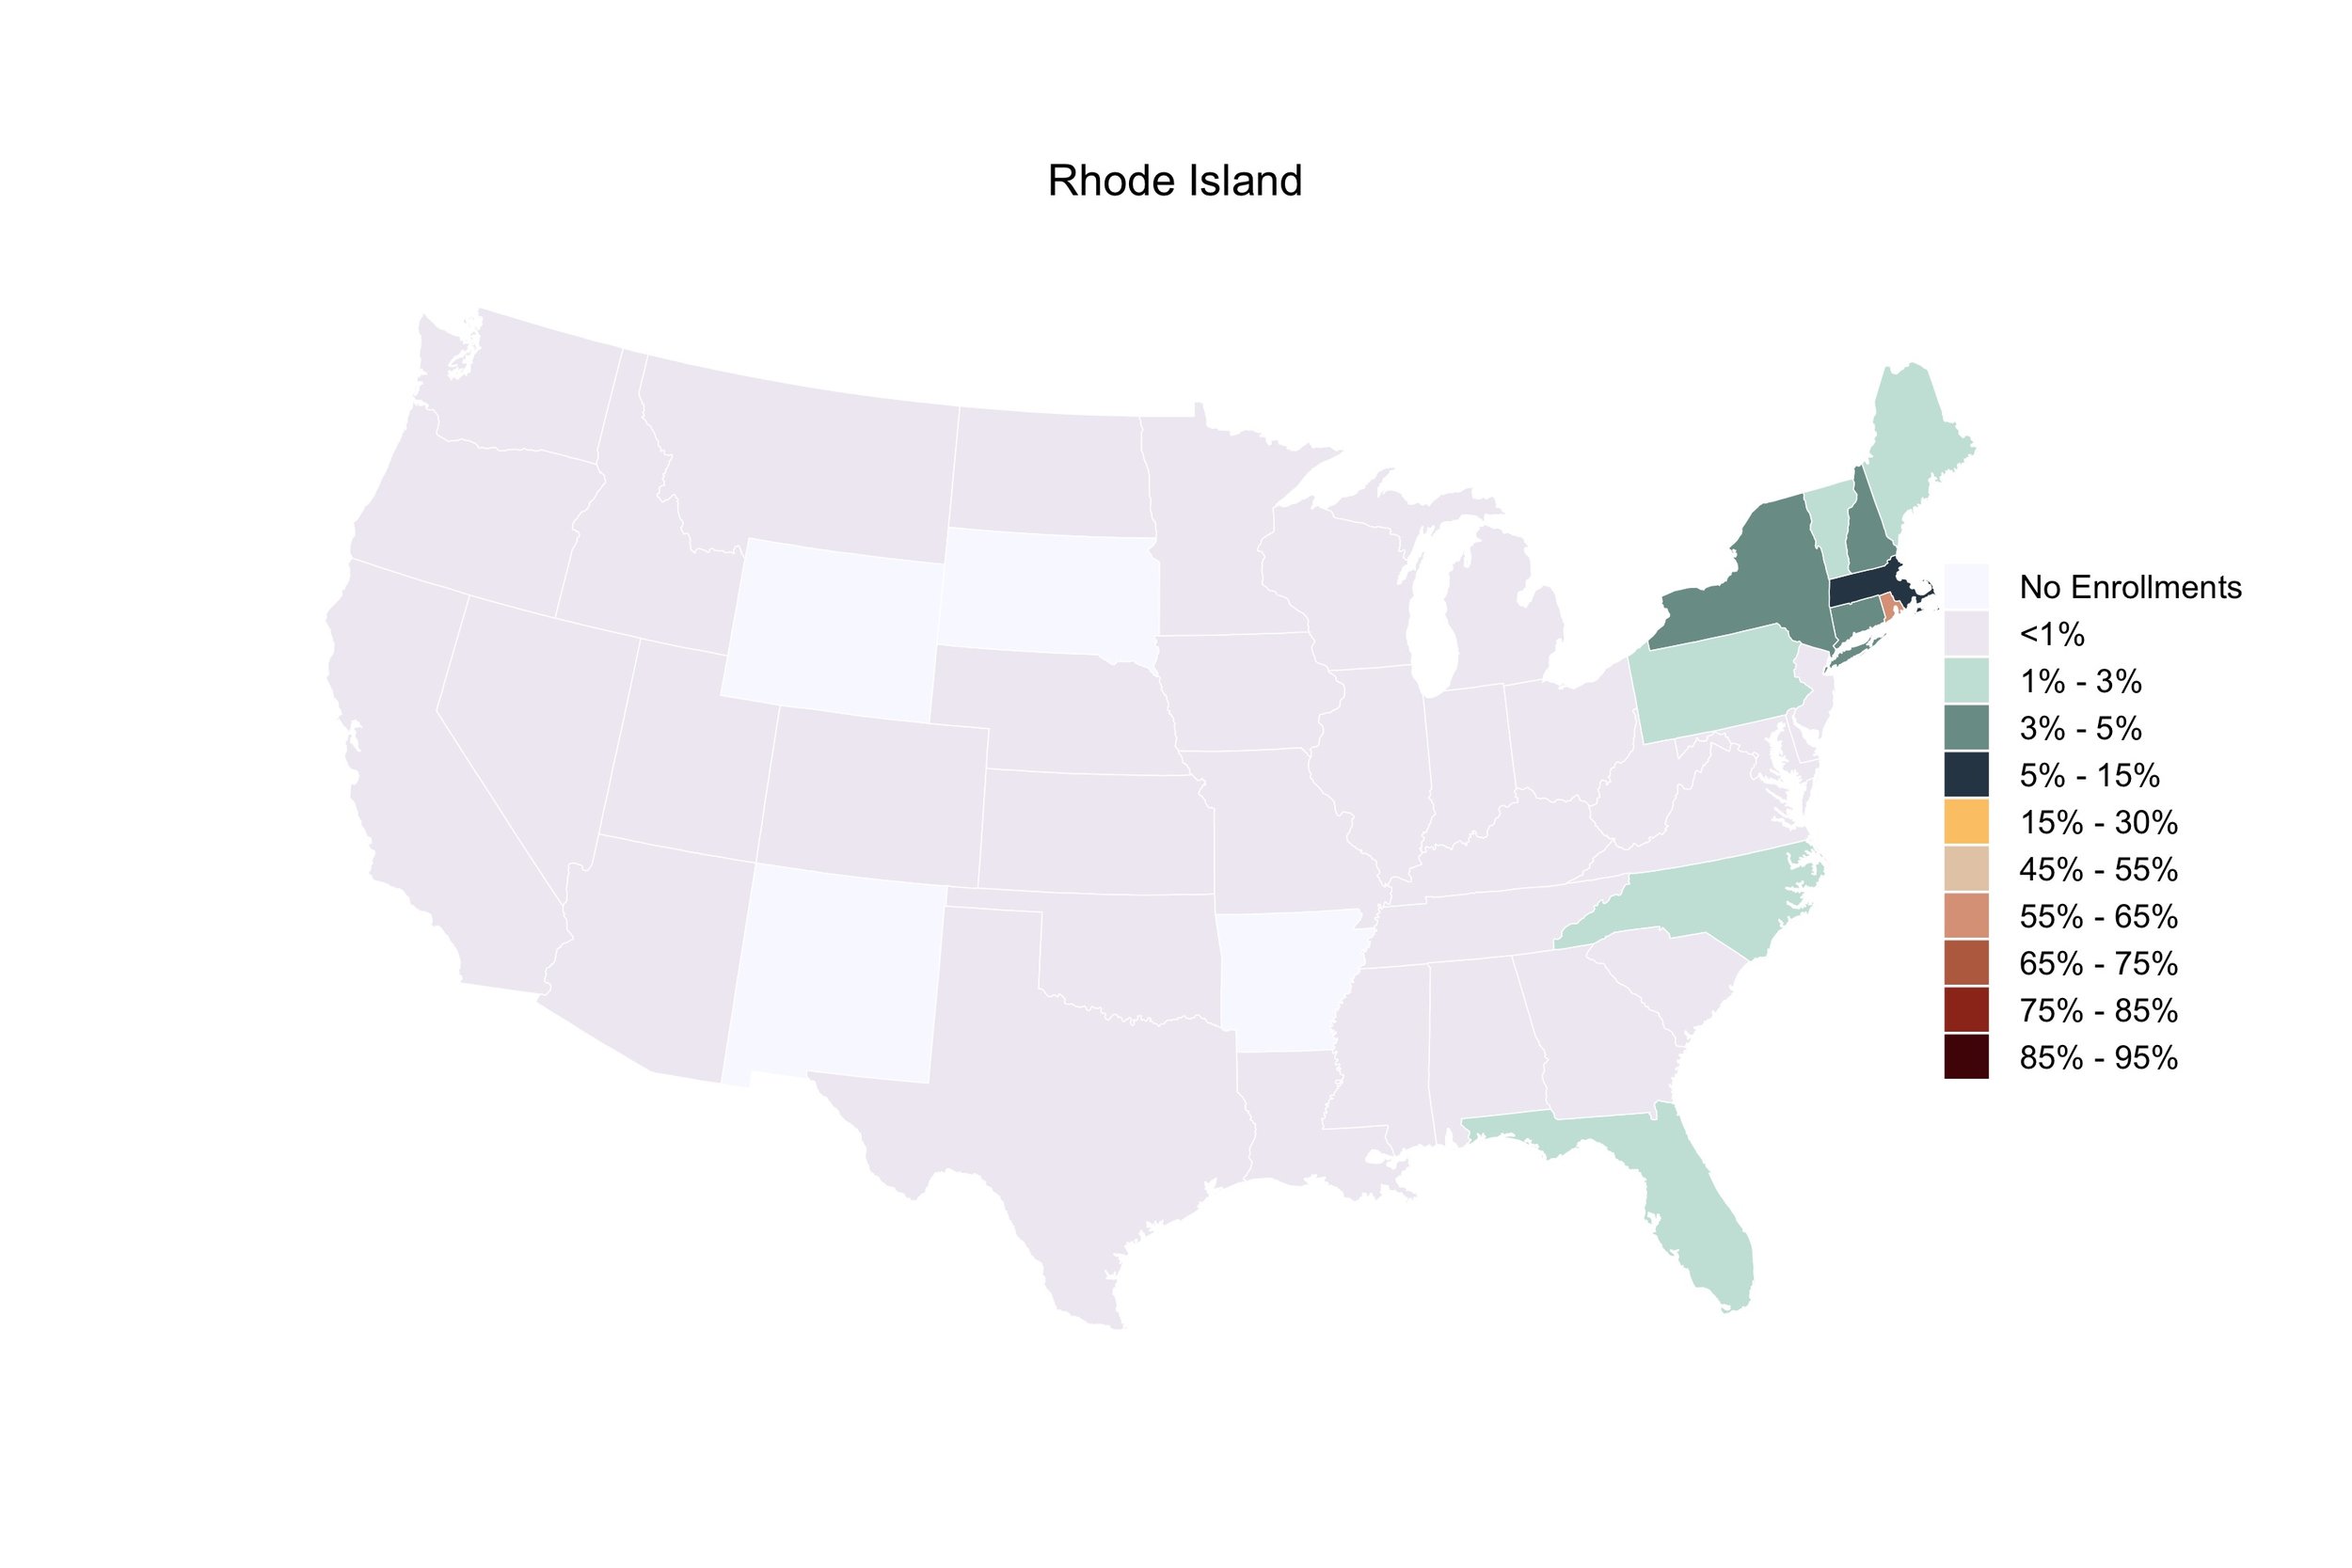
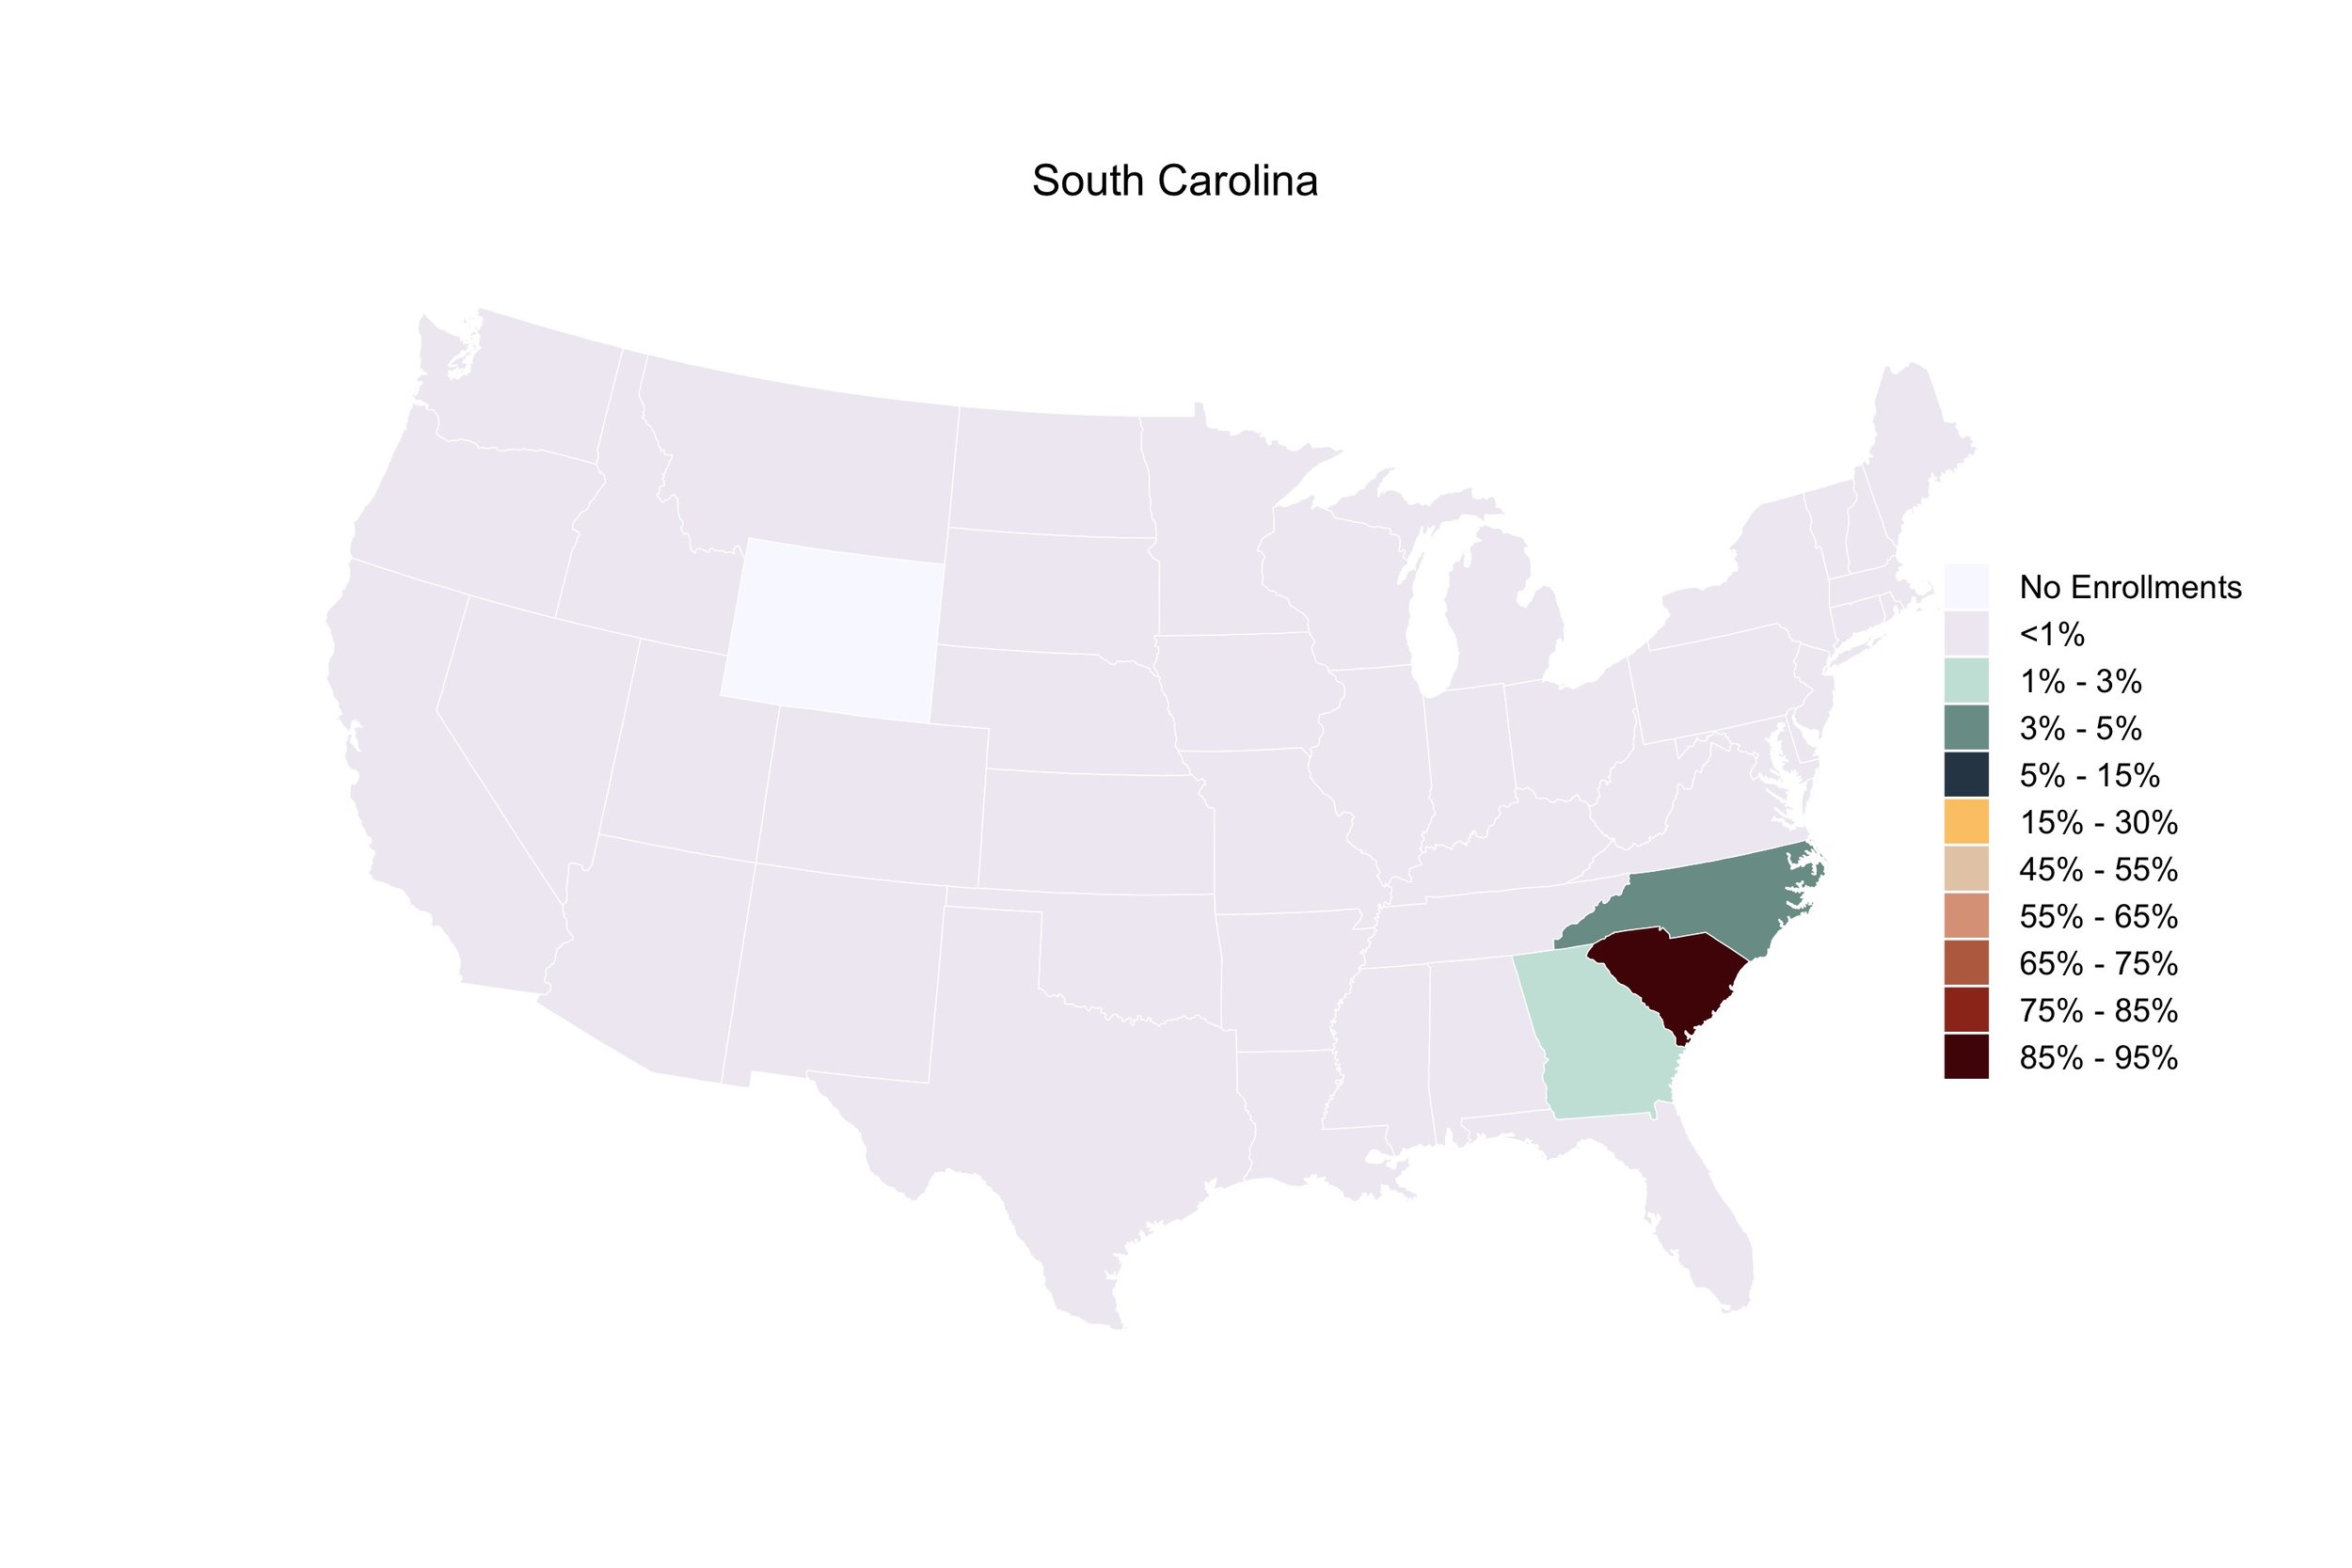
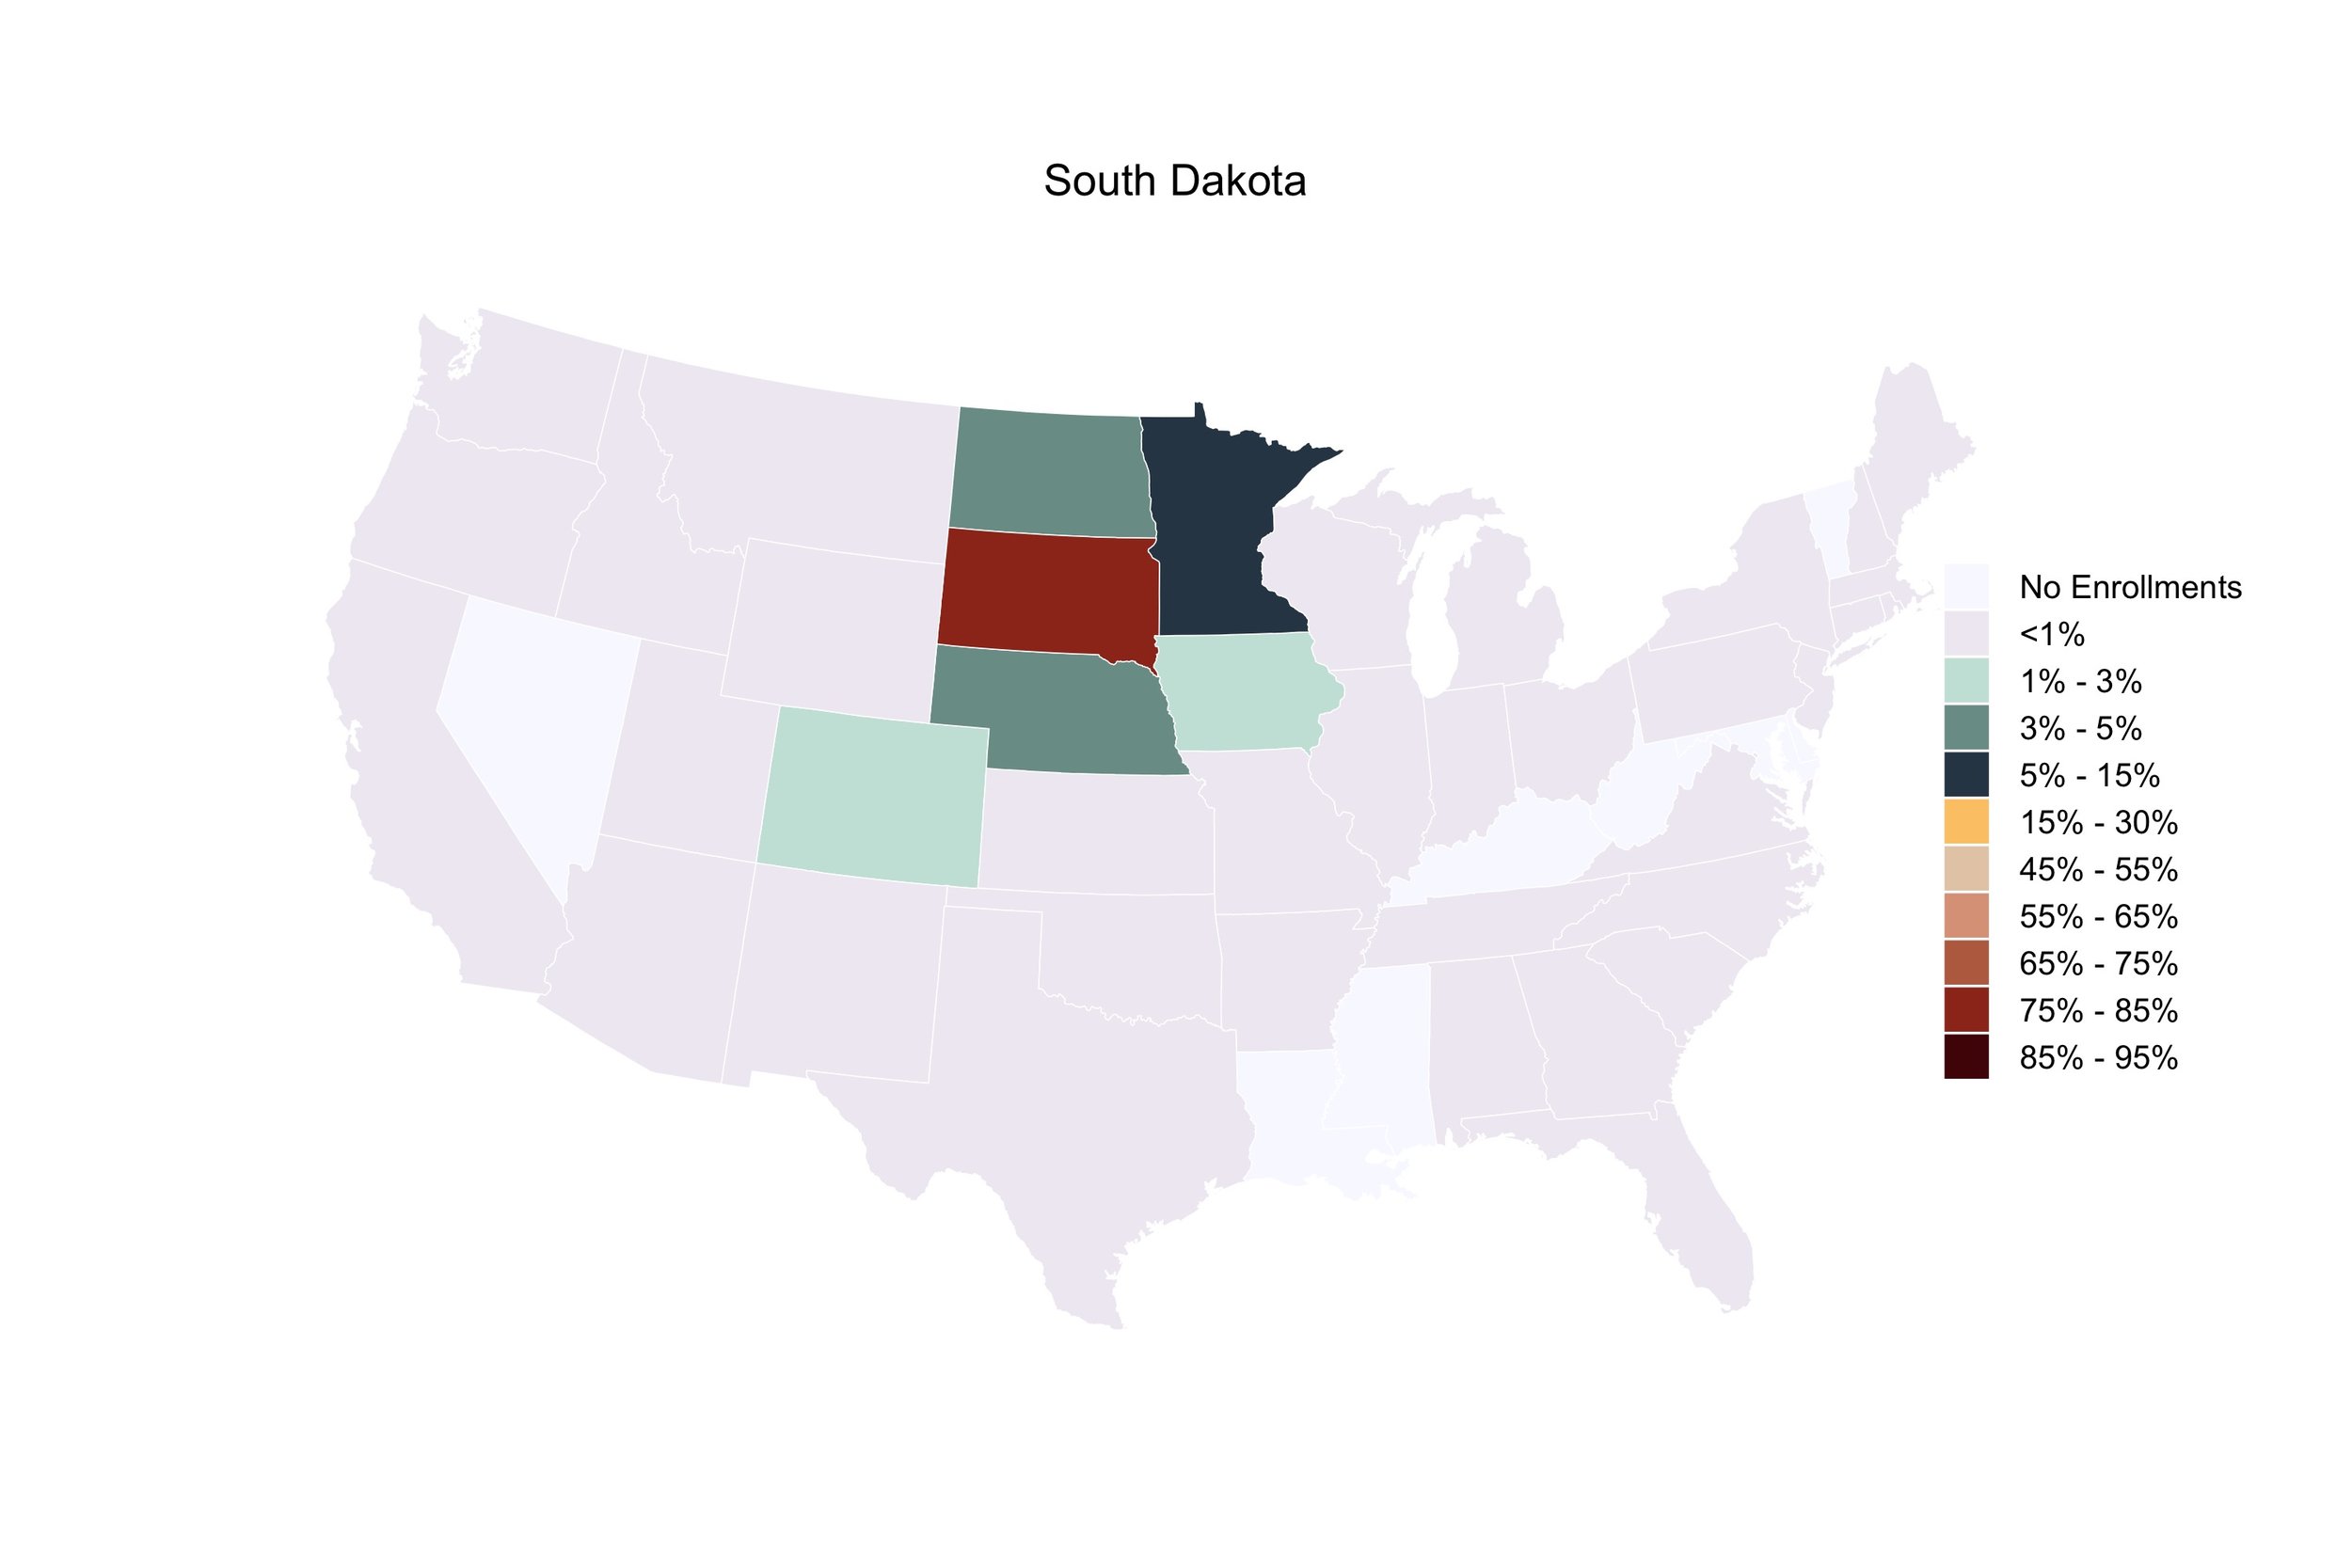
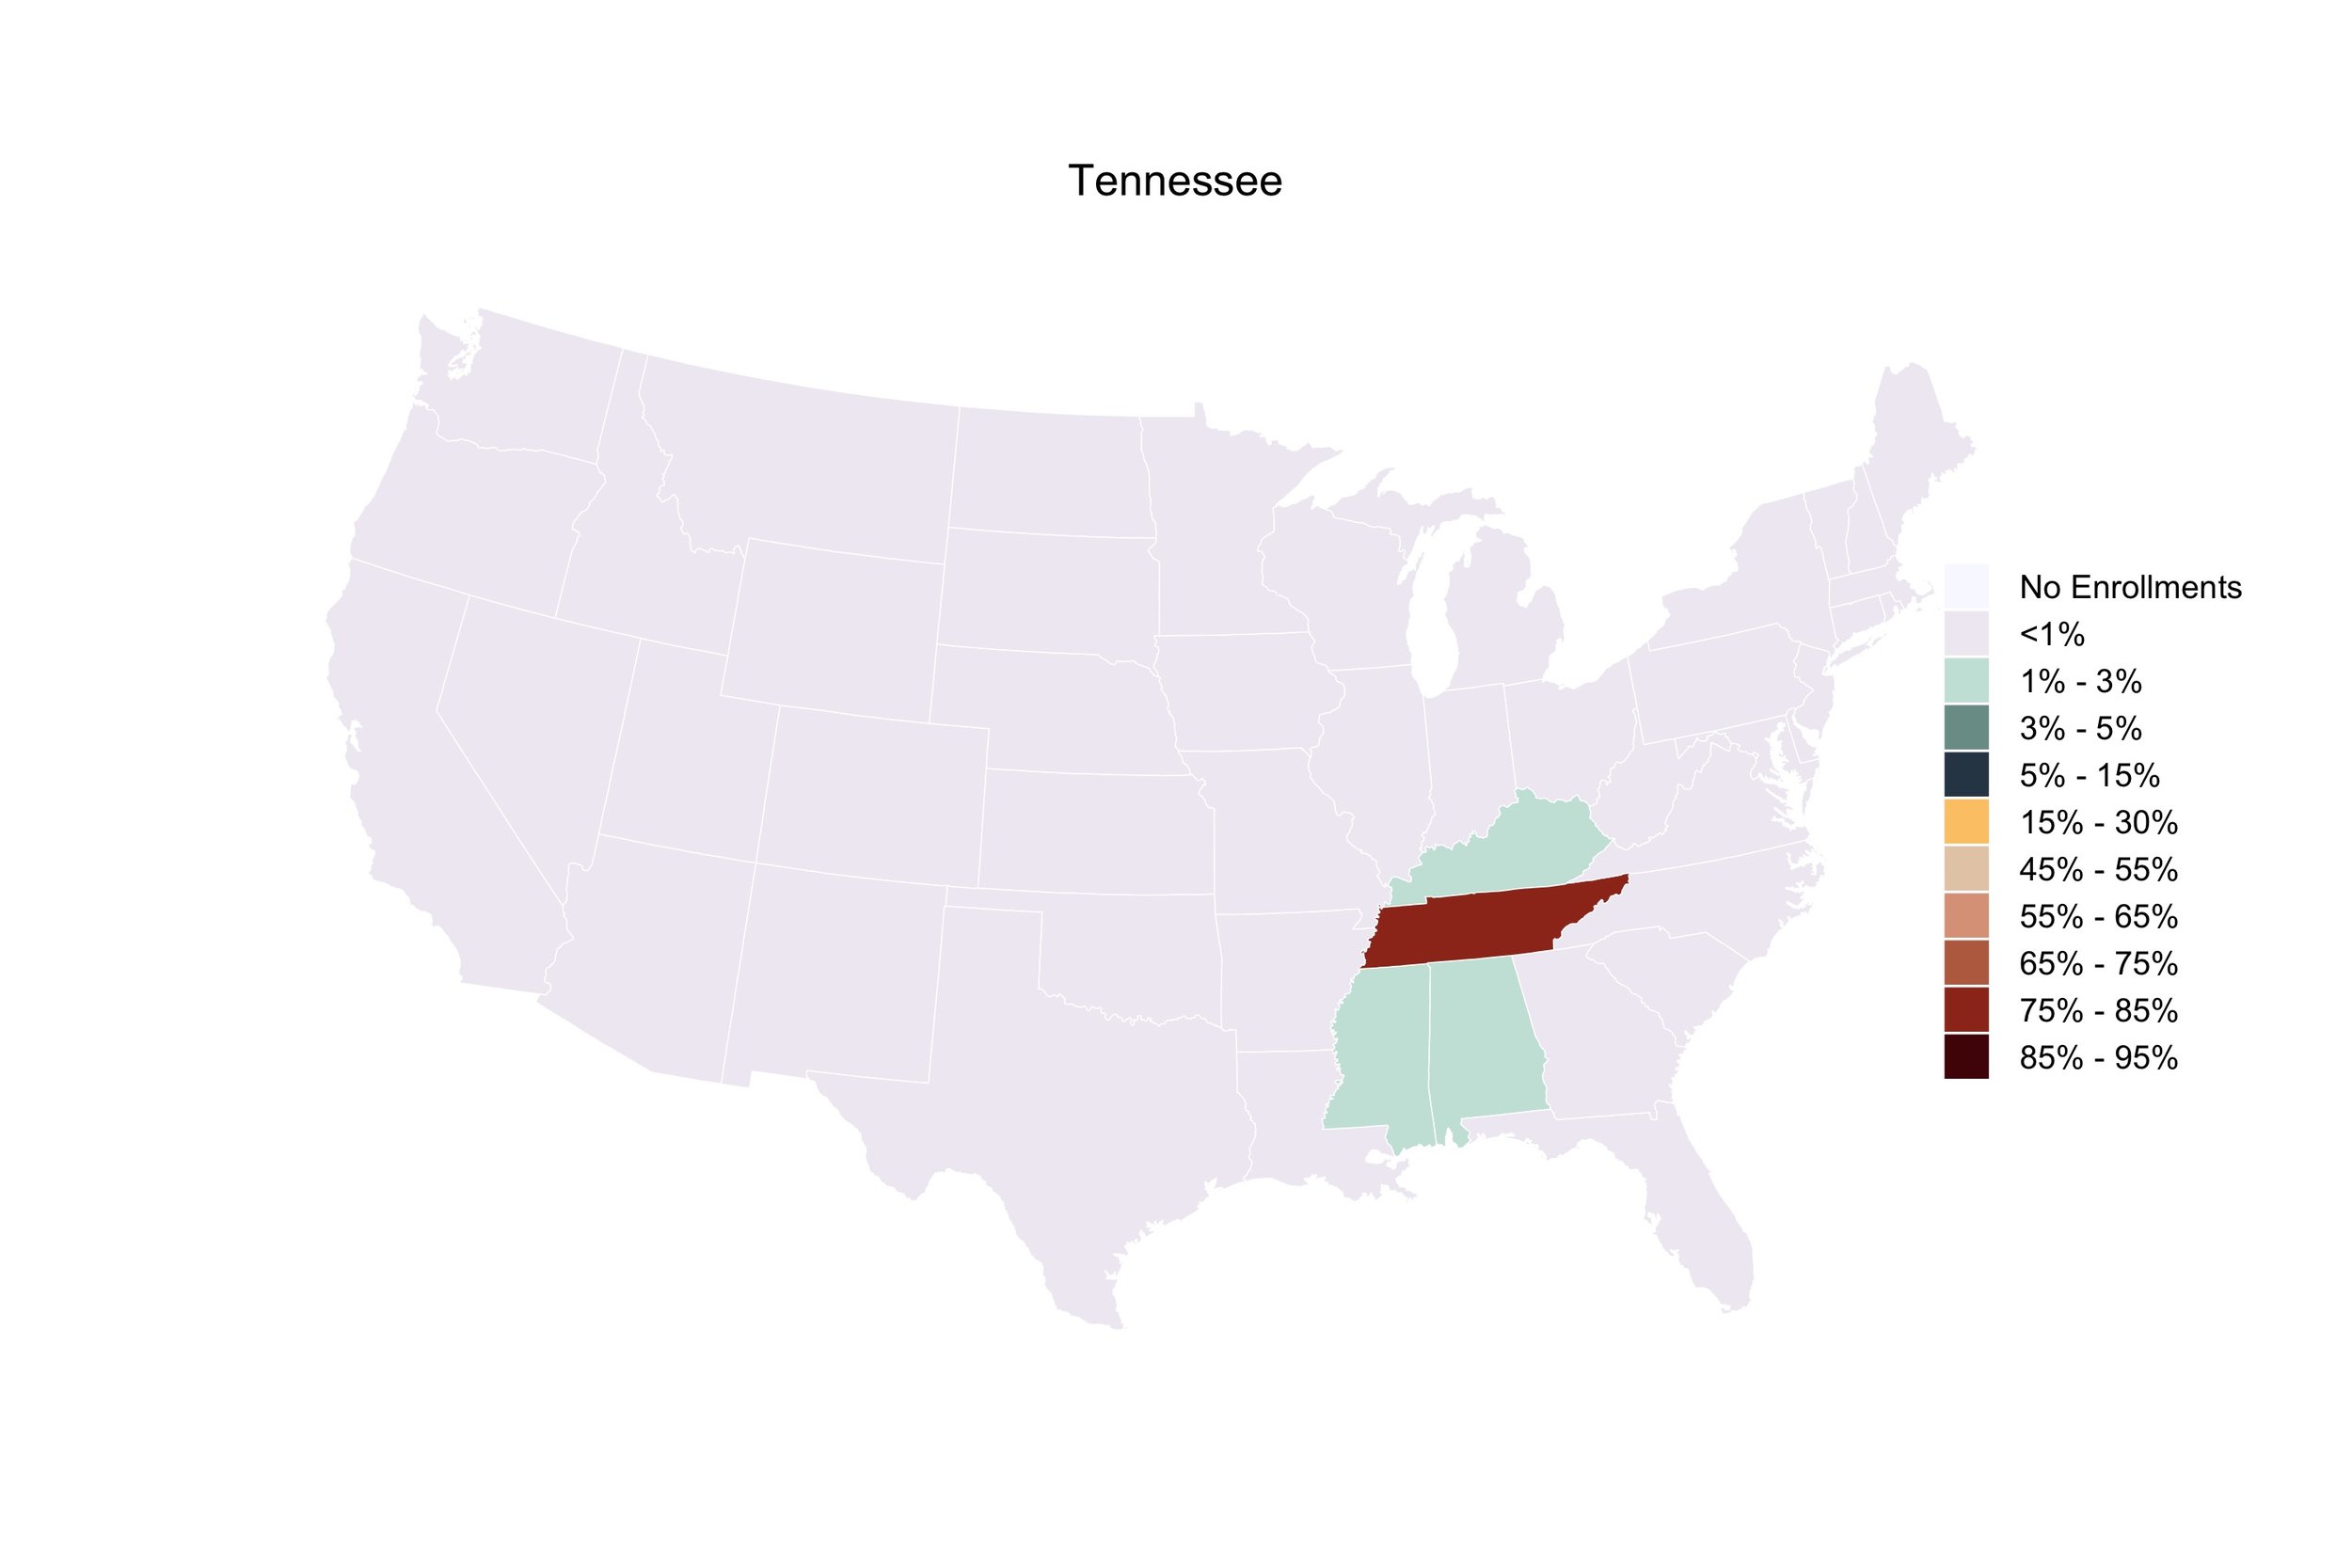
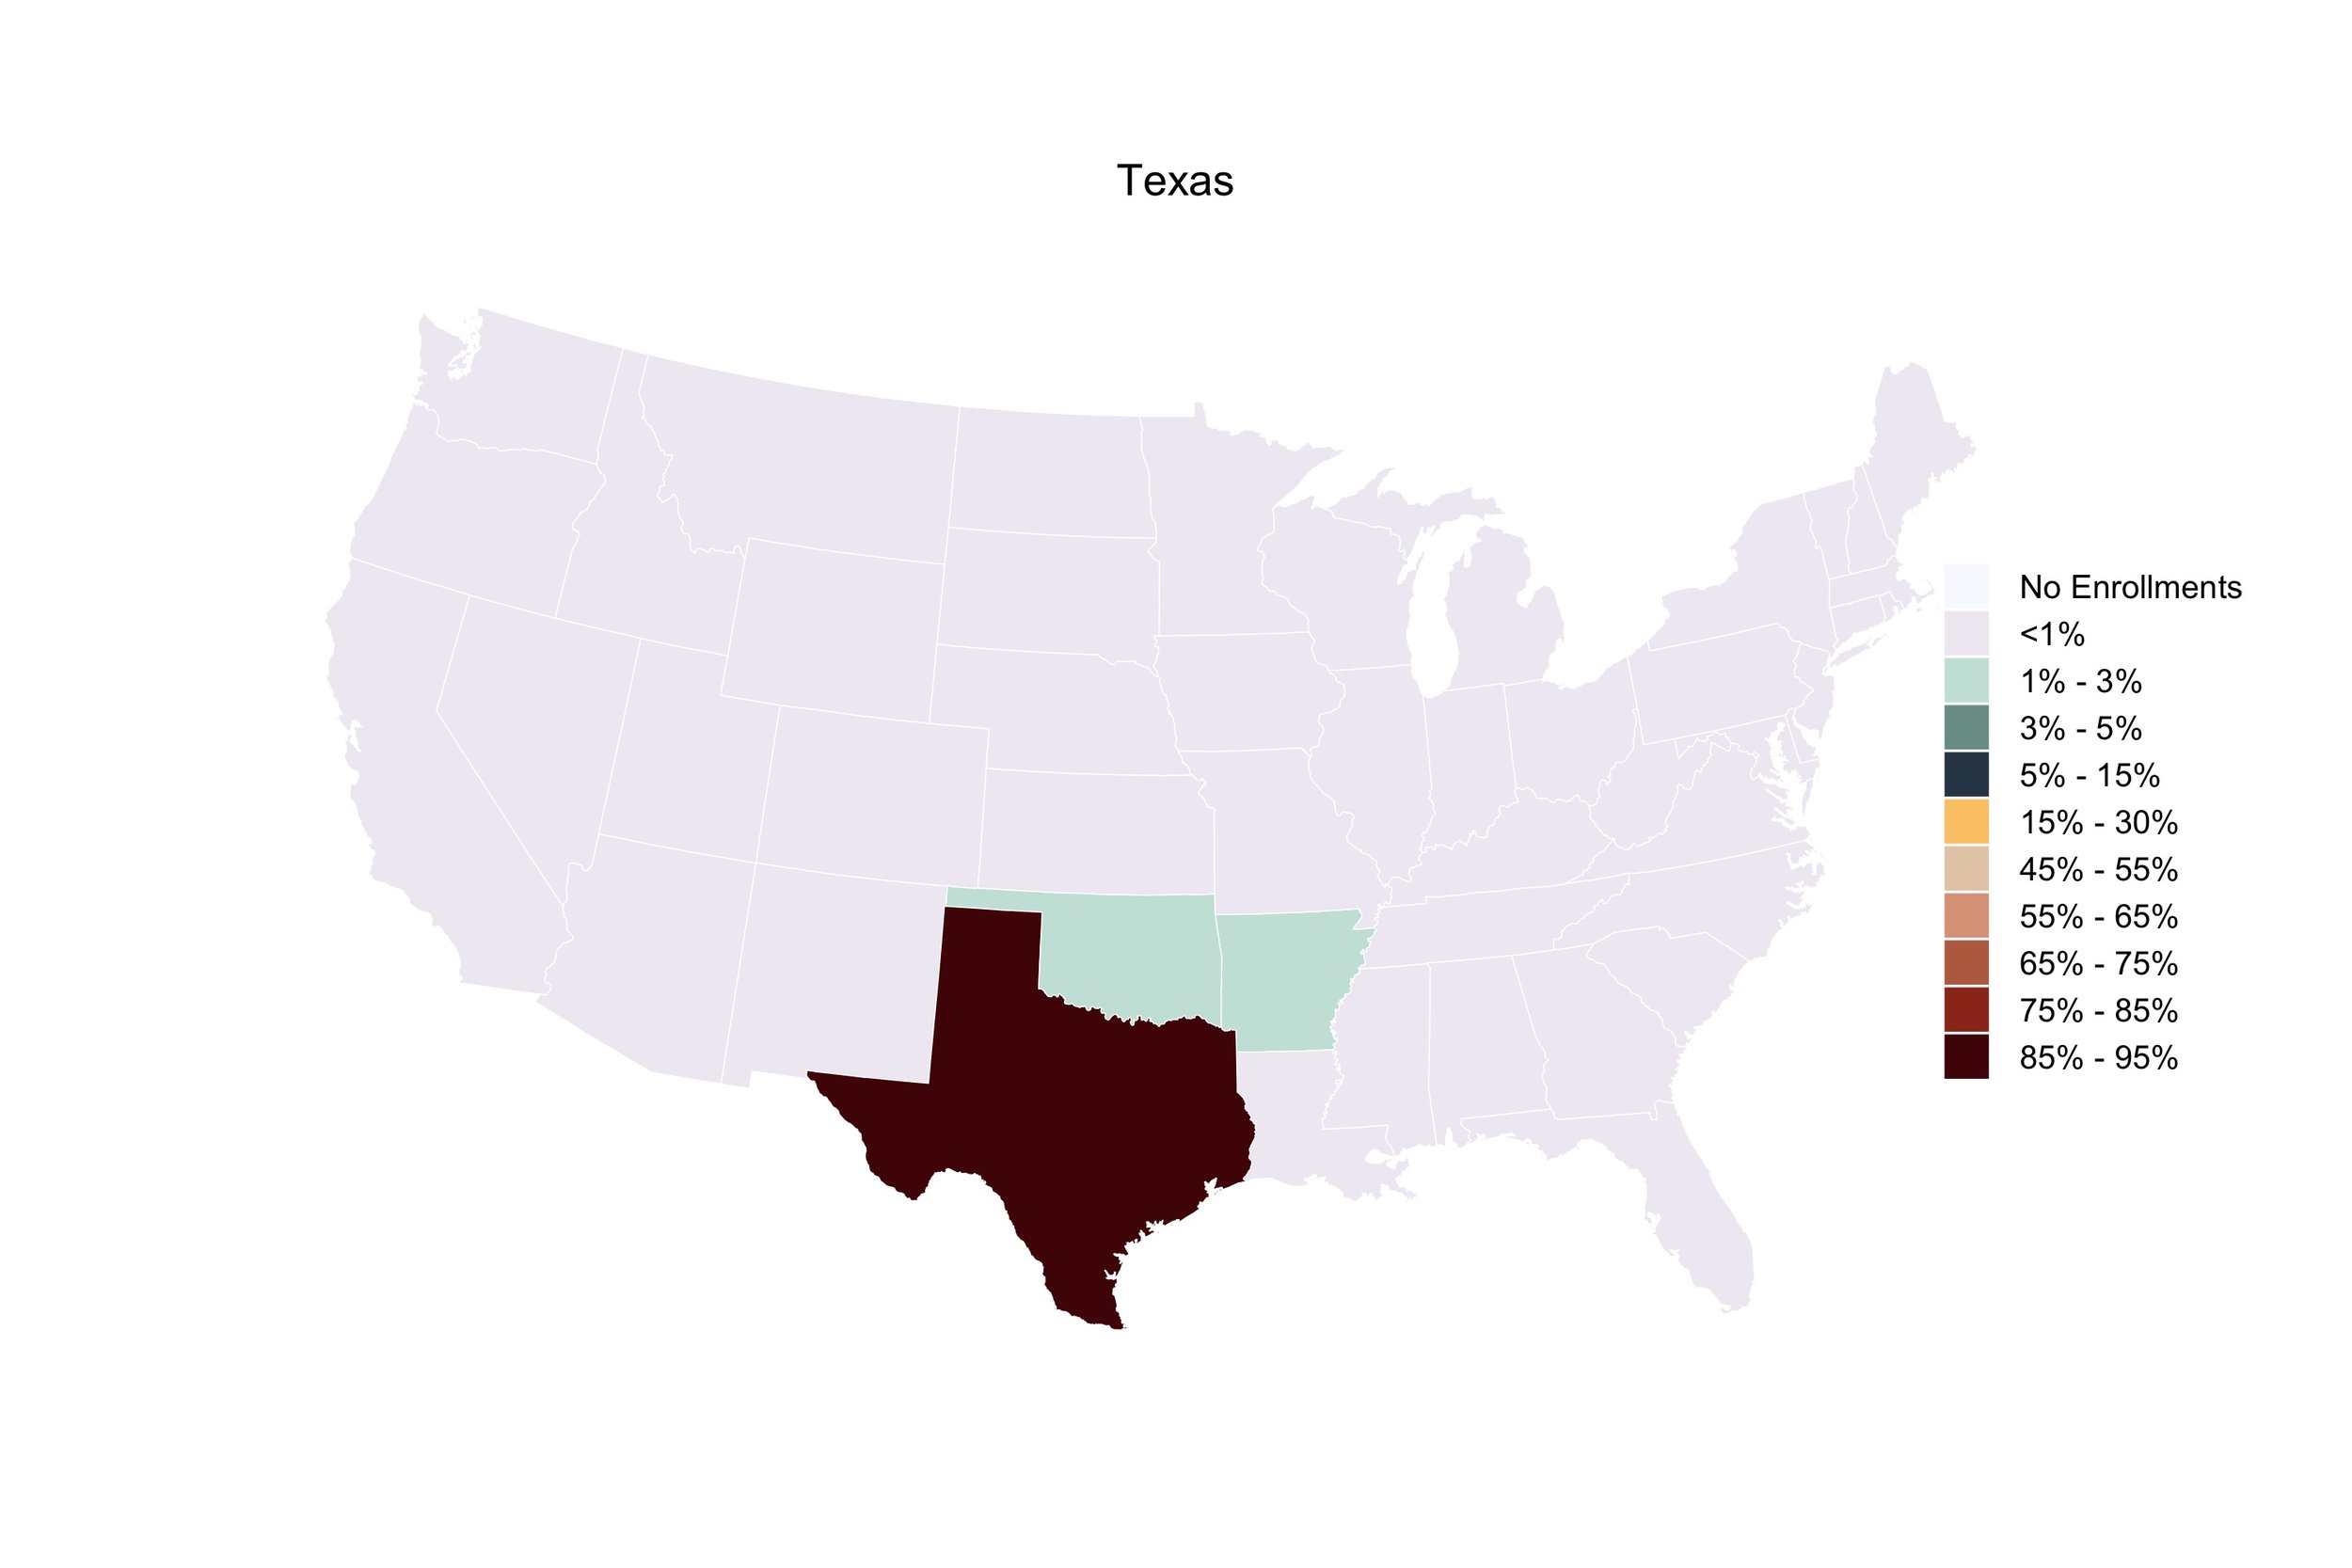
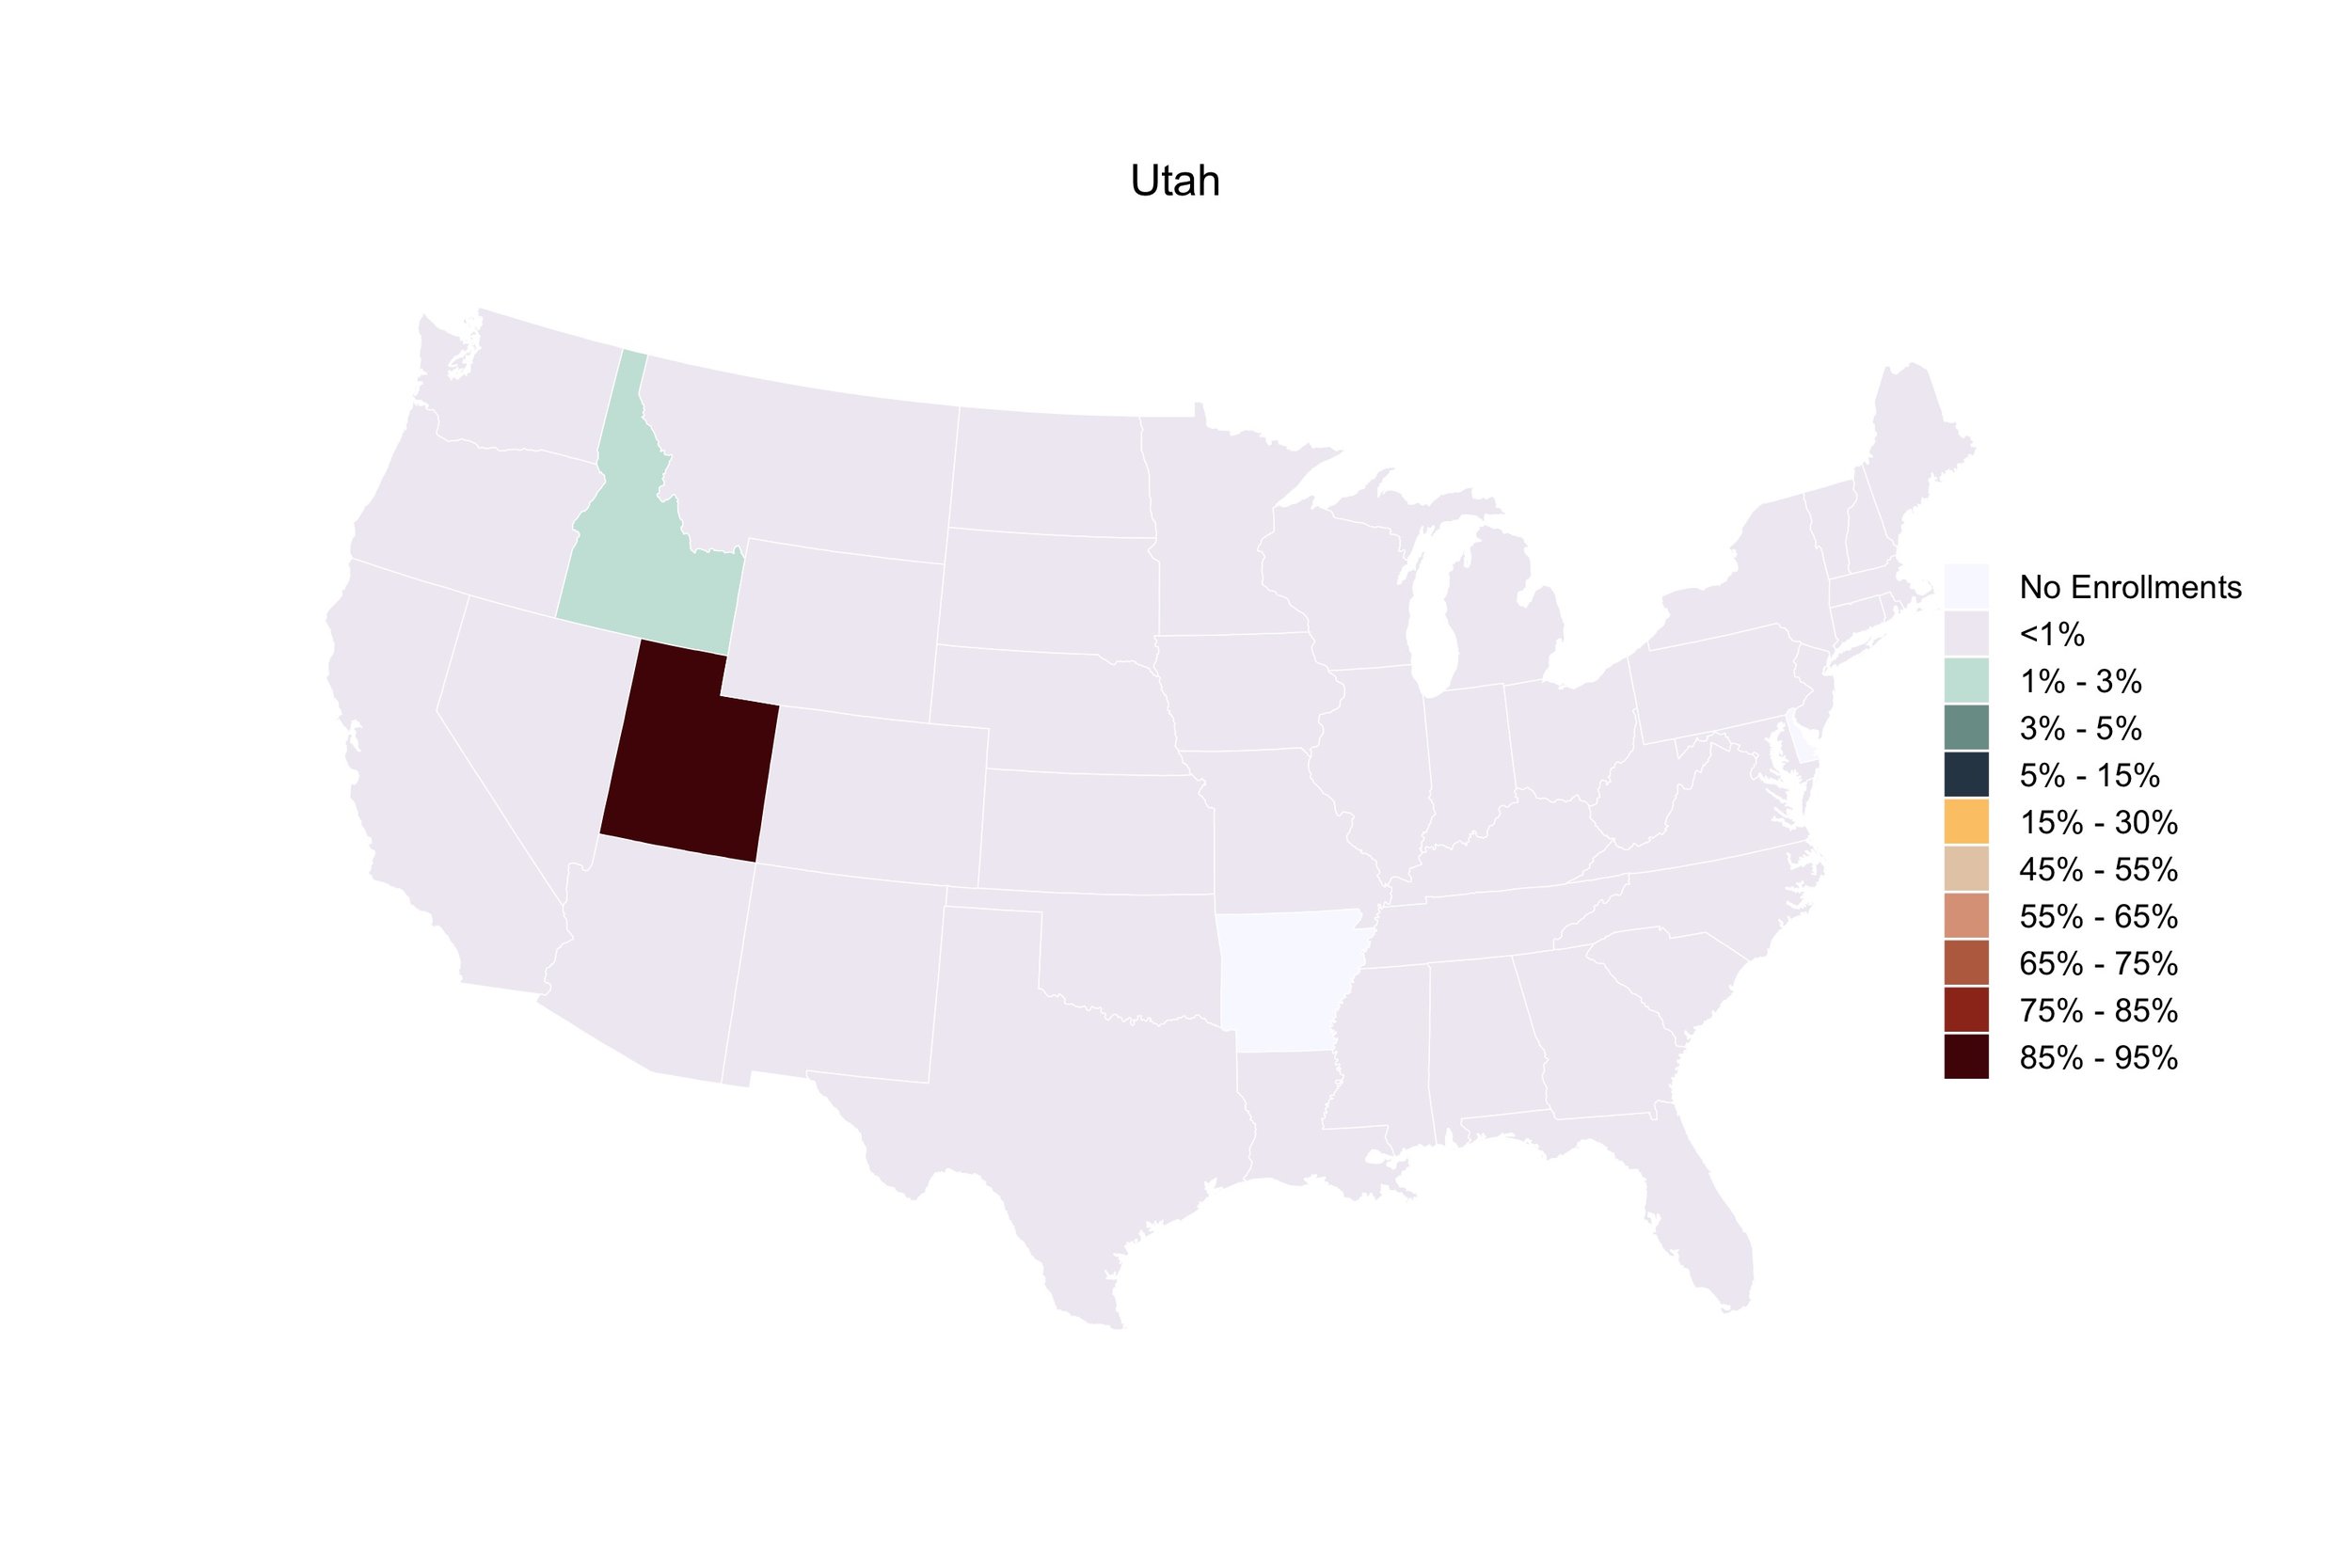
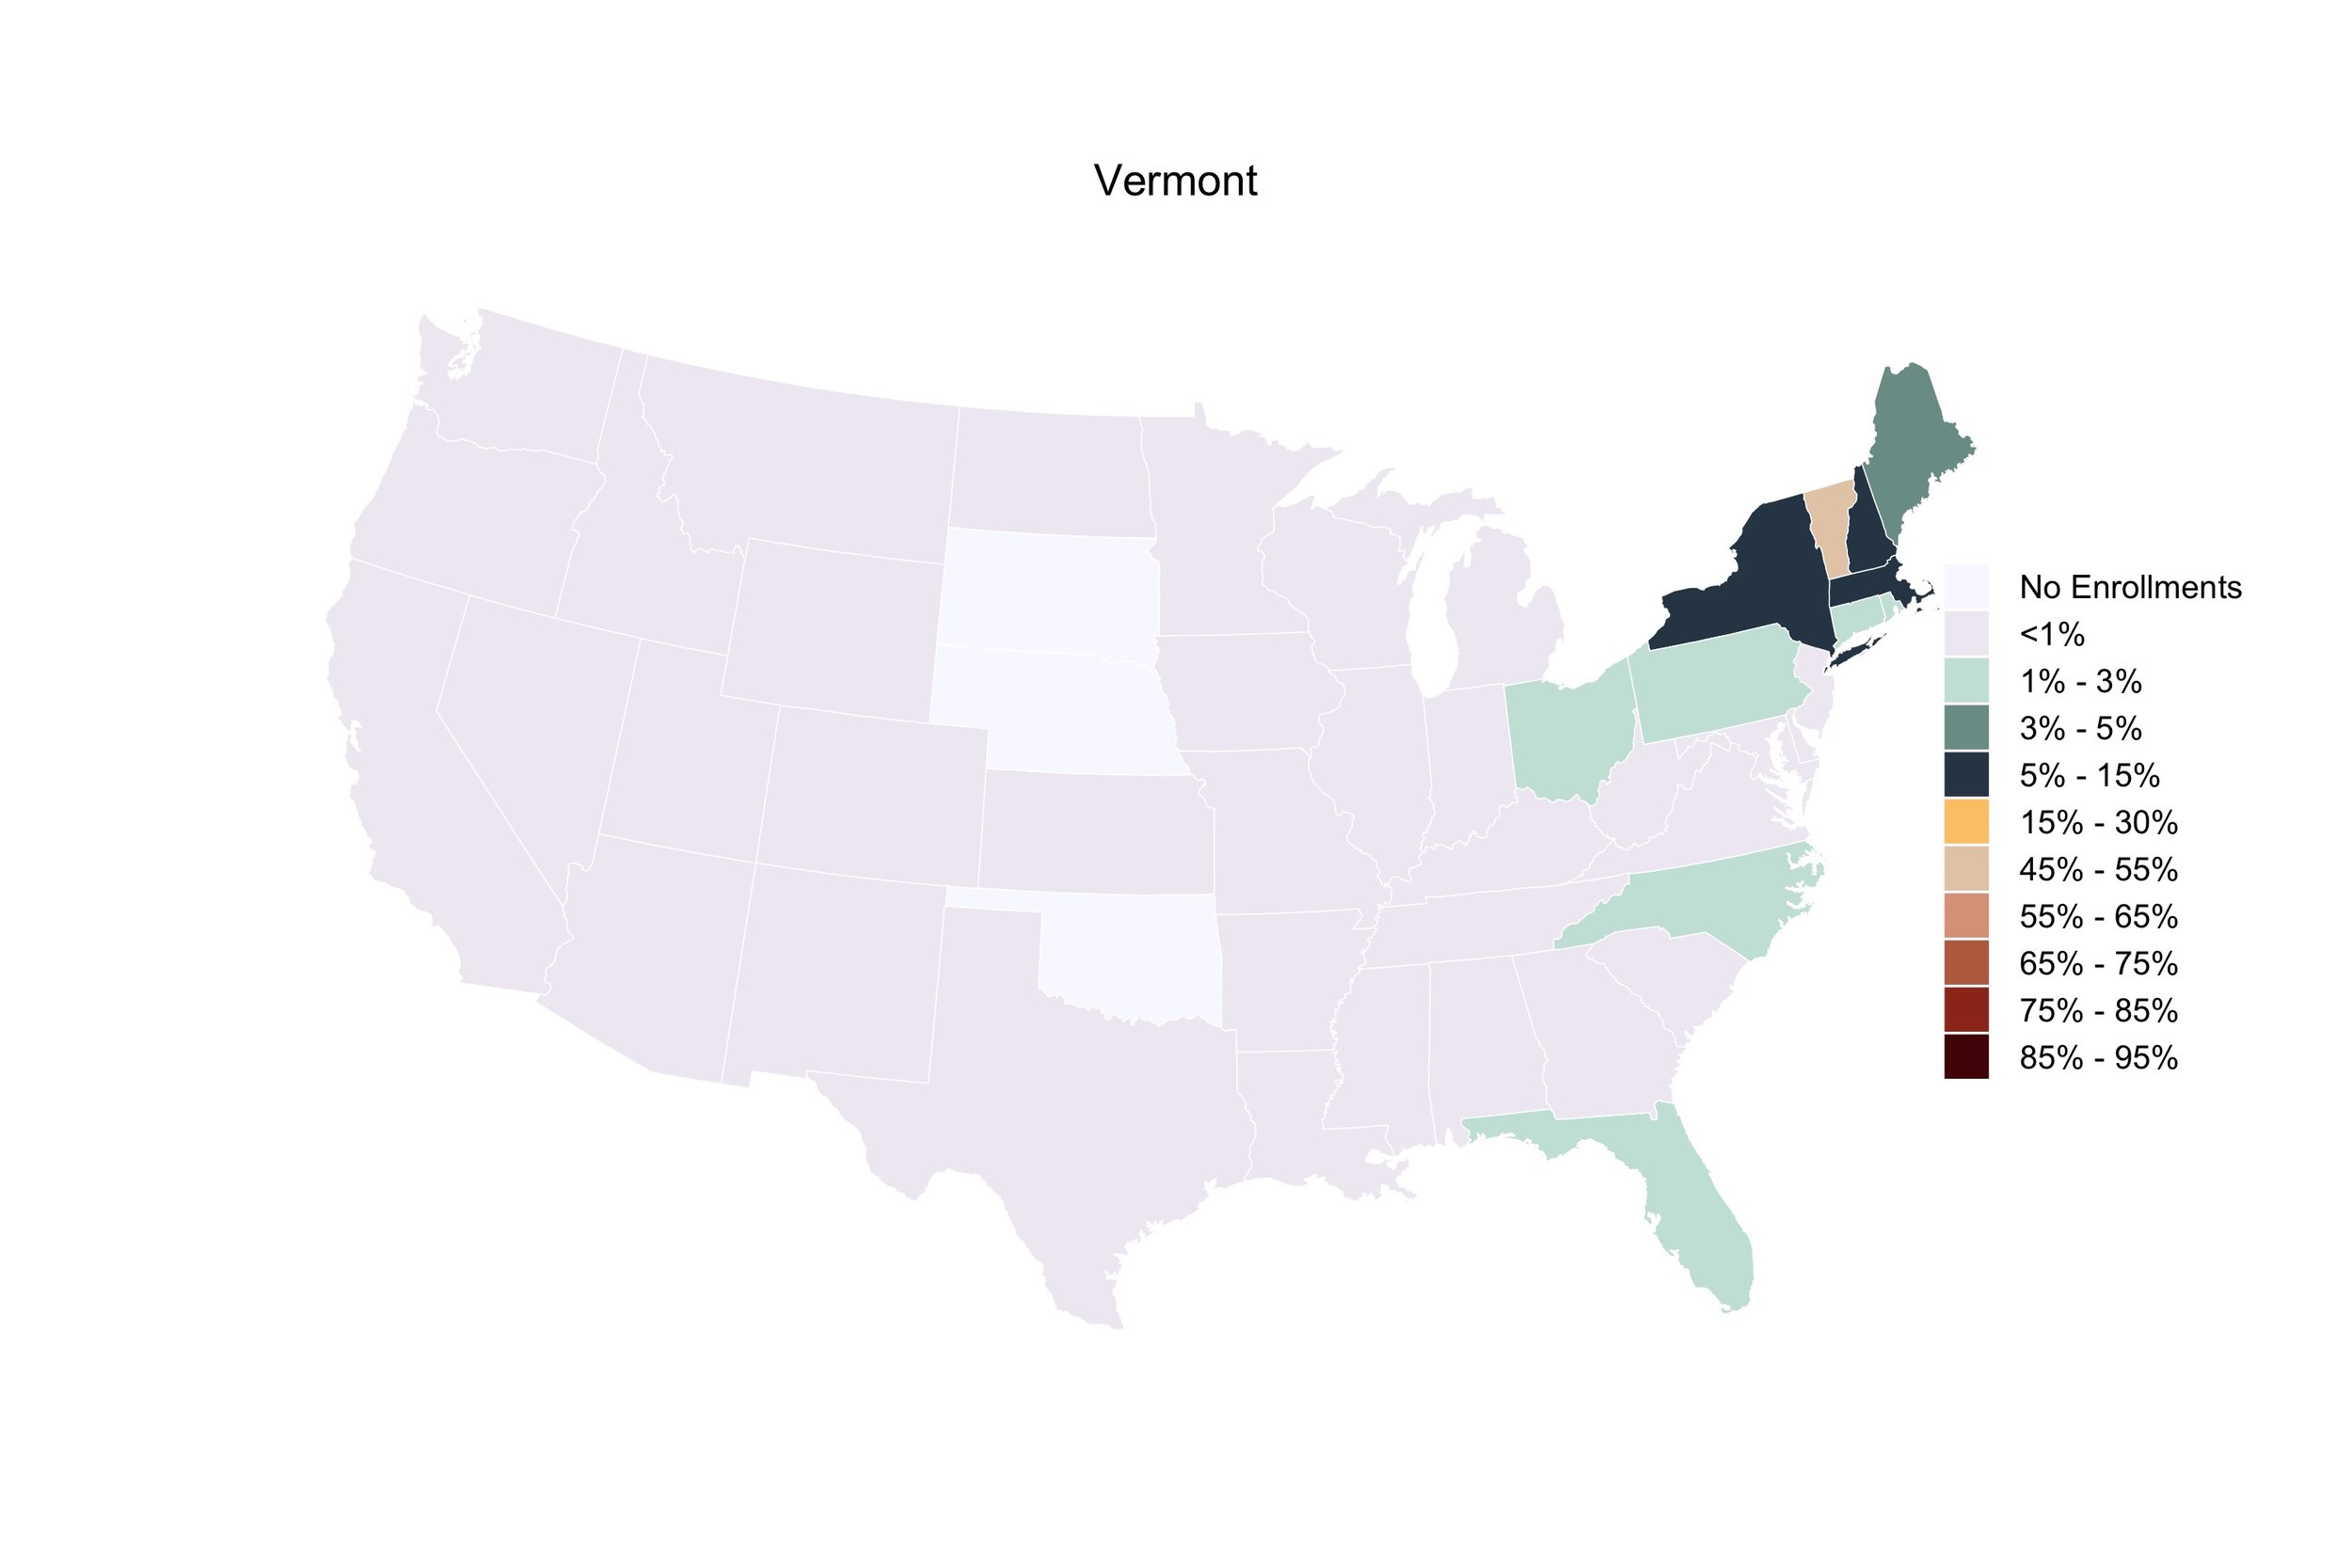
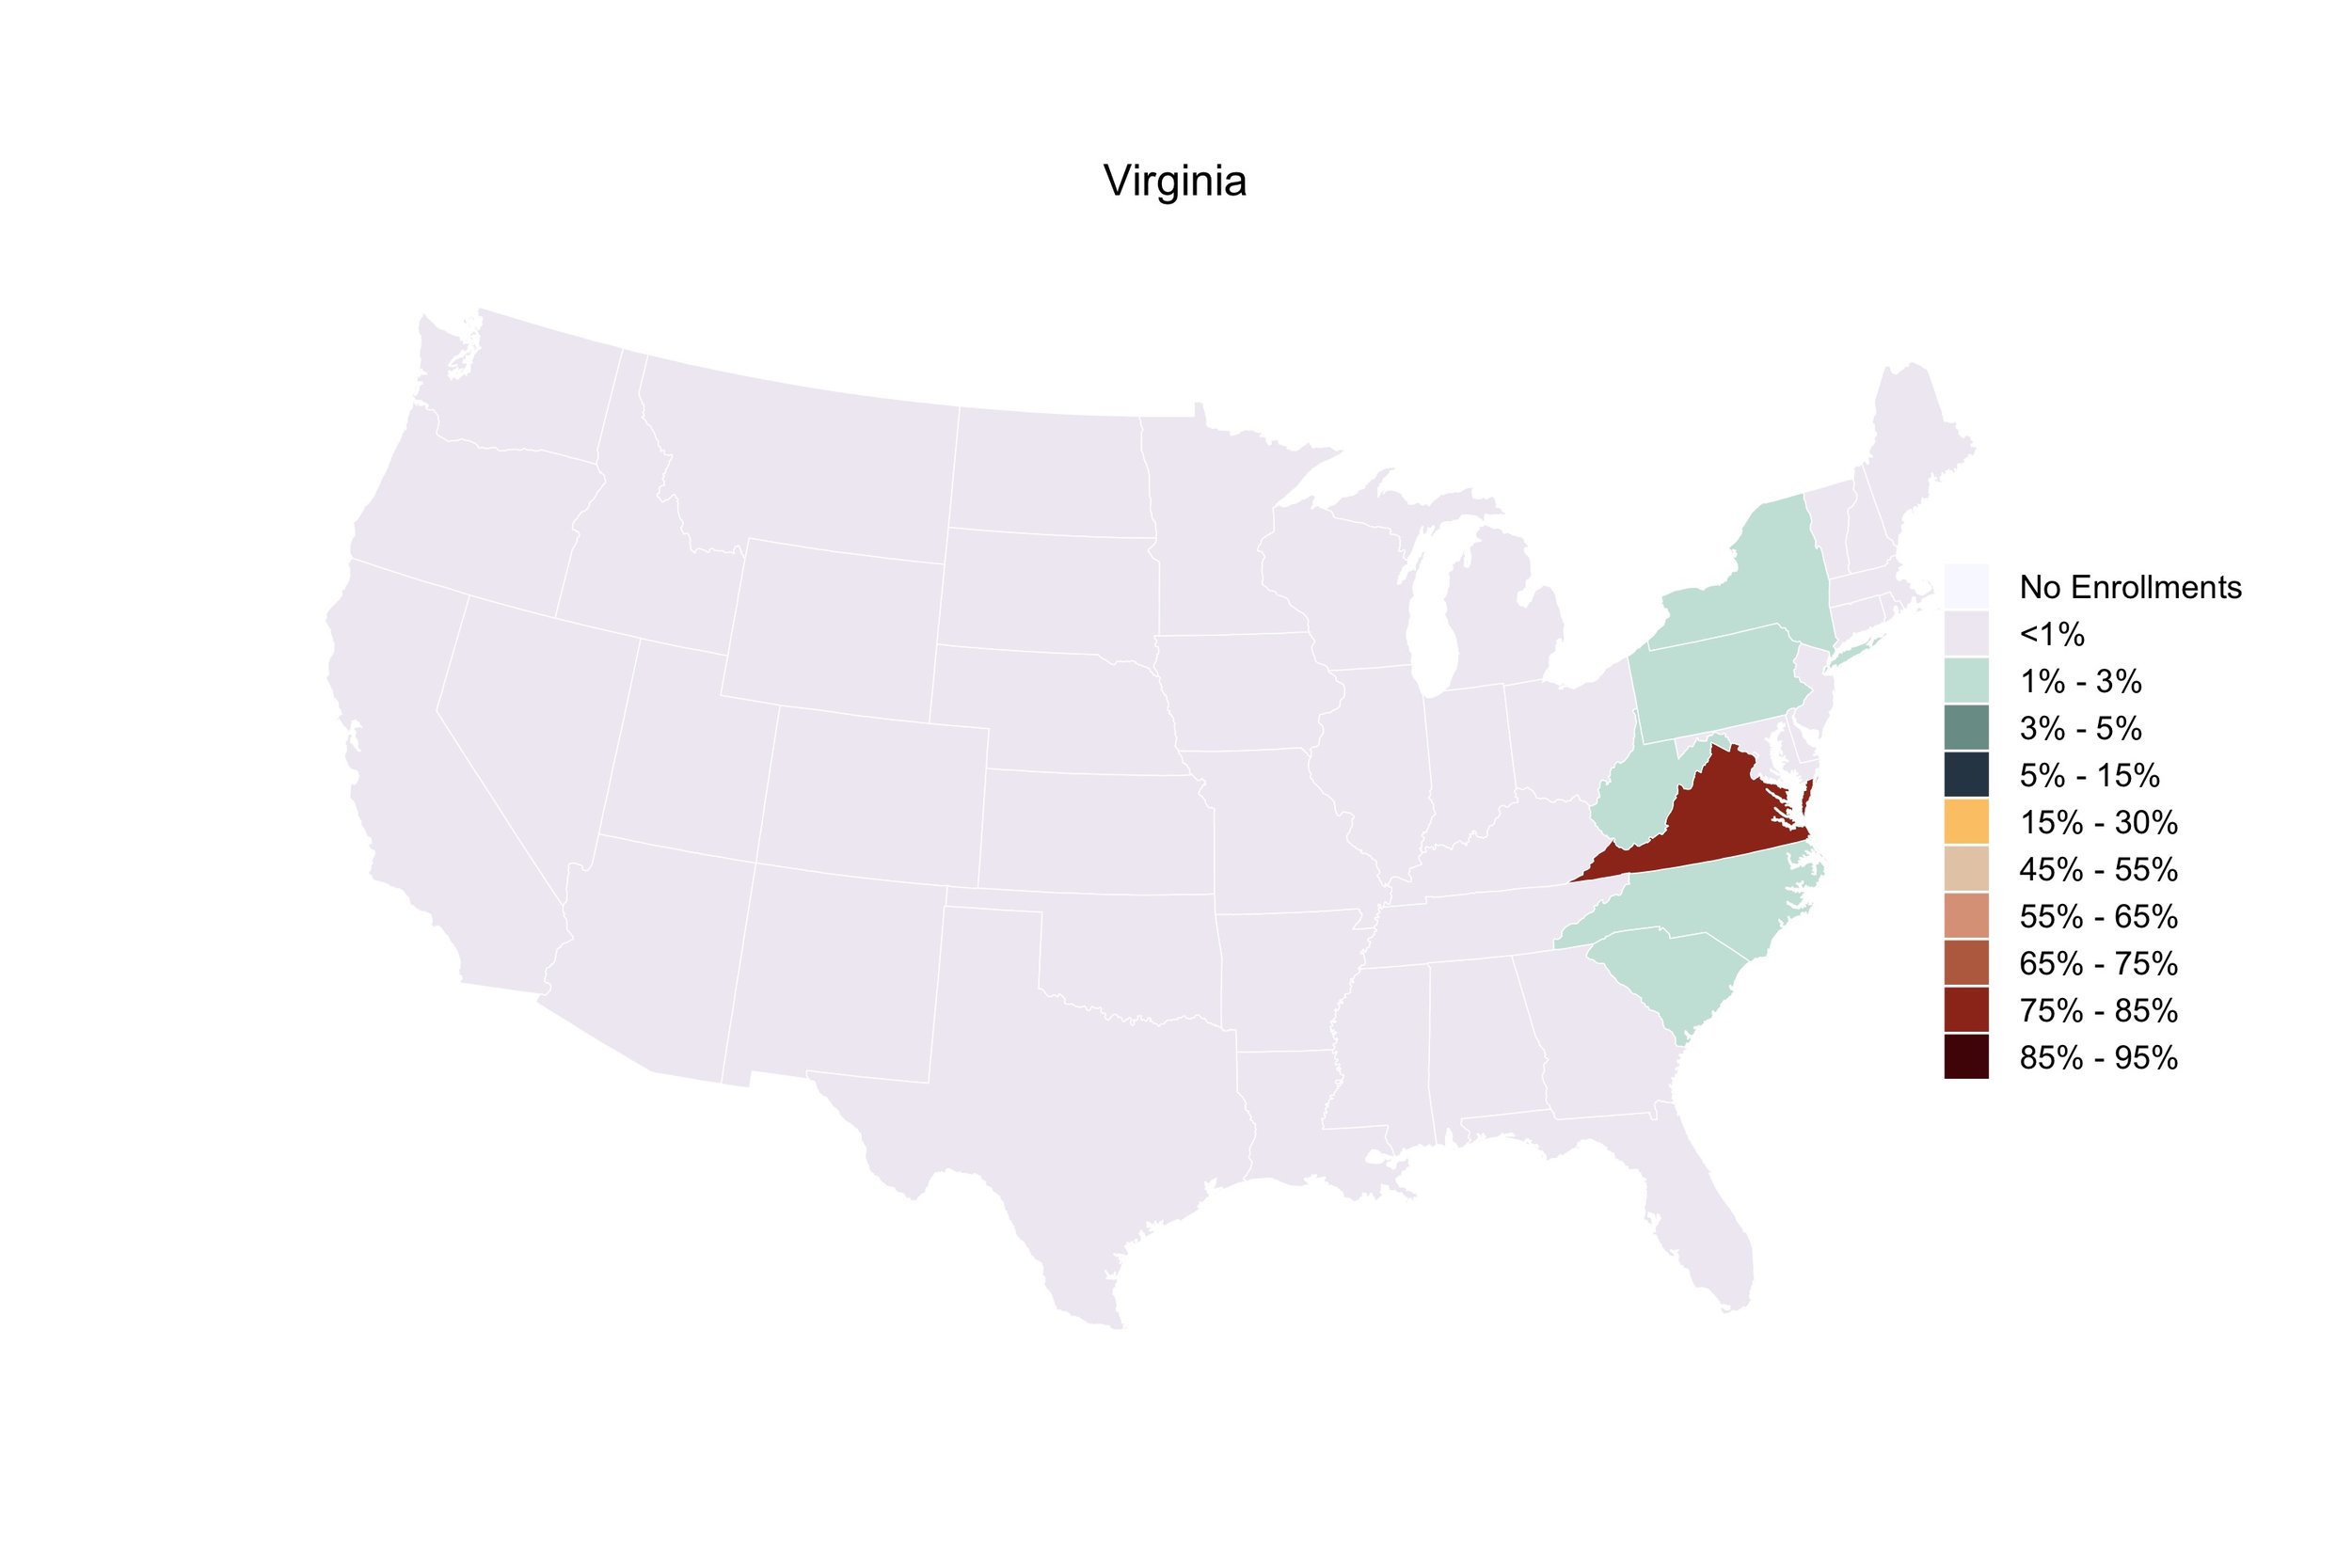
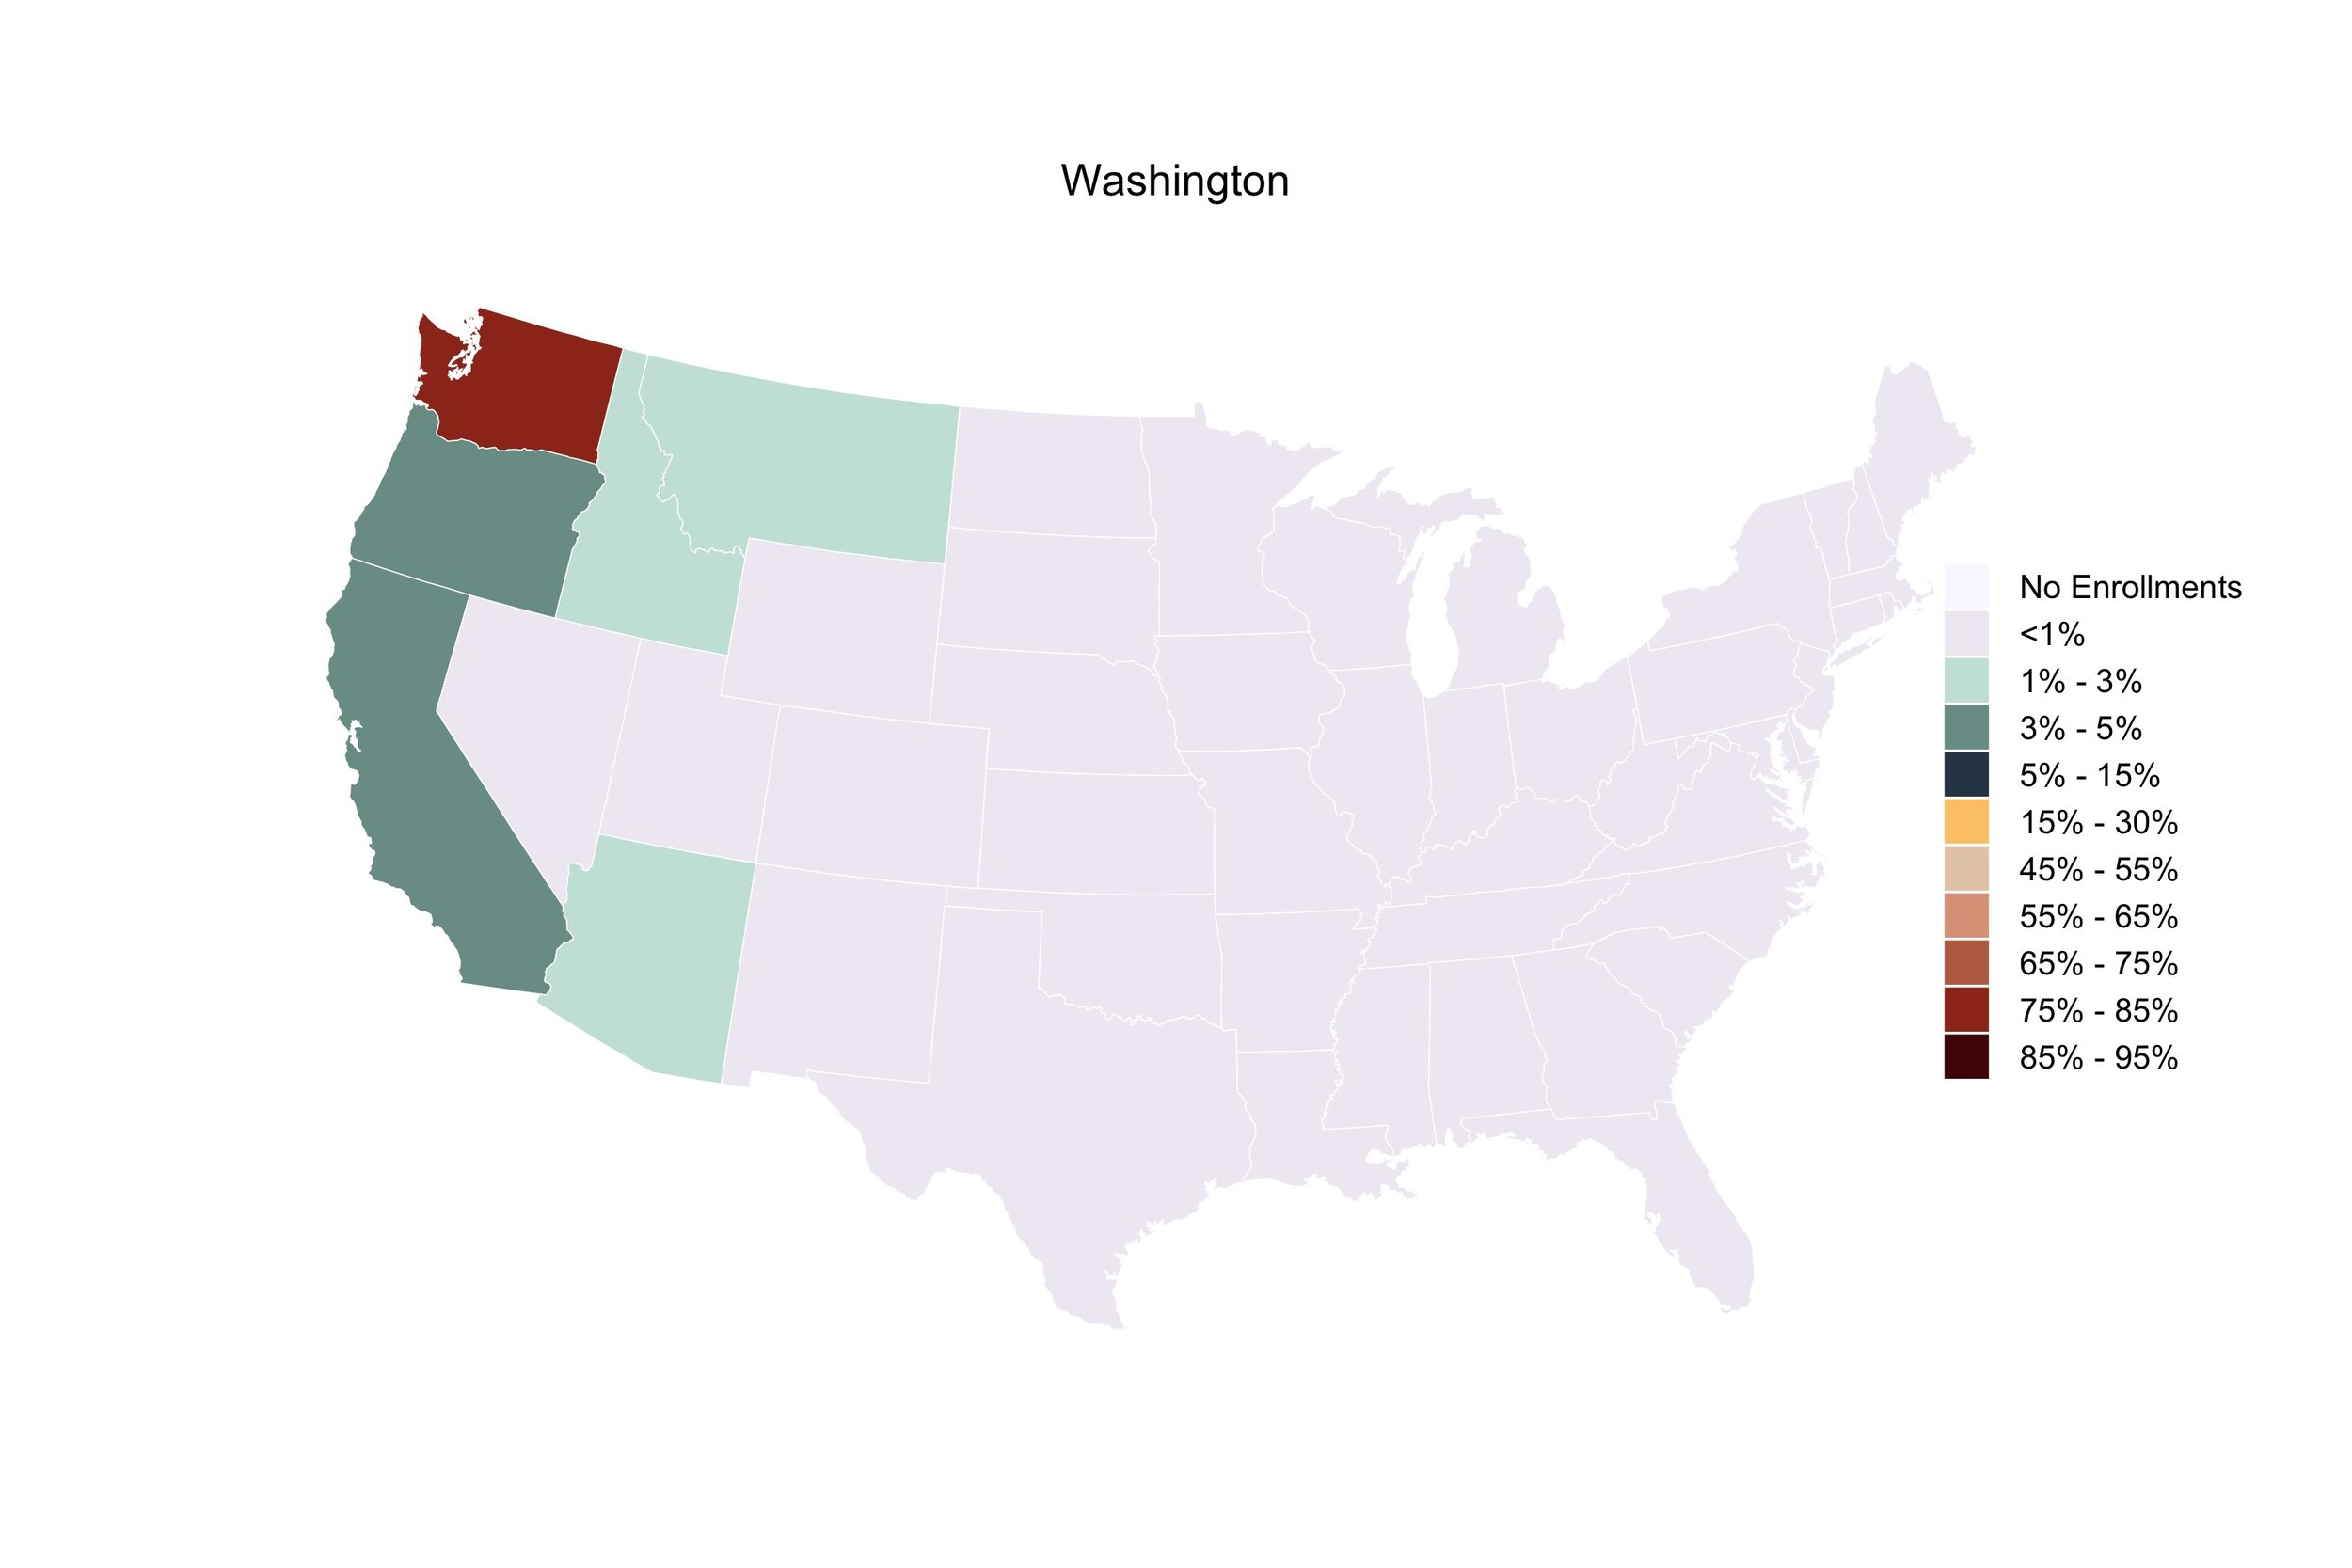
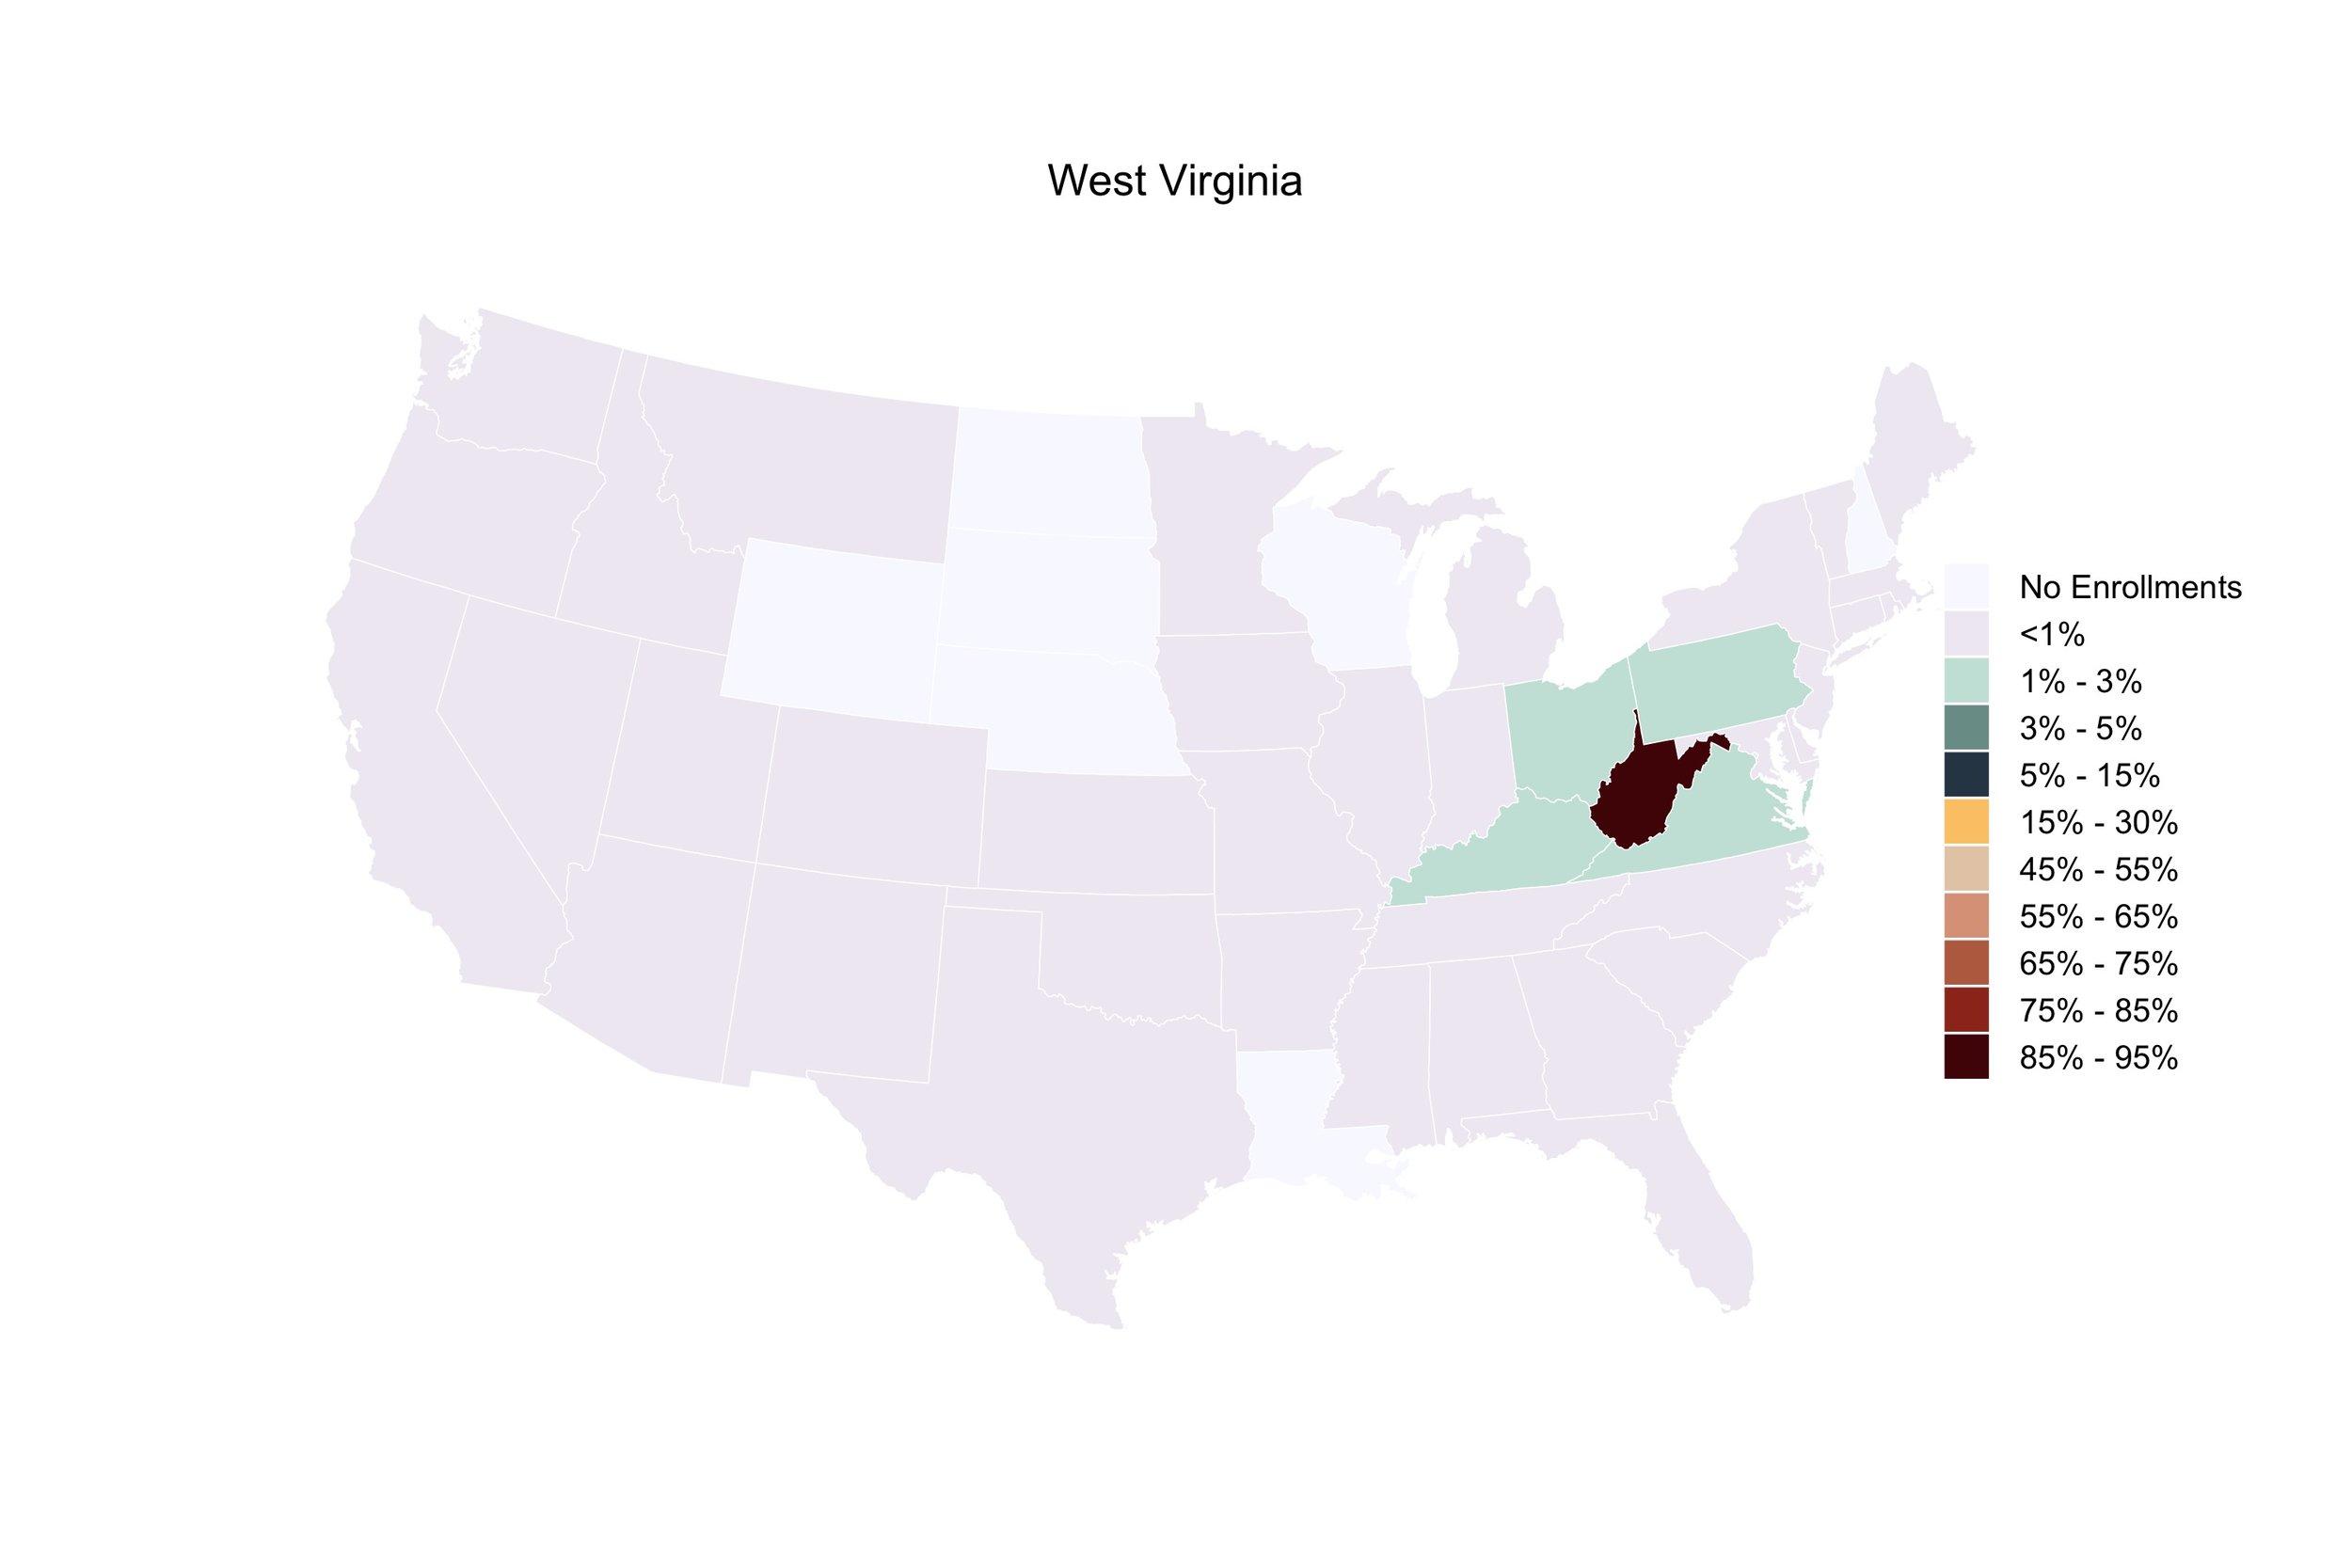
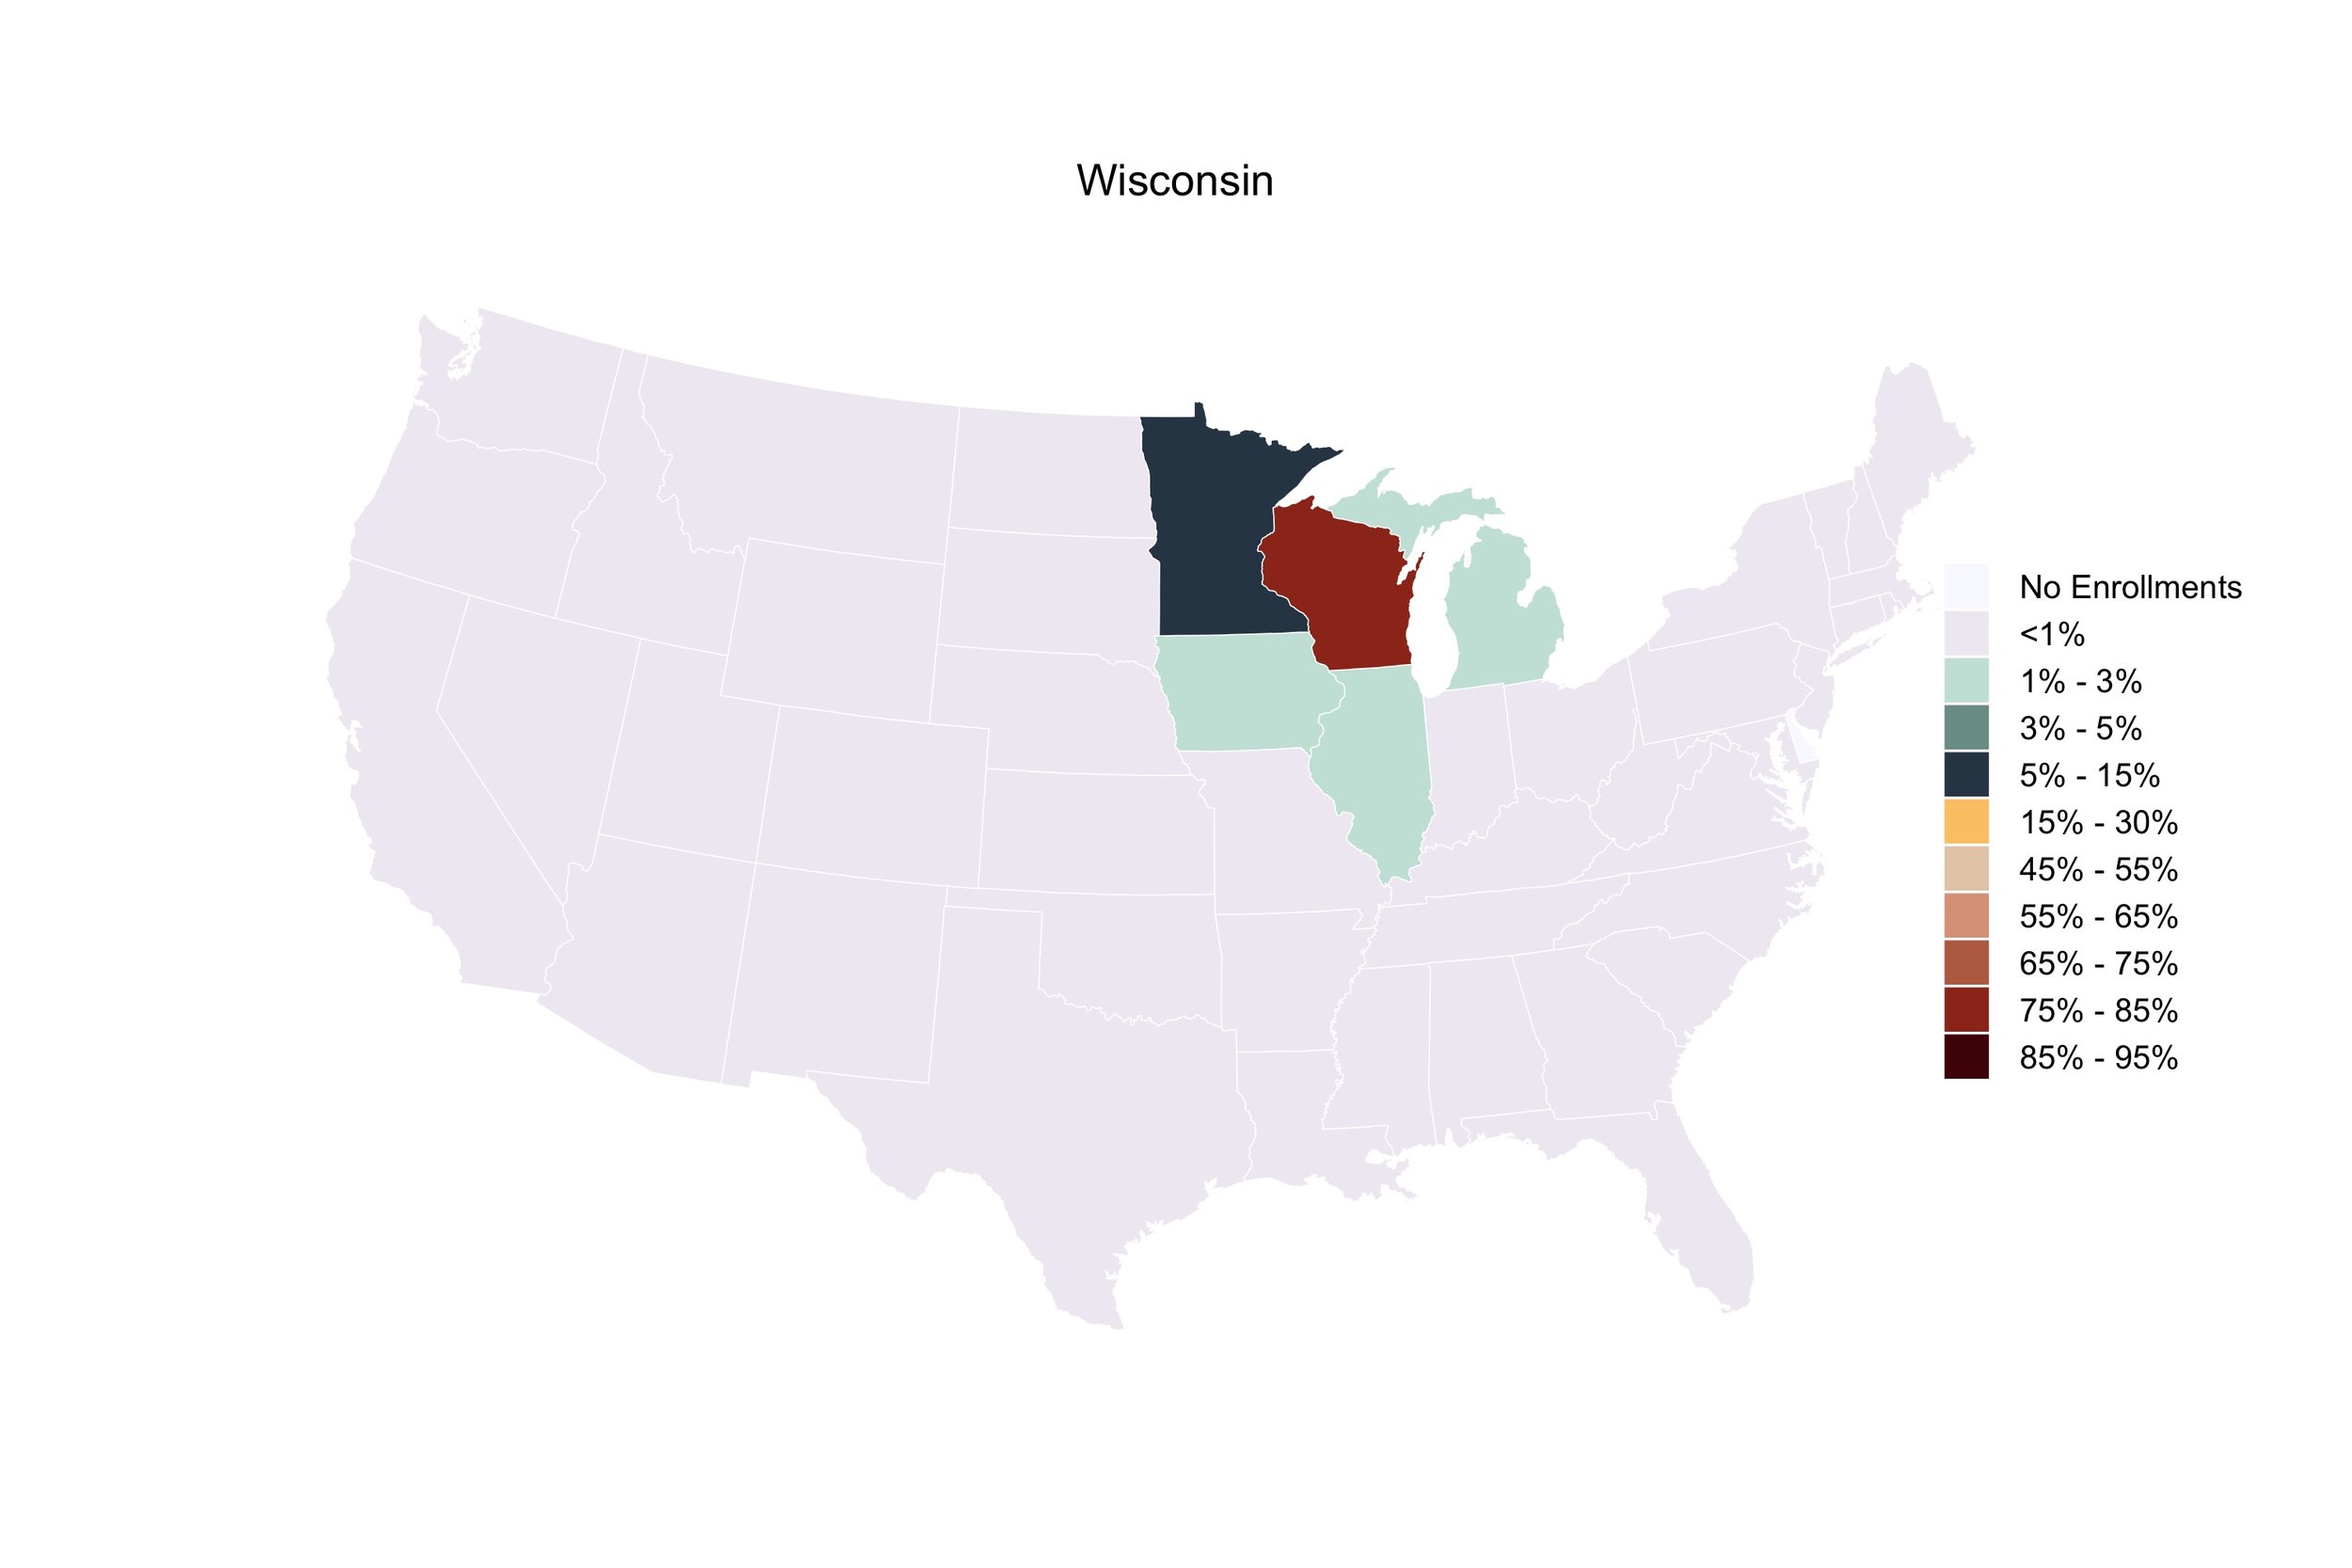
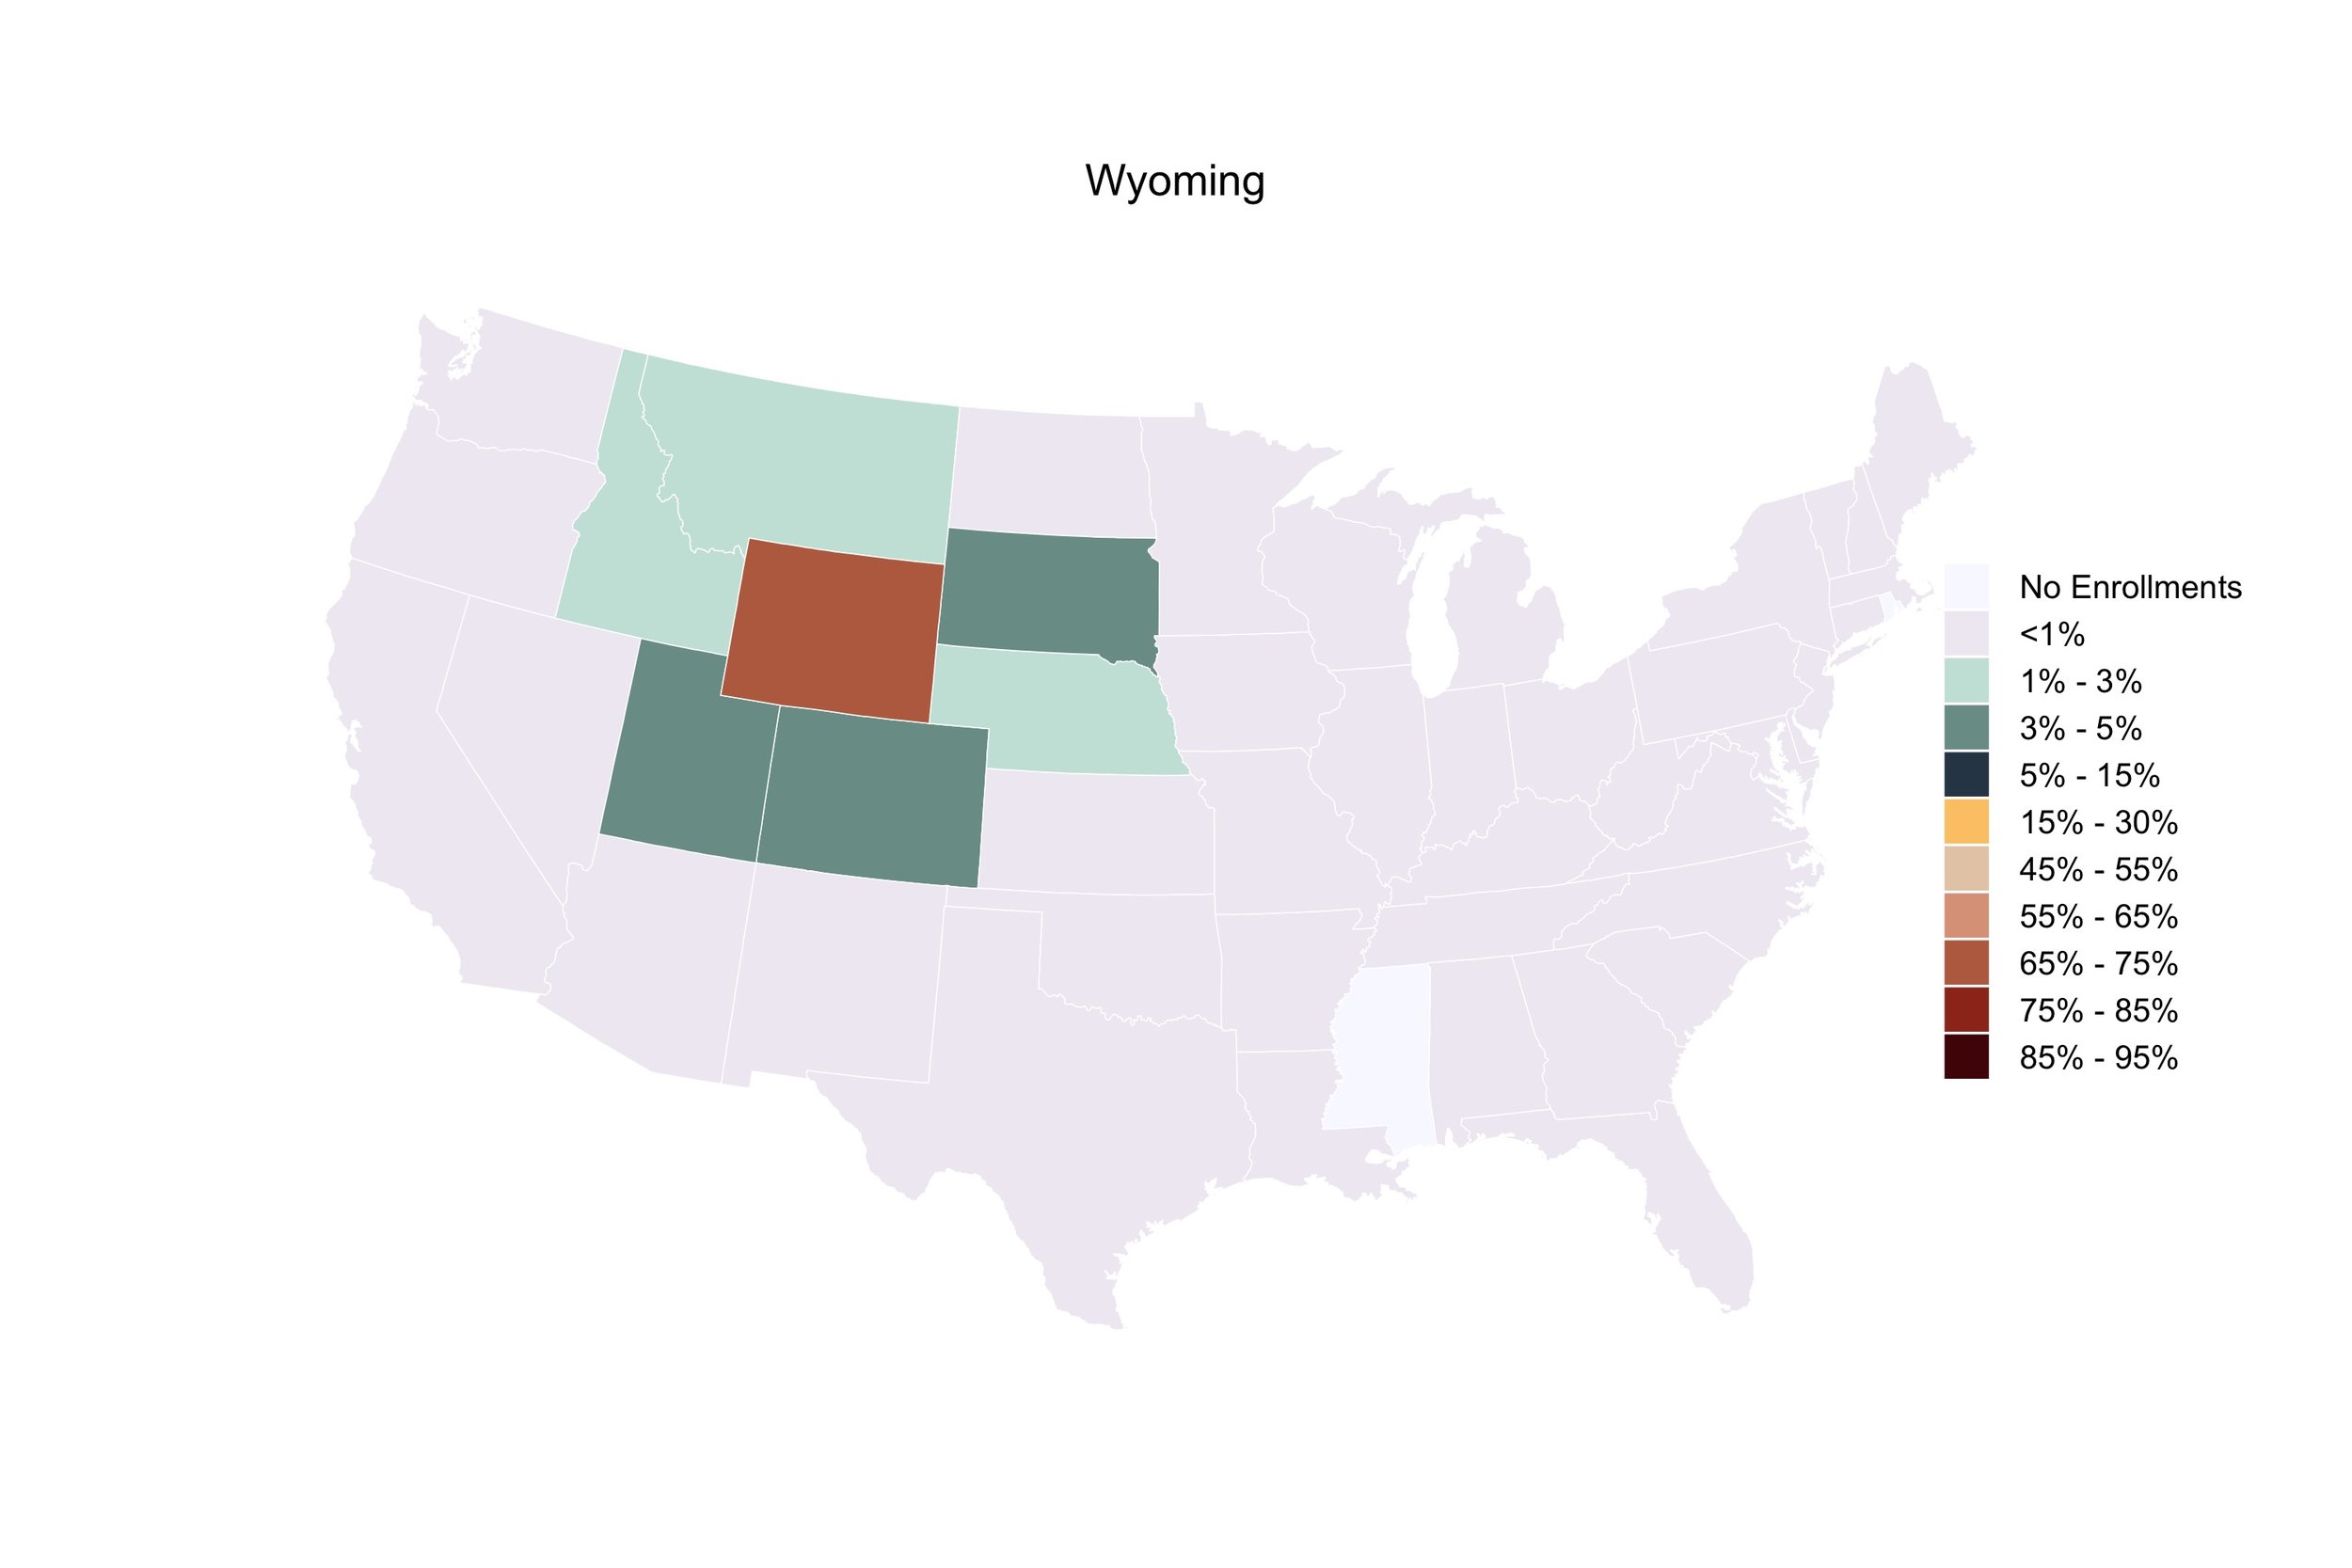
Exhibit A: Percent Student Out-Migration to College, by State of Residence: Fall 2018

Among the 50 states, the share of first-time college-goers who out-migrated to attend college in fall 2018 ranged from 7% in Mississippi to 53% in Vermont. The District of Columbia, with its limited number of postsecondary institutions and geographic proximity to suburban Virginia and Maryland, is an outlier with 81% of its residents out-migrating to attend college. Thirty-five states had fewer than 25% of their college-going residents out-migrate to attend college.

Explore the interactive choropleth map below to view additional information on the number of each state’s residents who out-migrated and the number of unique postsecondary institutions and states to which they traveled.

Notes: Exhibit includes U.S. degree-granting institutions that participate in Title IV federal financial aid programs. Student counts include U.S. residents who are first-time degree/certificate-seeking, completed high school within twelve months of…

Notes: Exhibit includes U.S. degree-granting institutions that participate in Title IV federal financial aid programs. Student counts include U.S. residents who are first-time degree/certificate-seeking, completed high school within twelve months of fall enrollment, and out-migrated from their states of residence to attend college. Source: Integrated Postsecondary Education Data system, Fall Enrollment (EF) survey, Spring 2019. Author’s calculations.

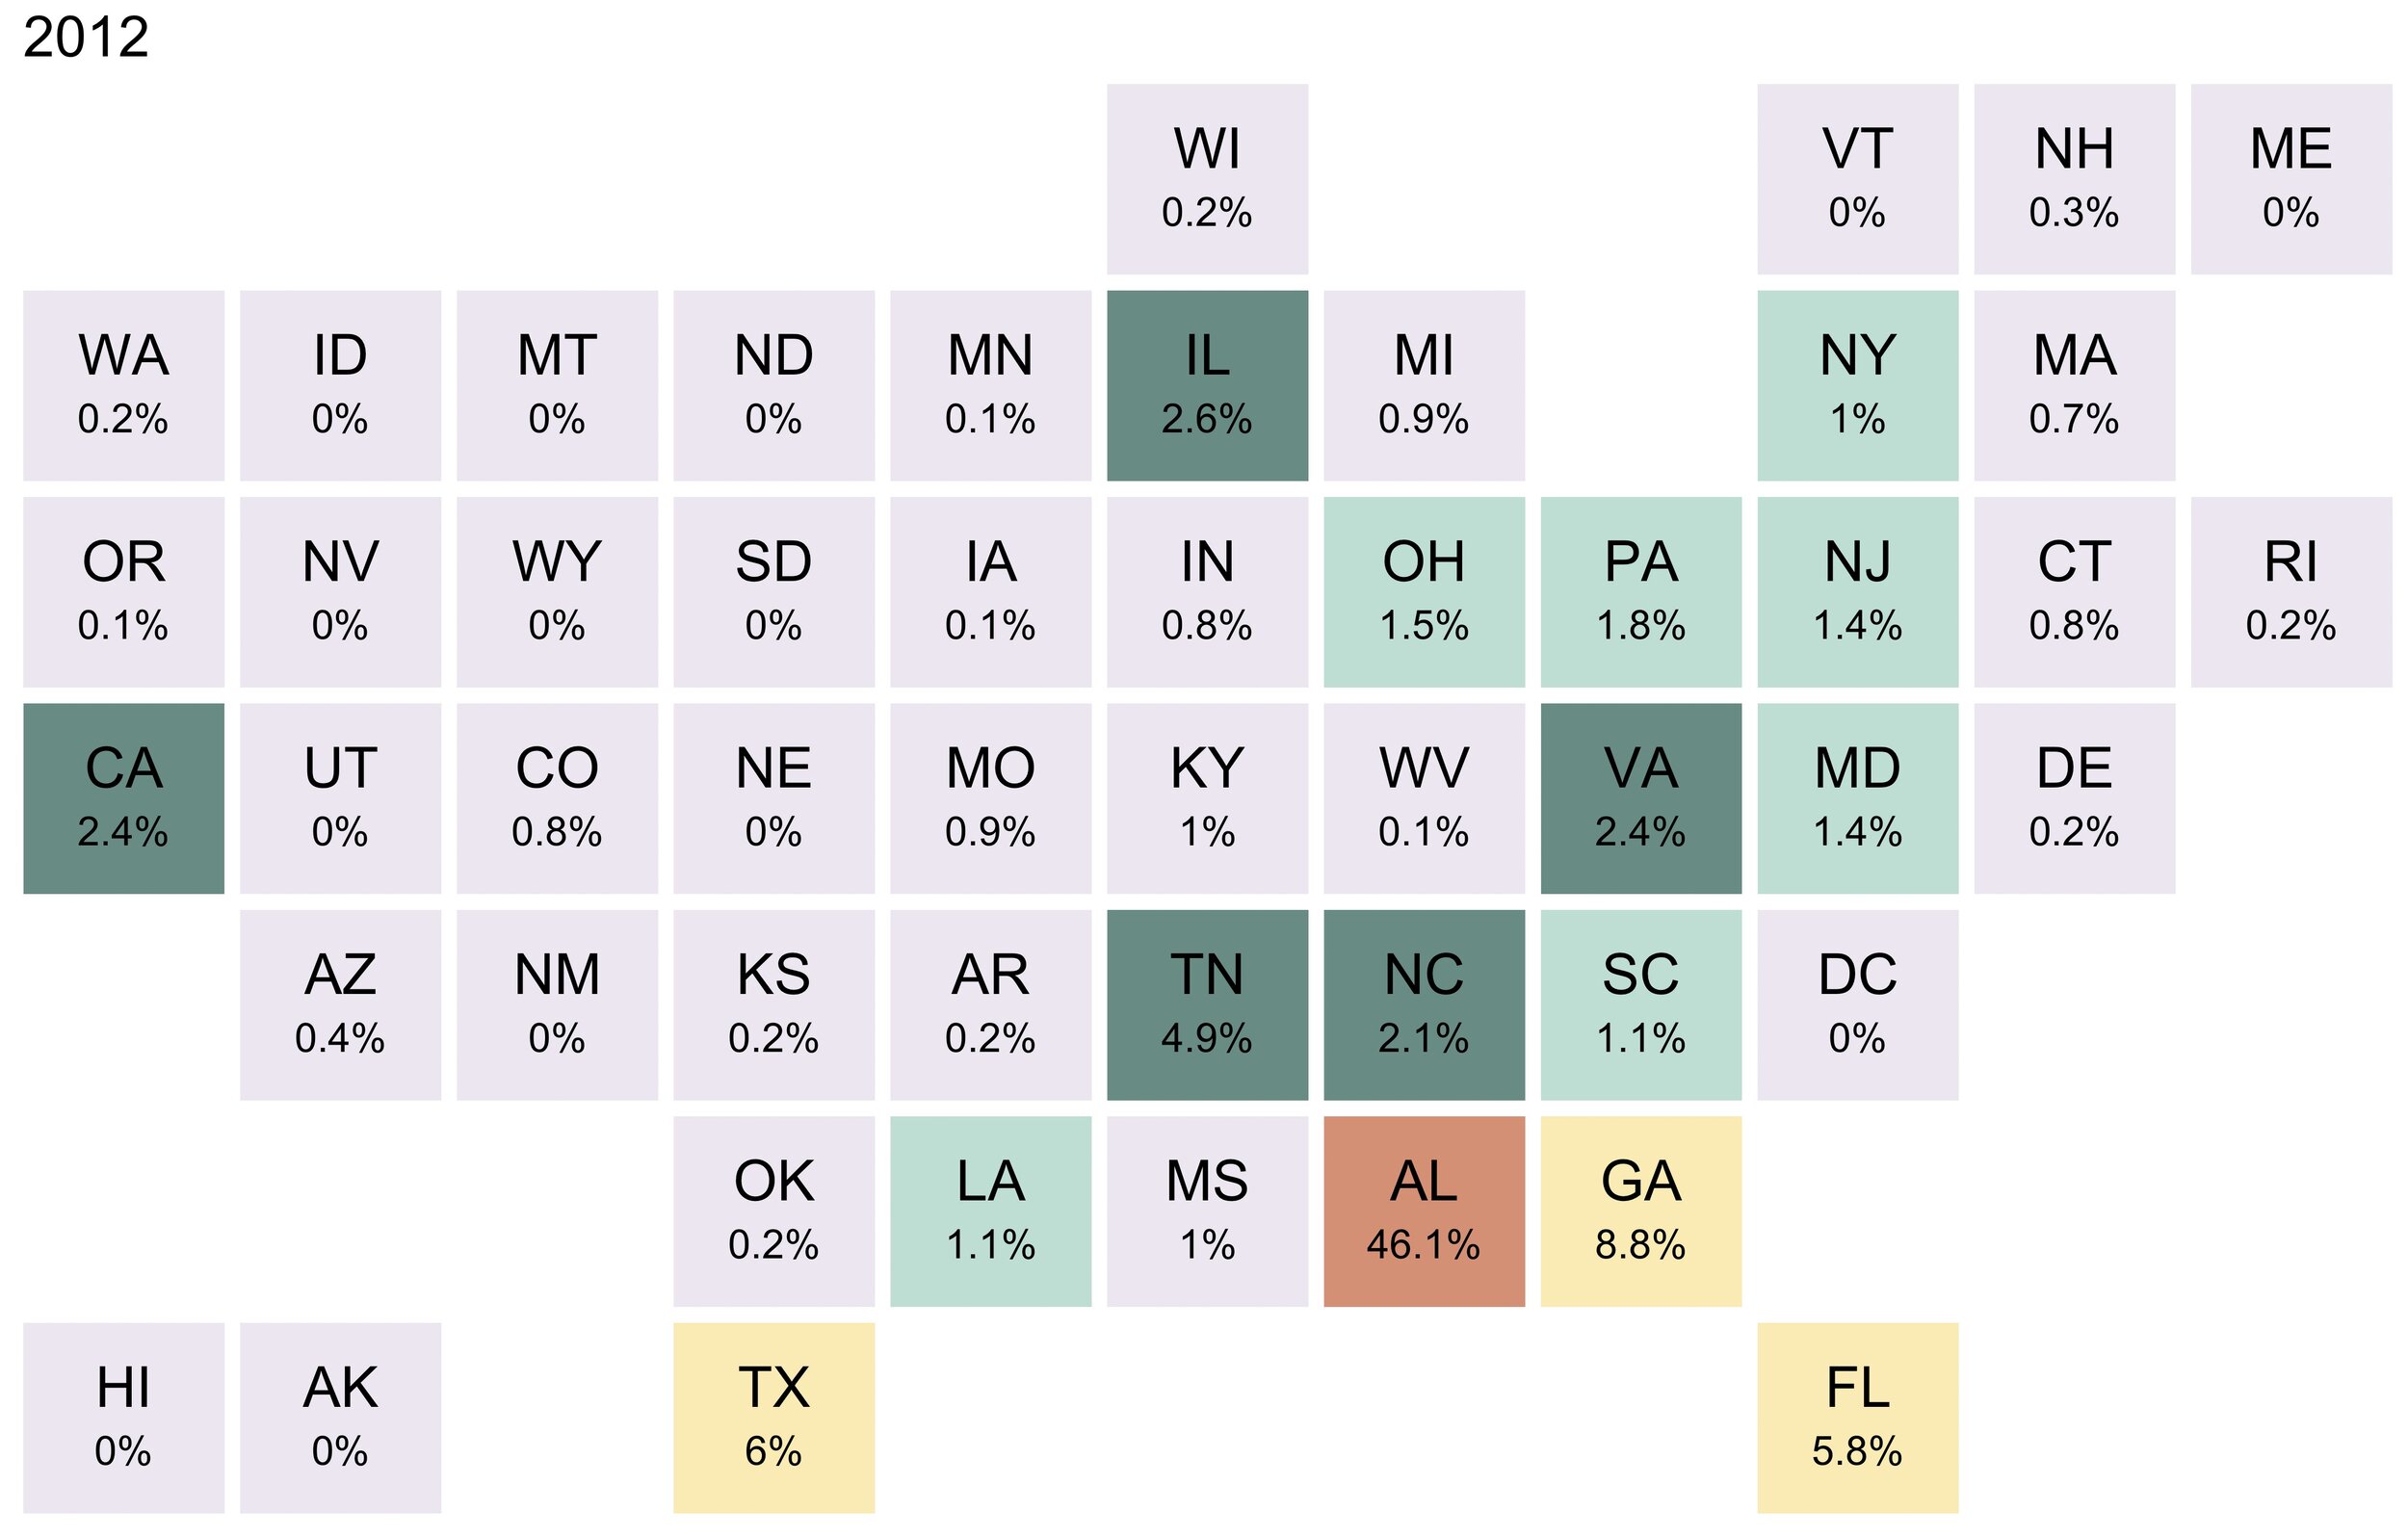
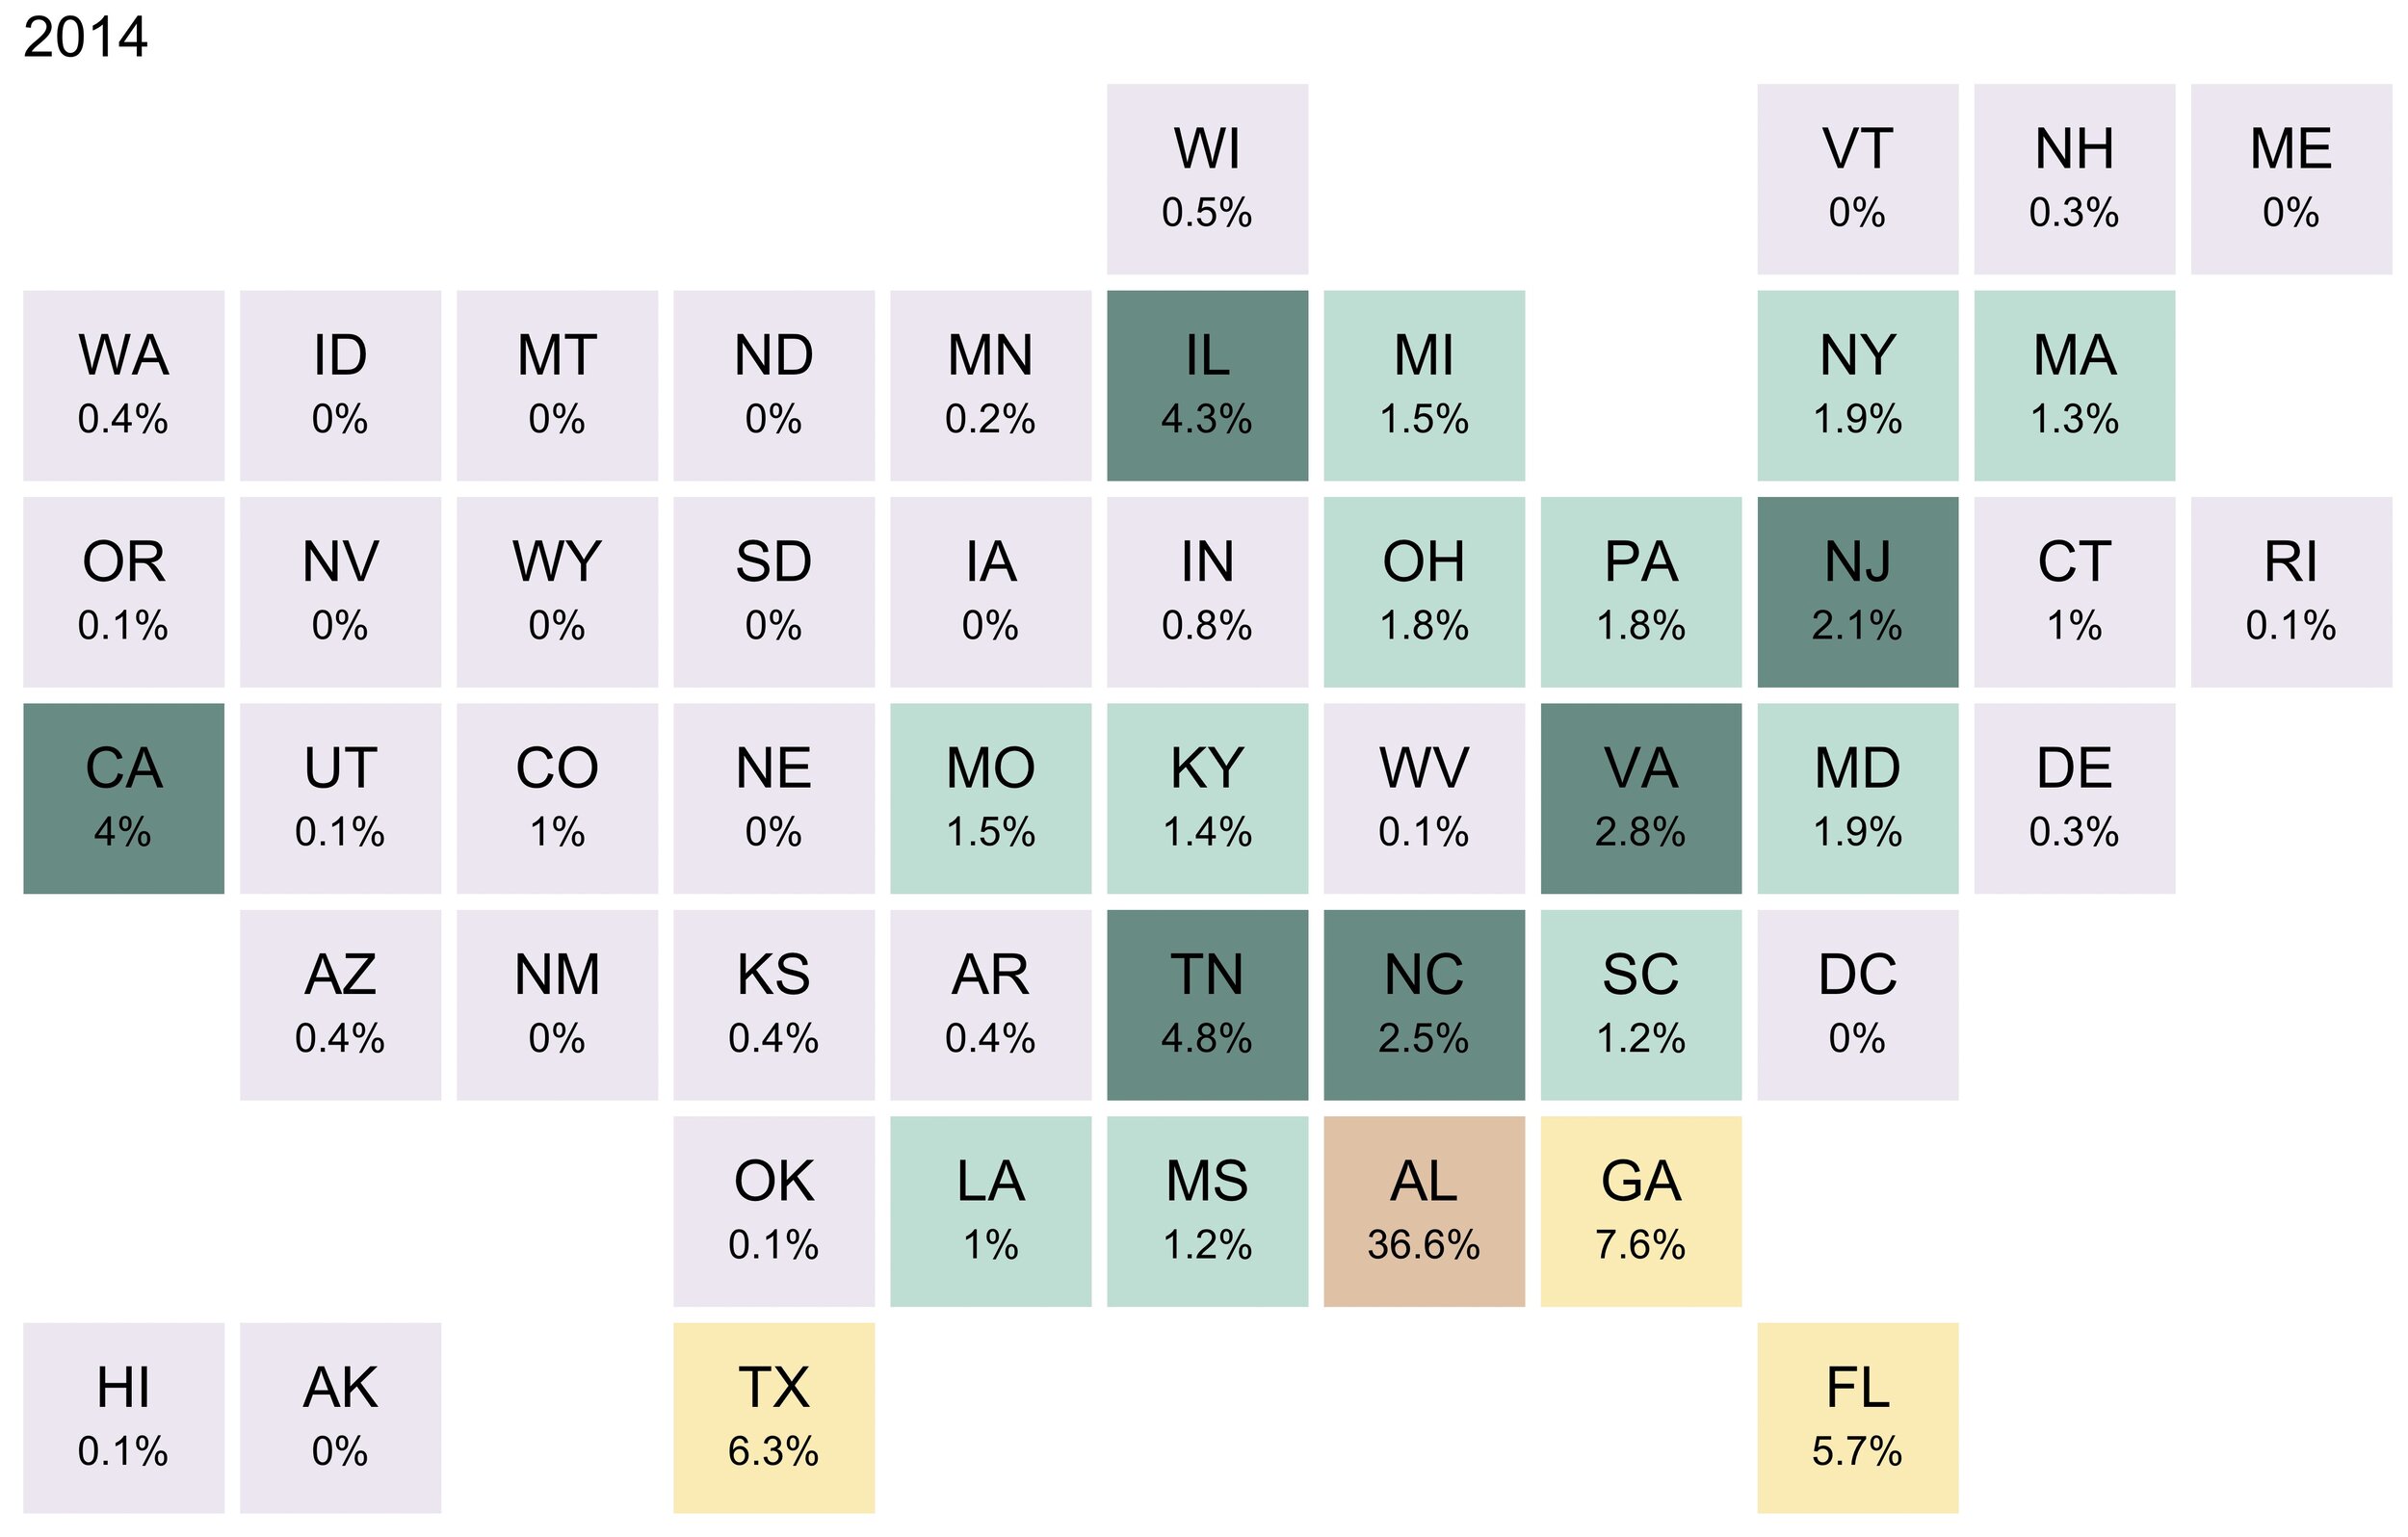
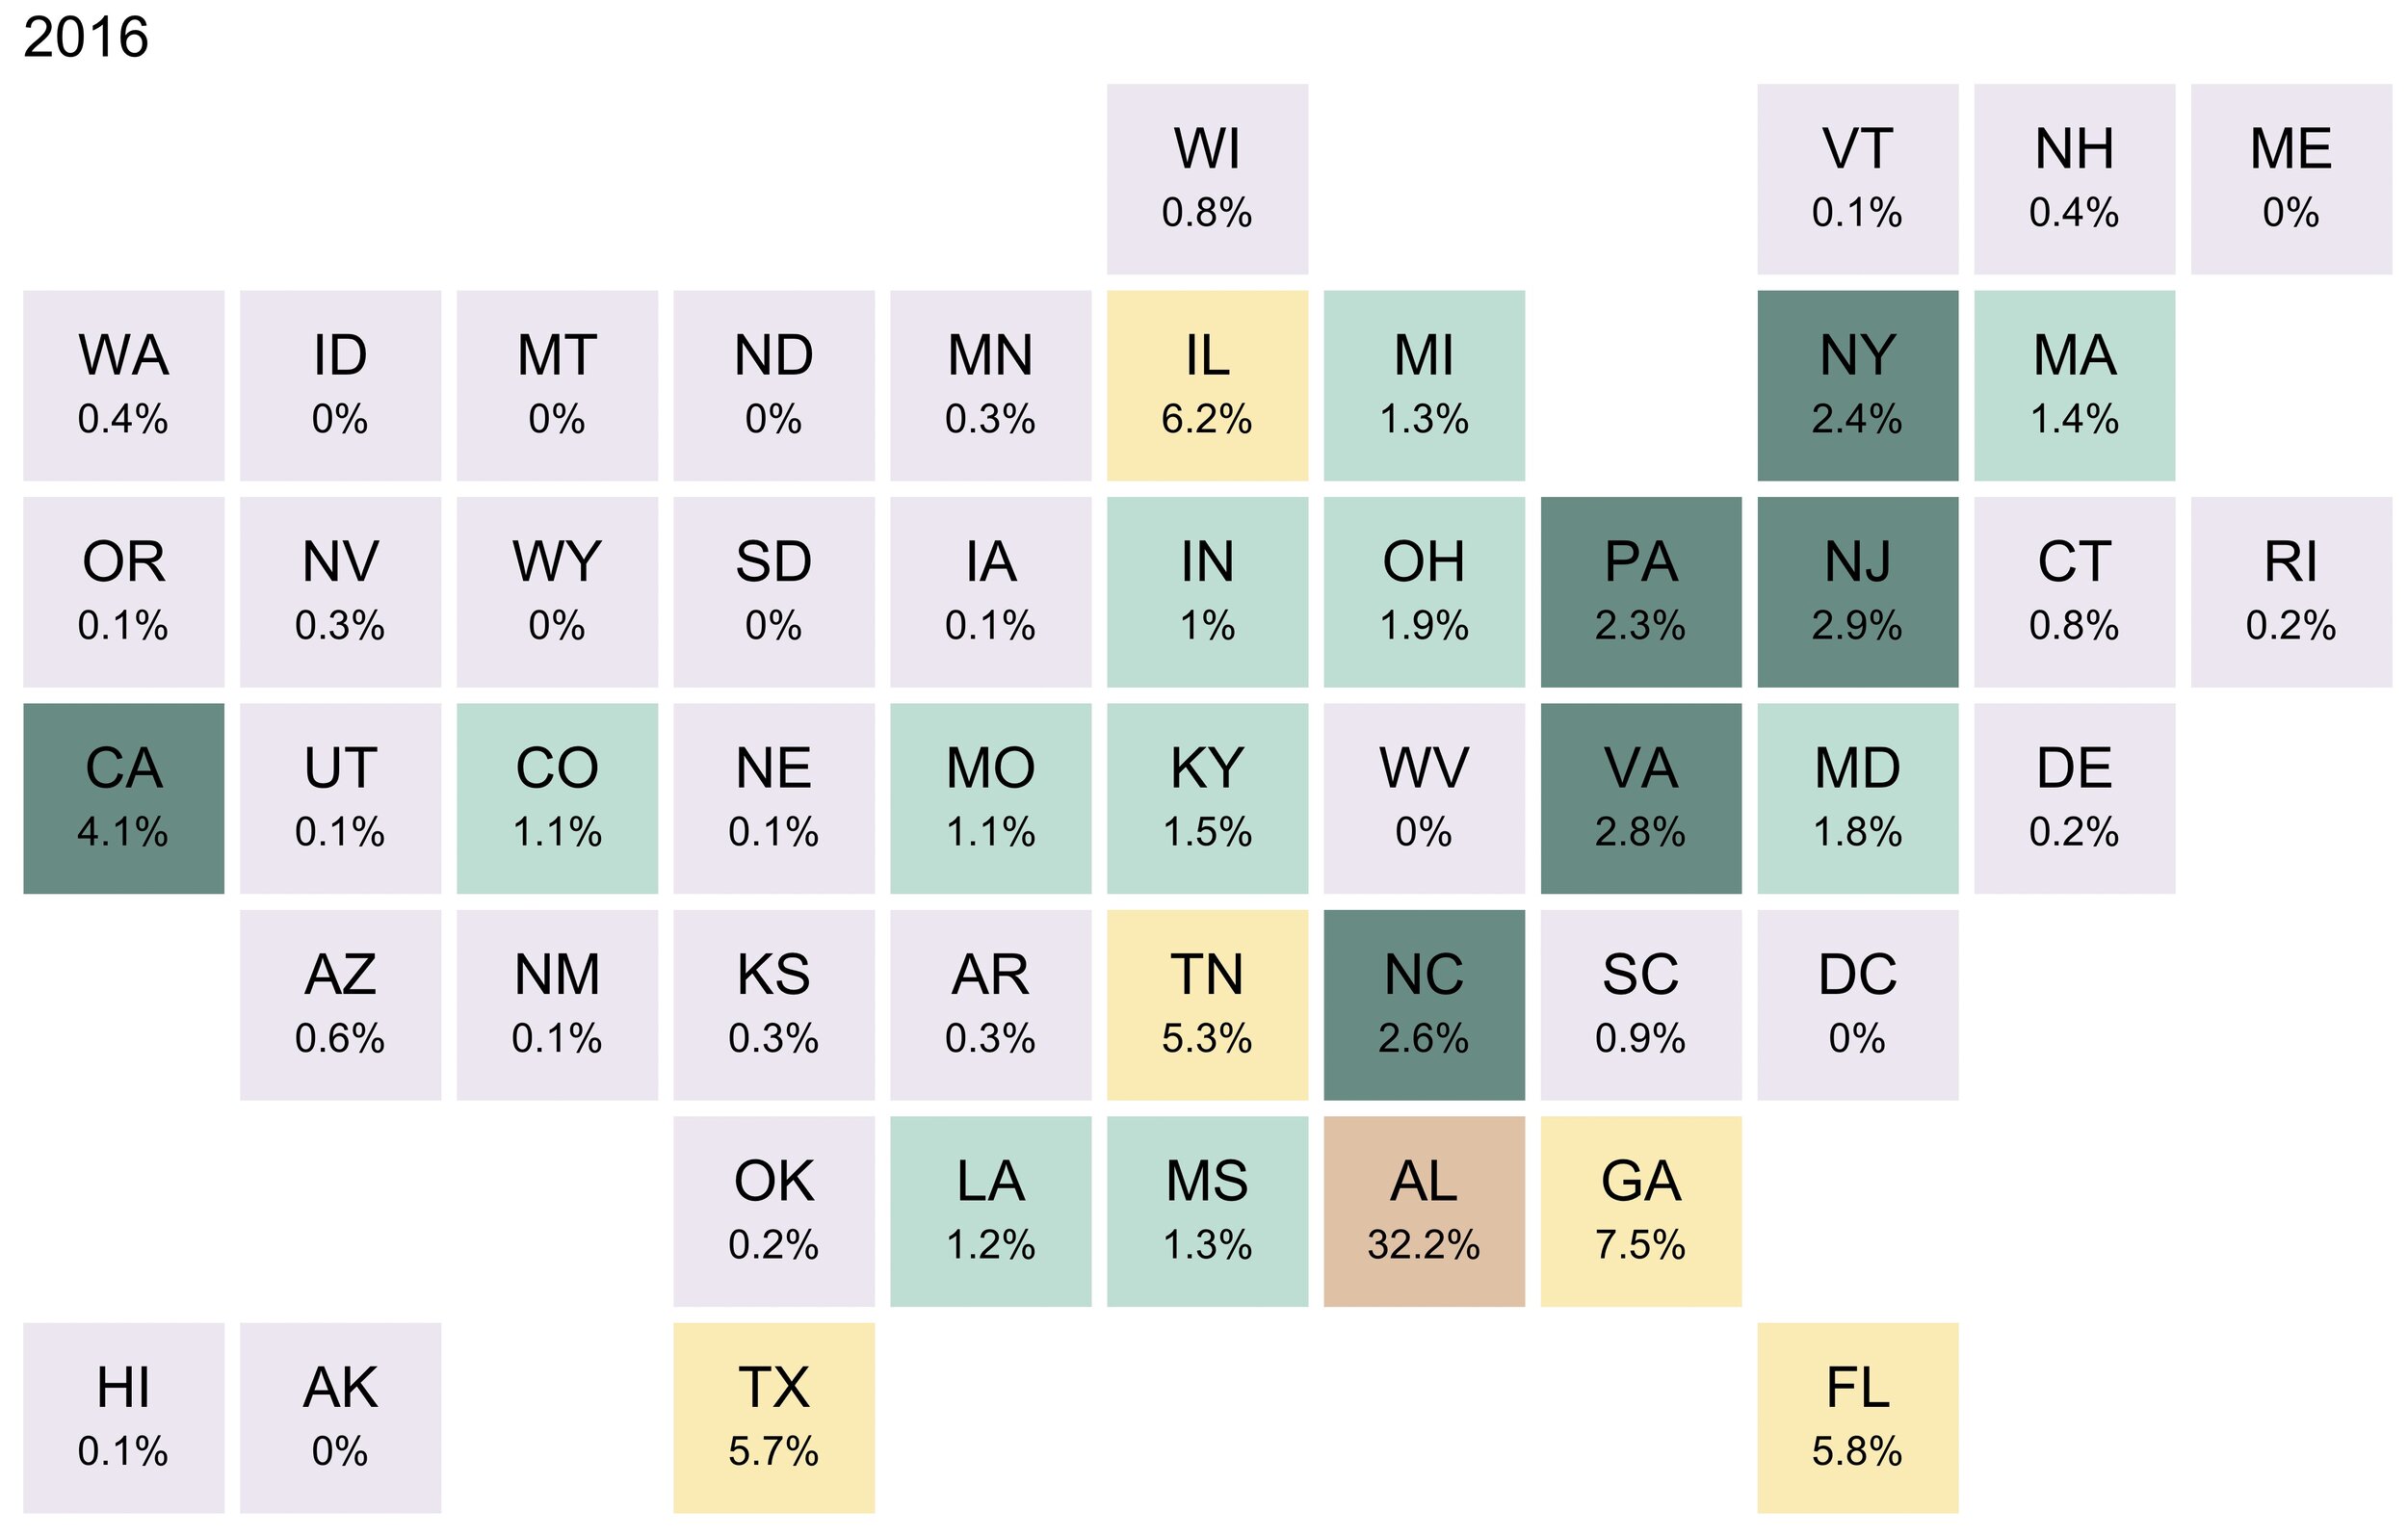
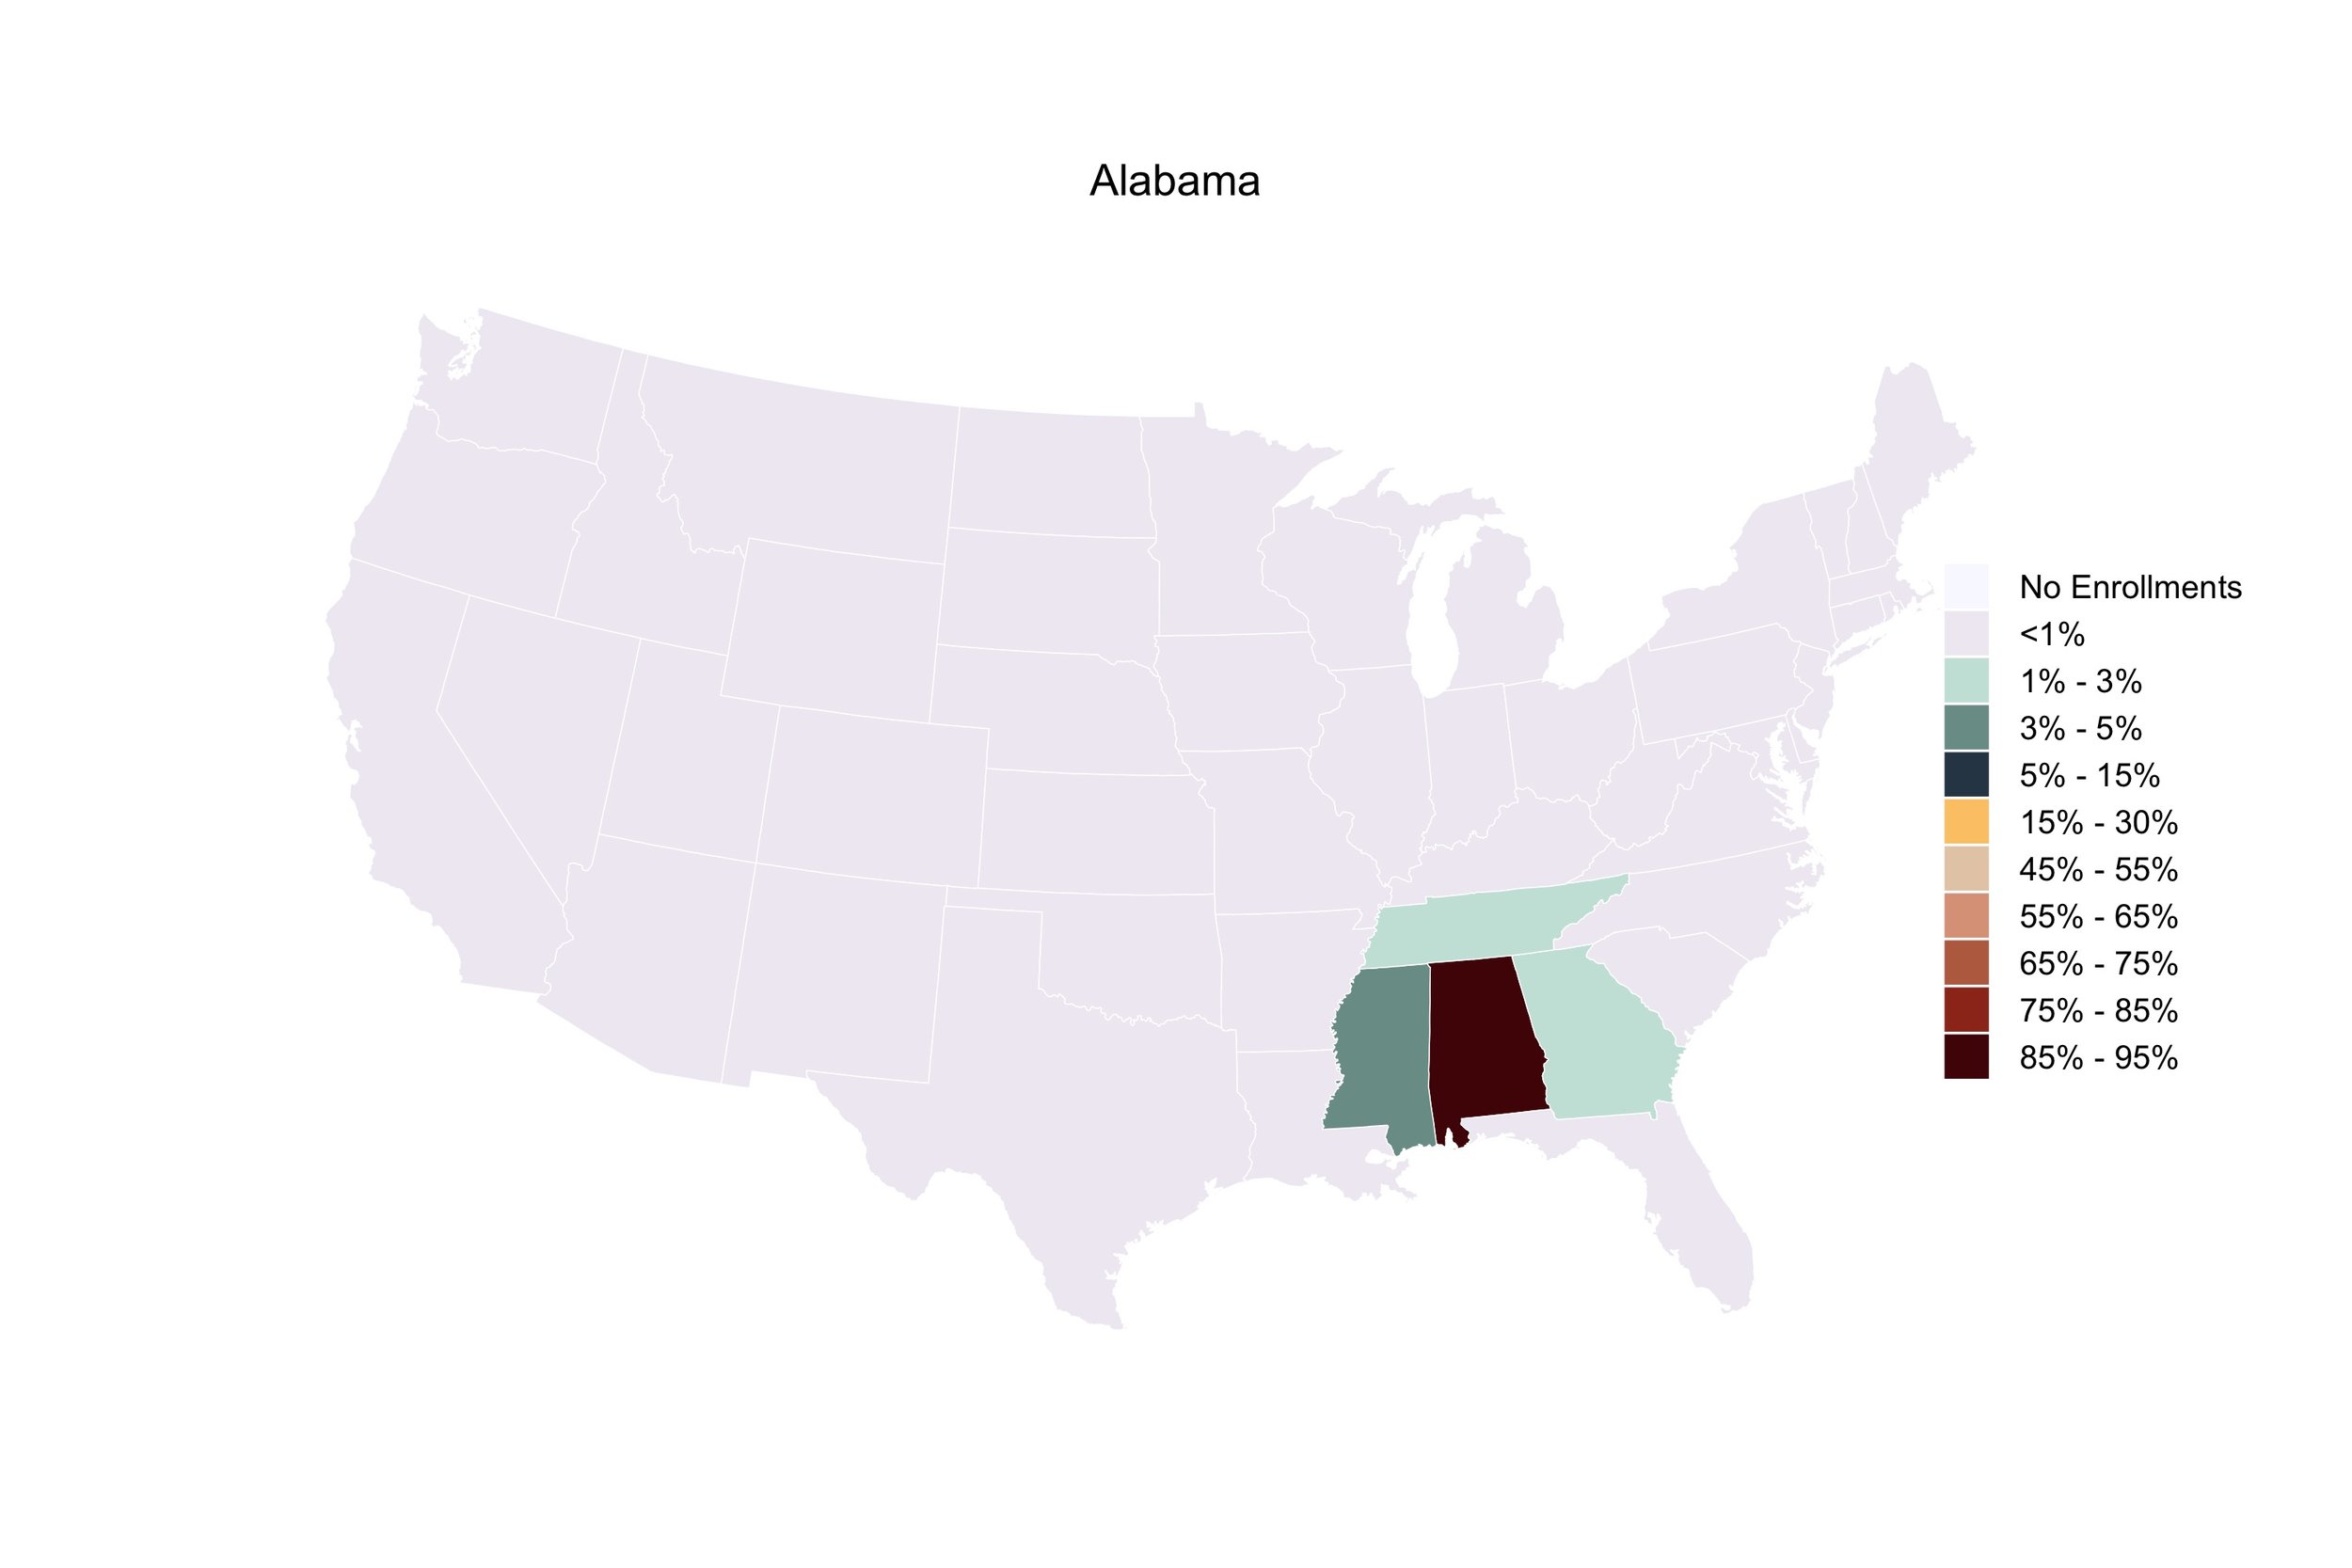
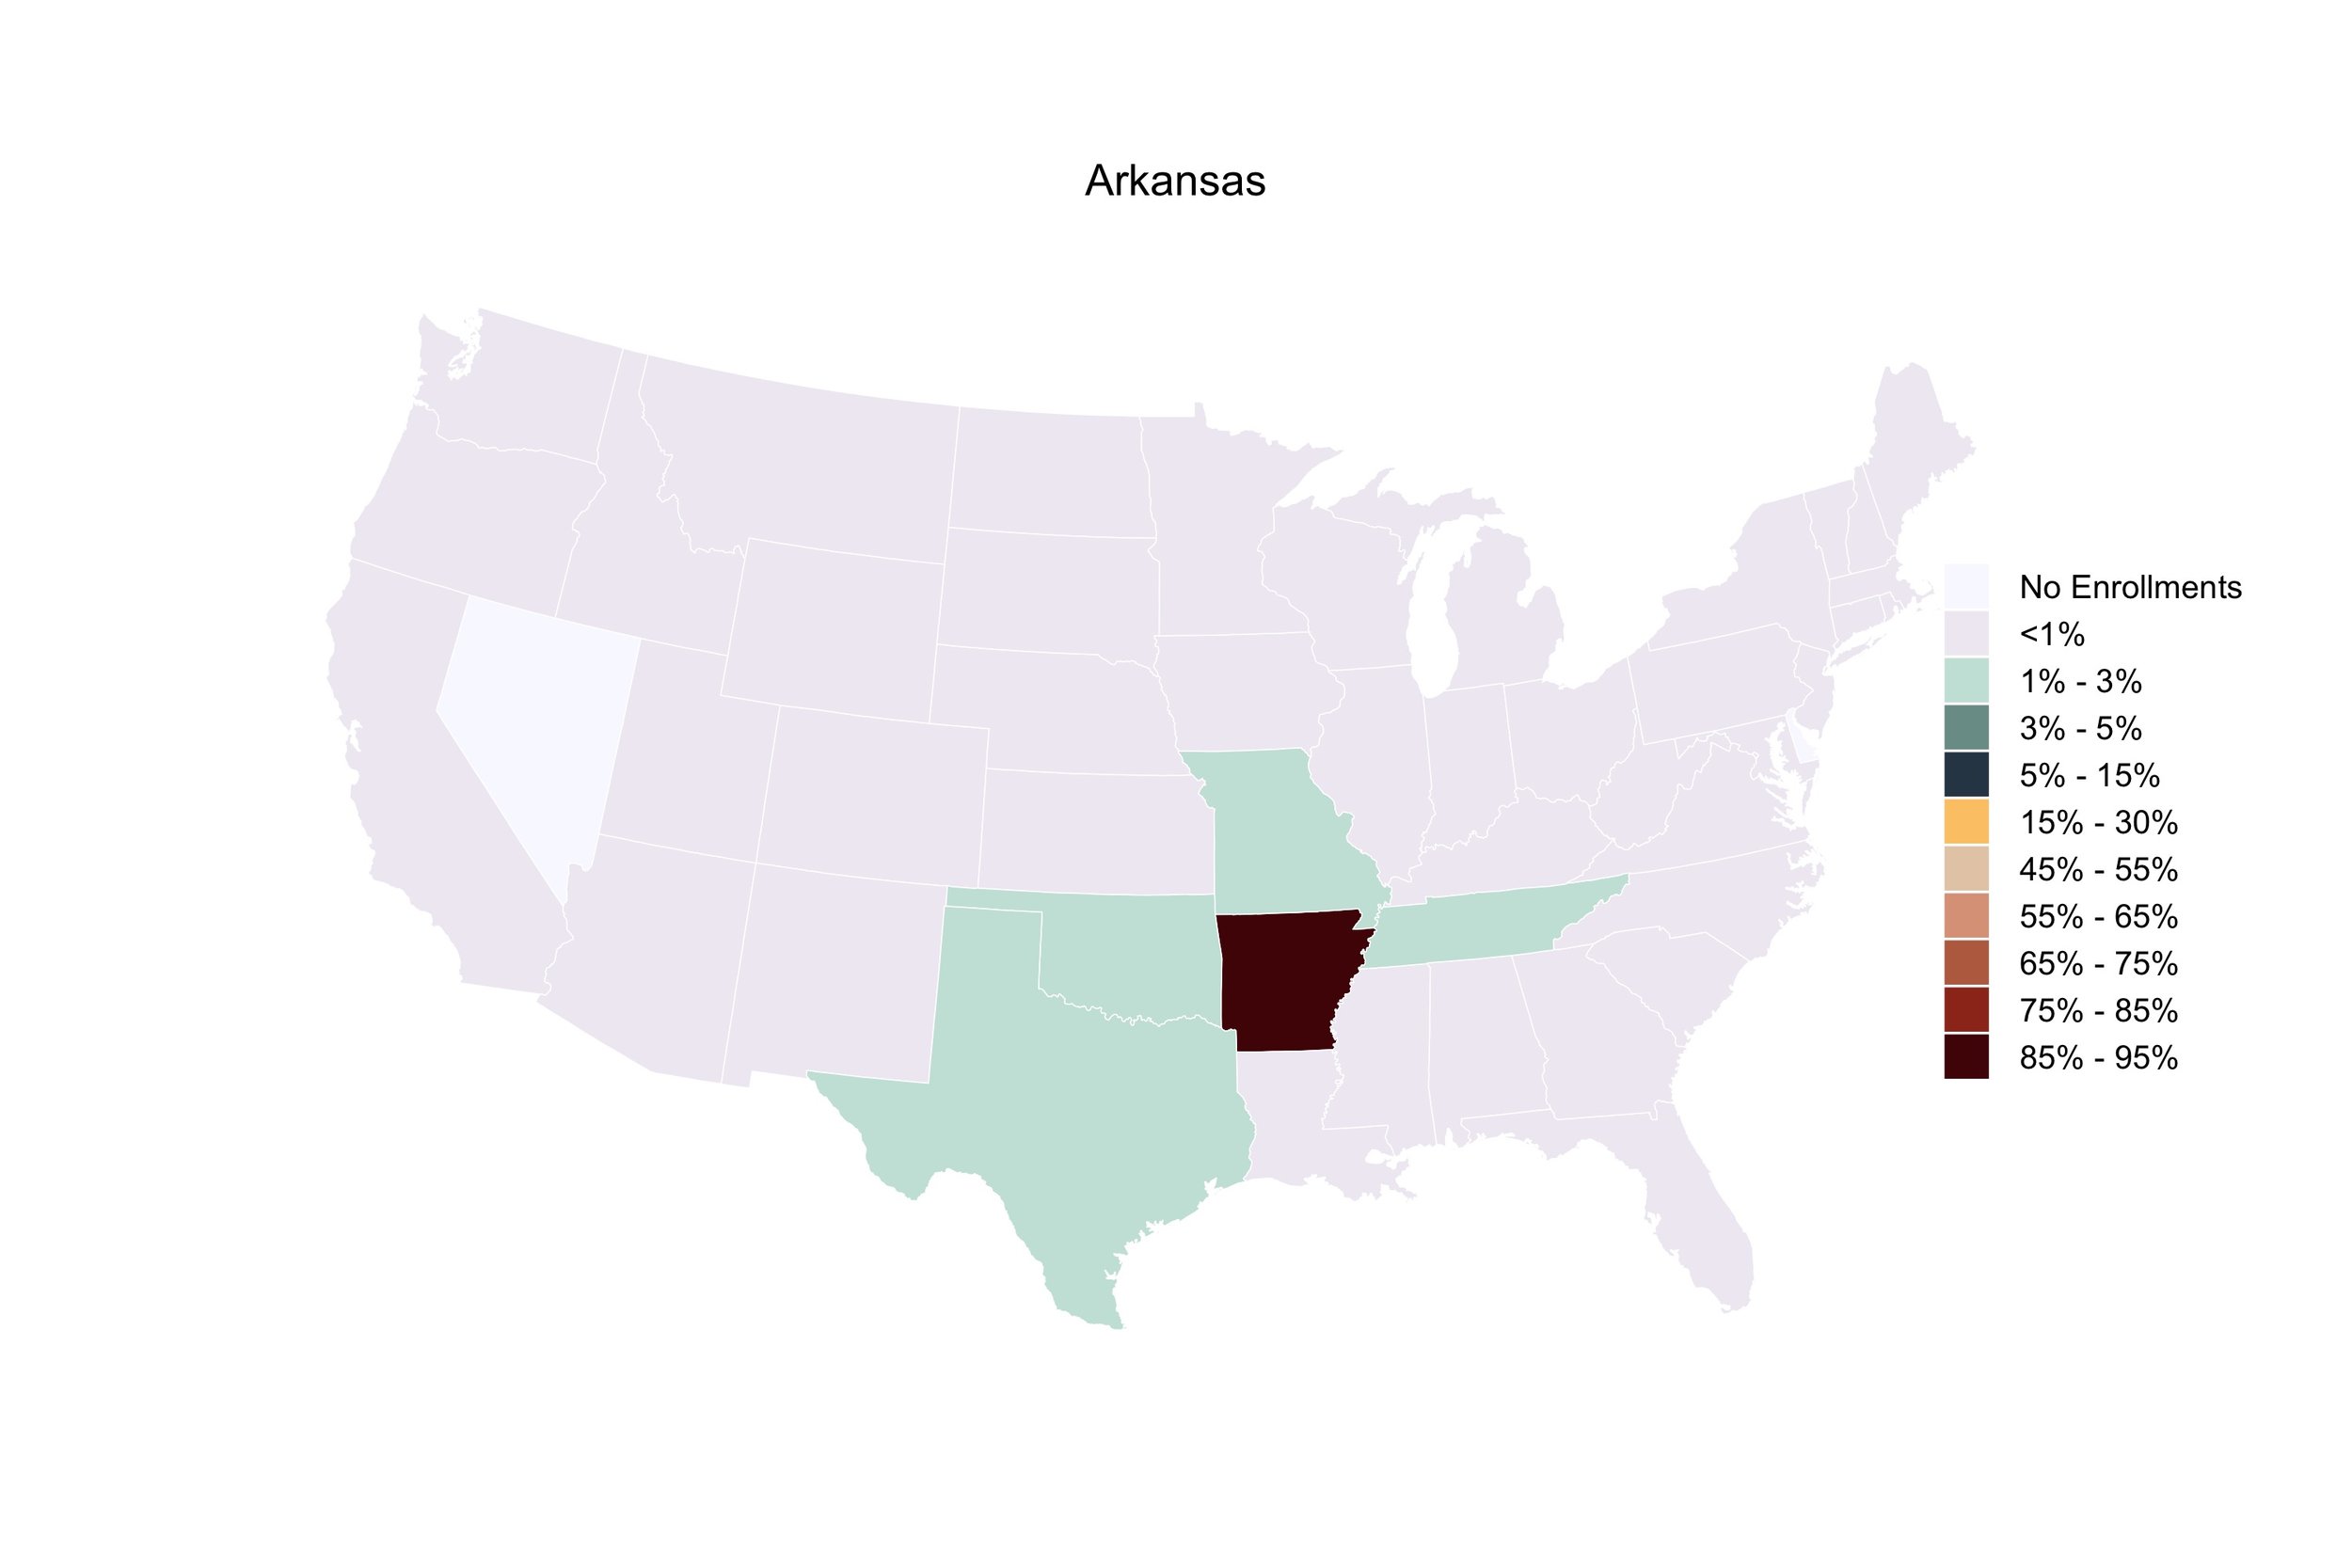
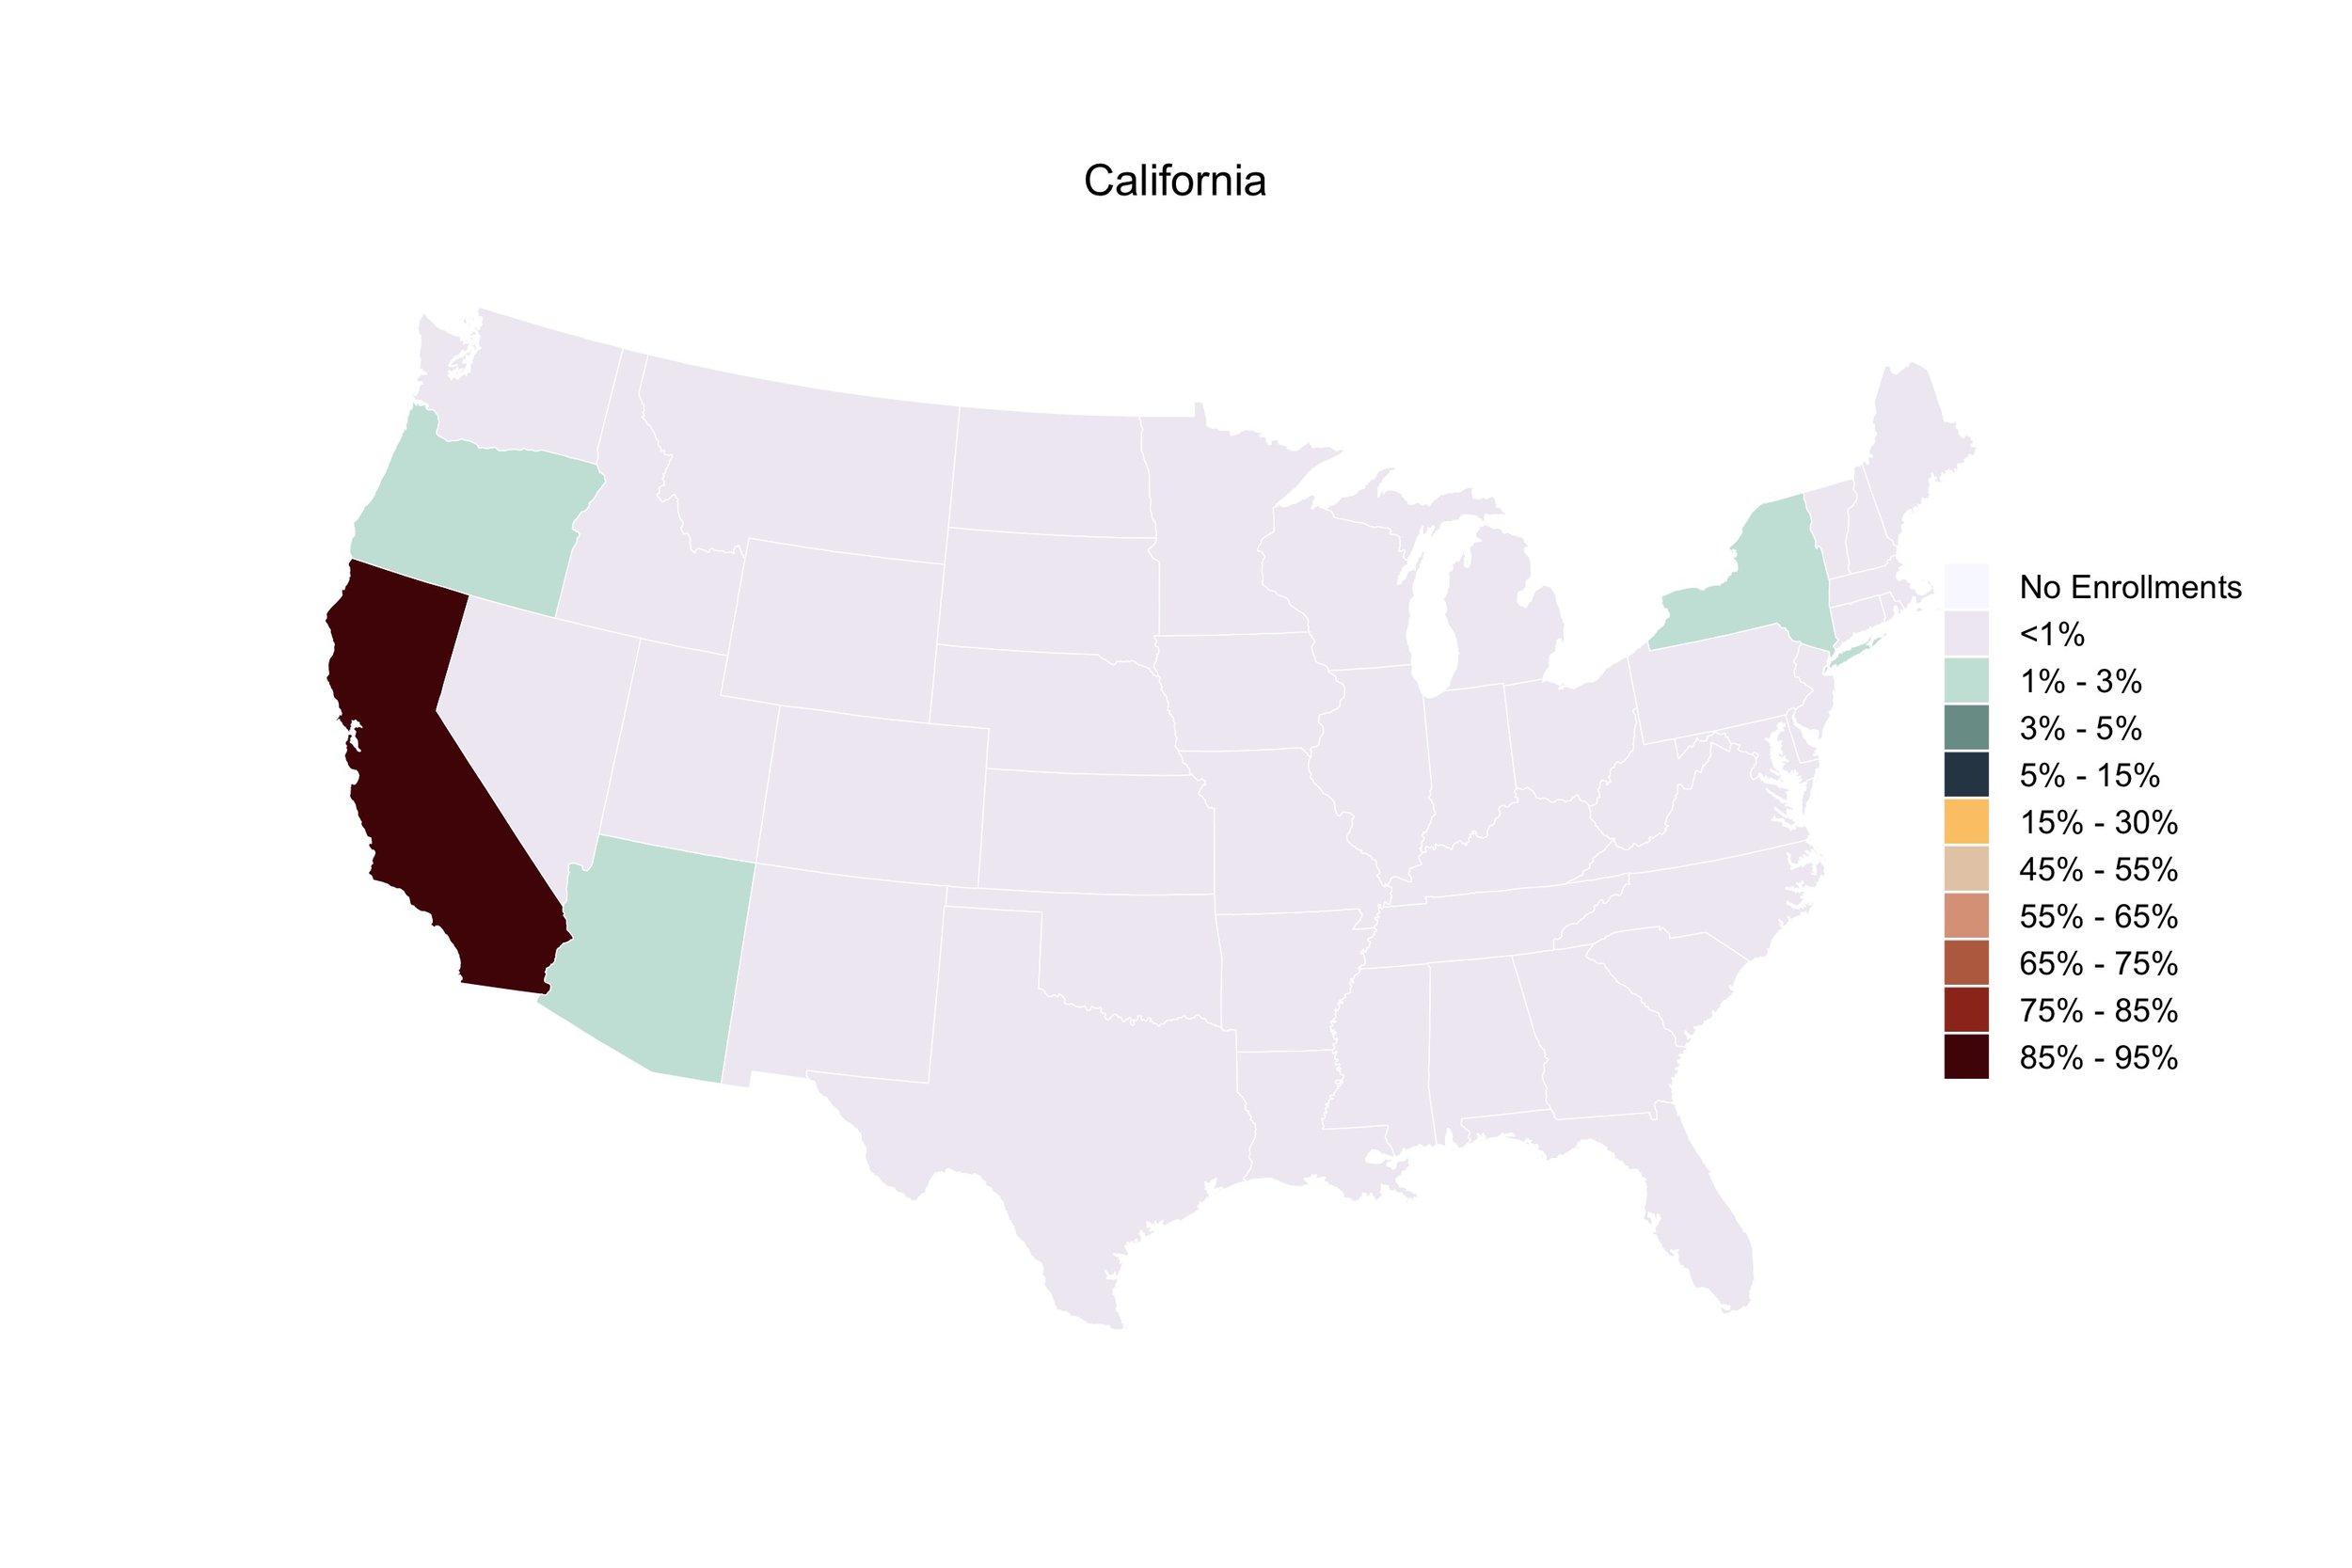
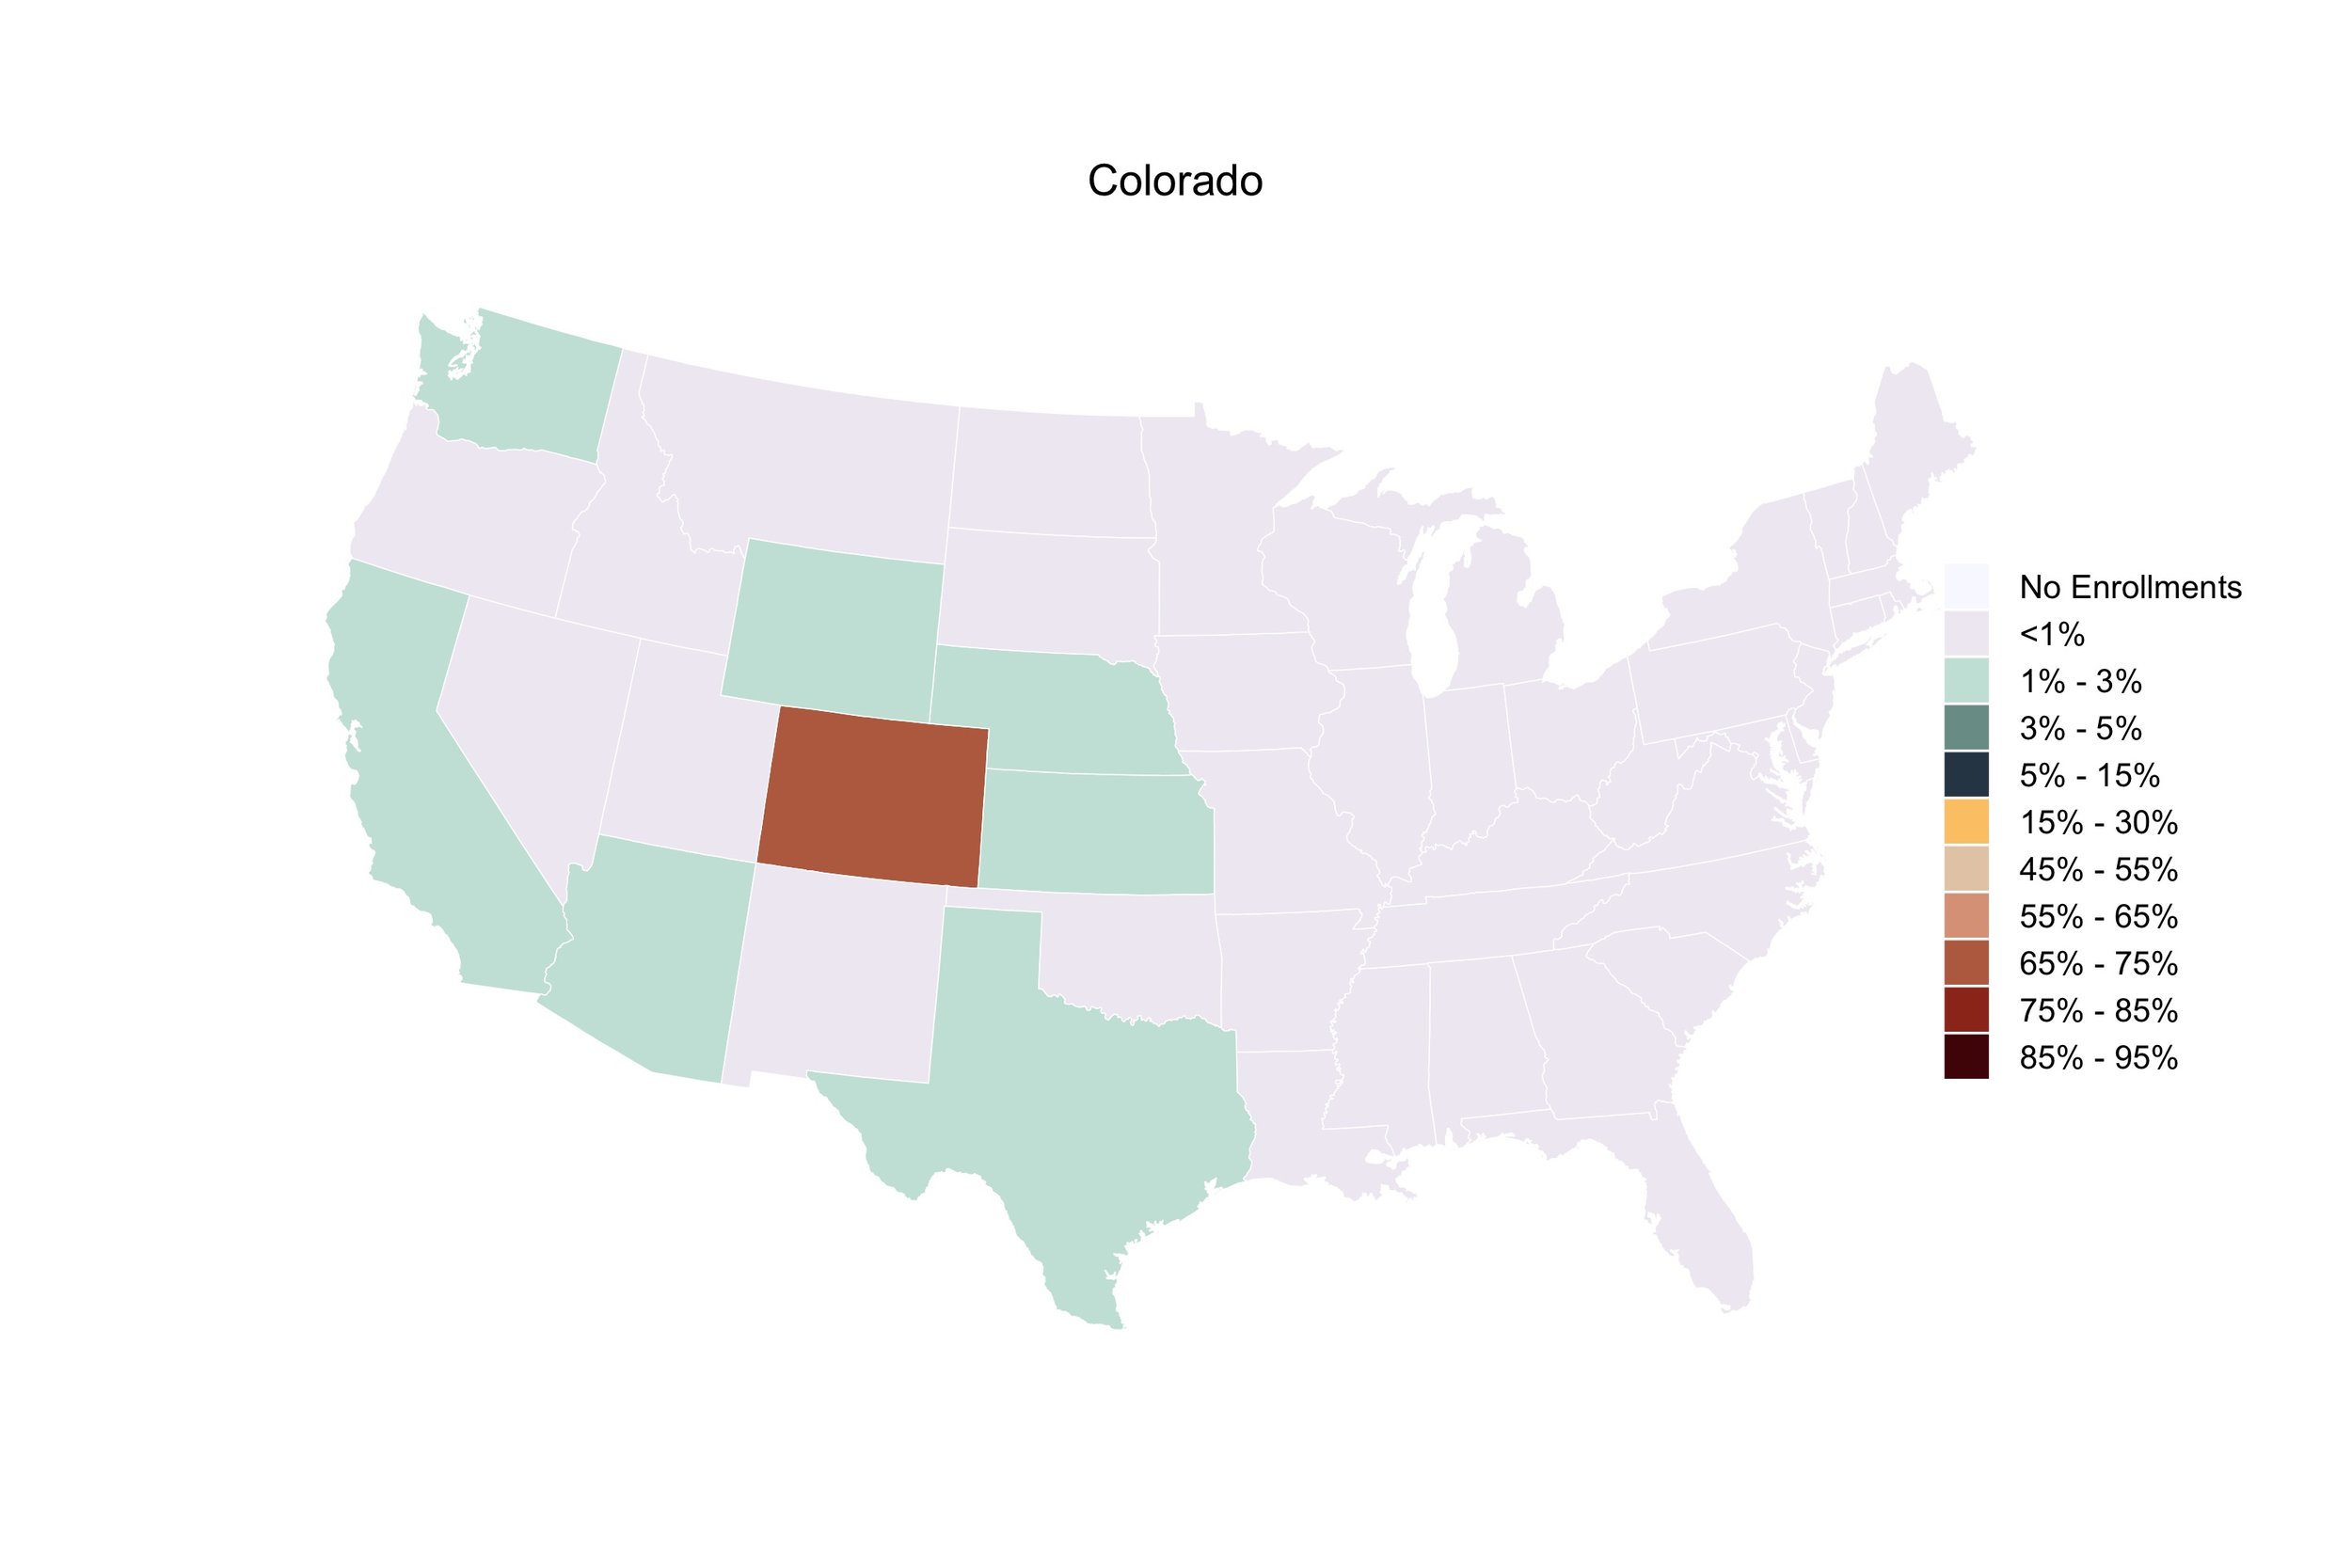
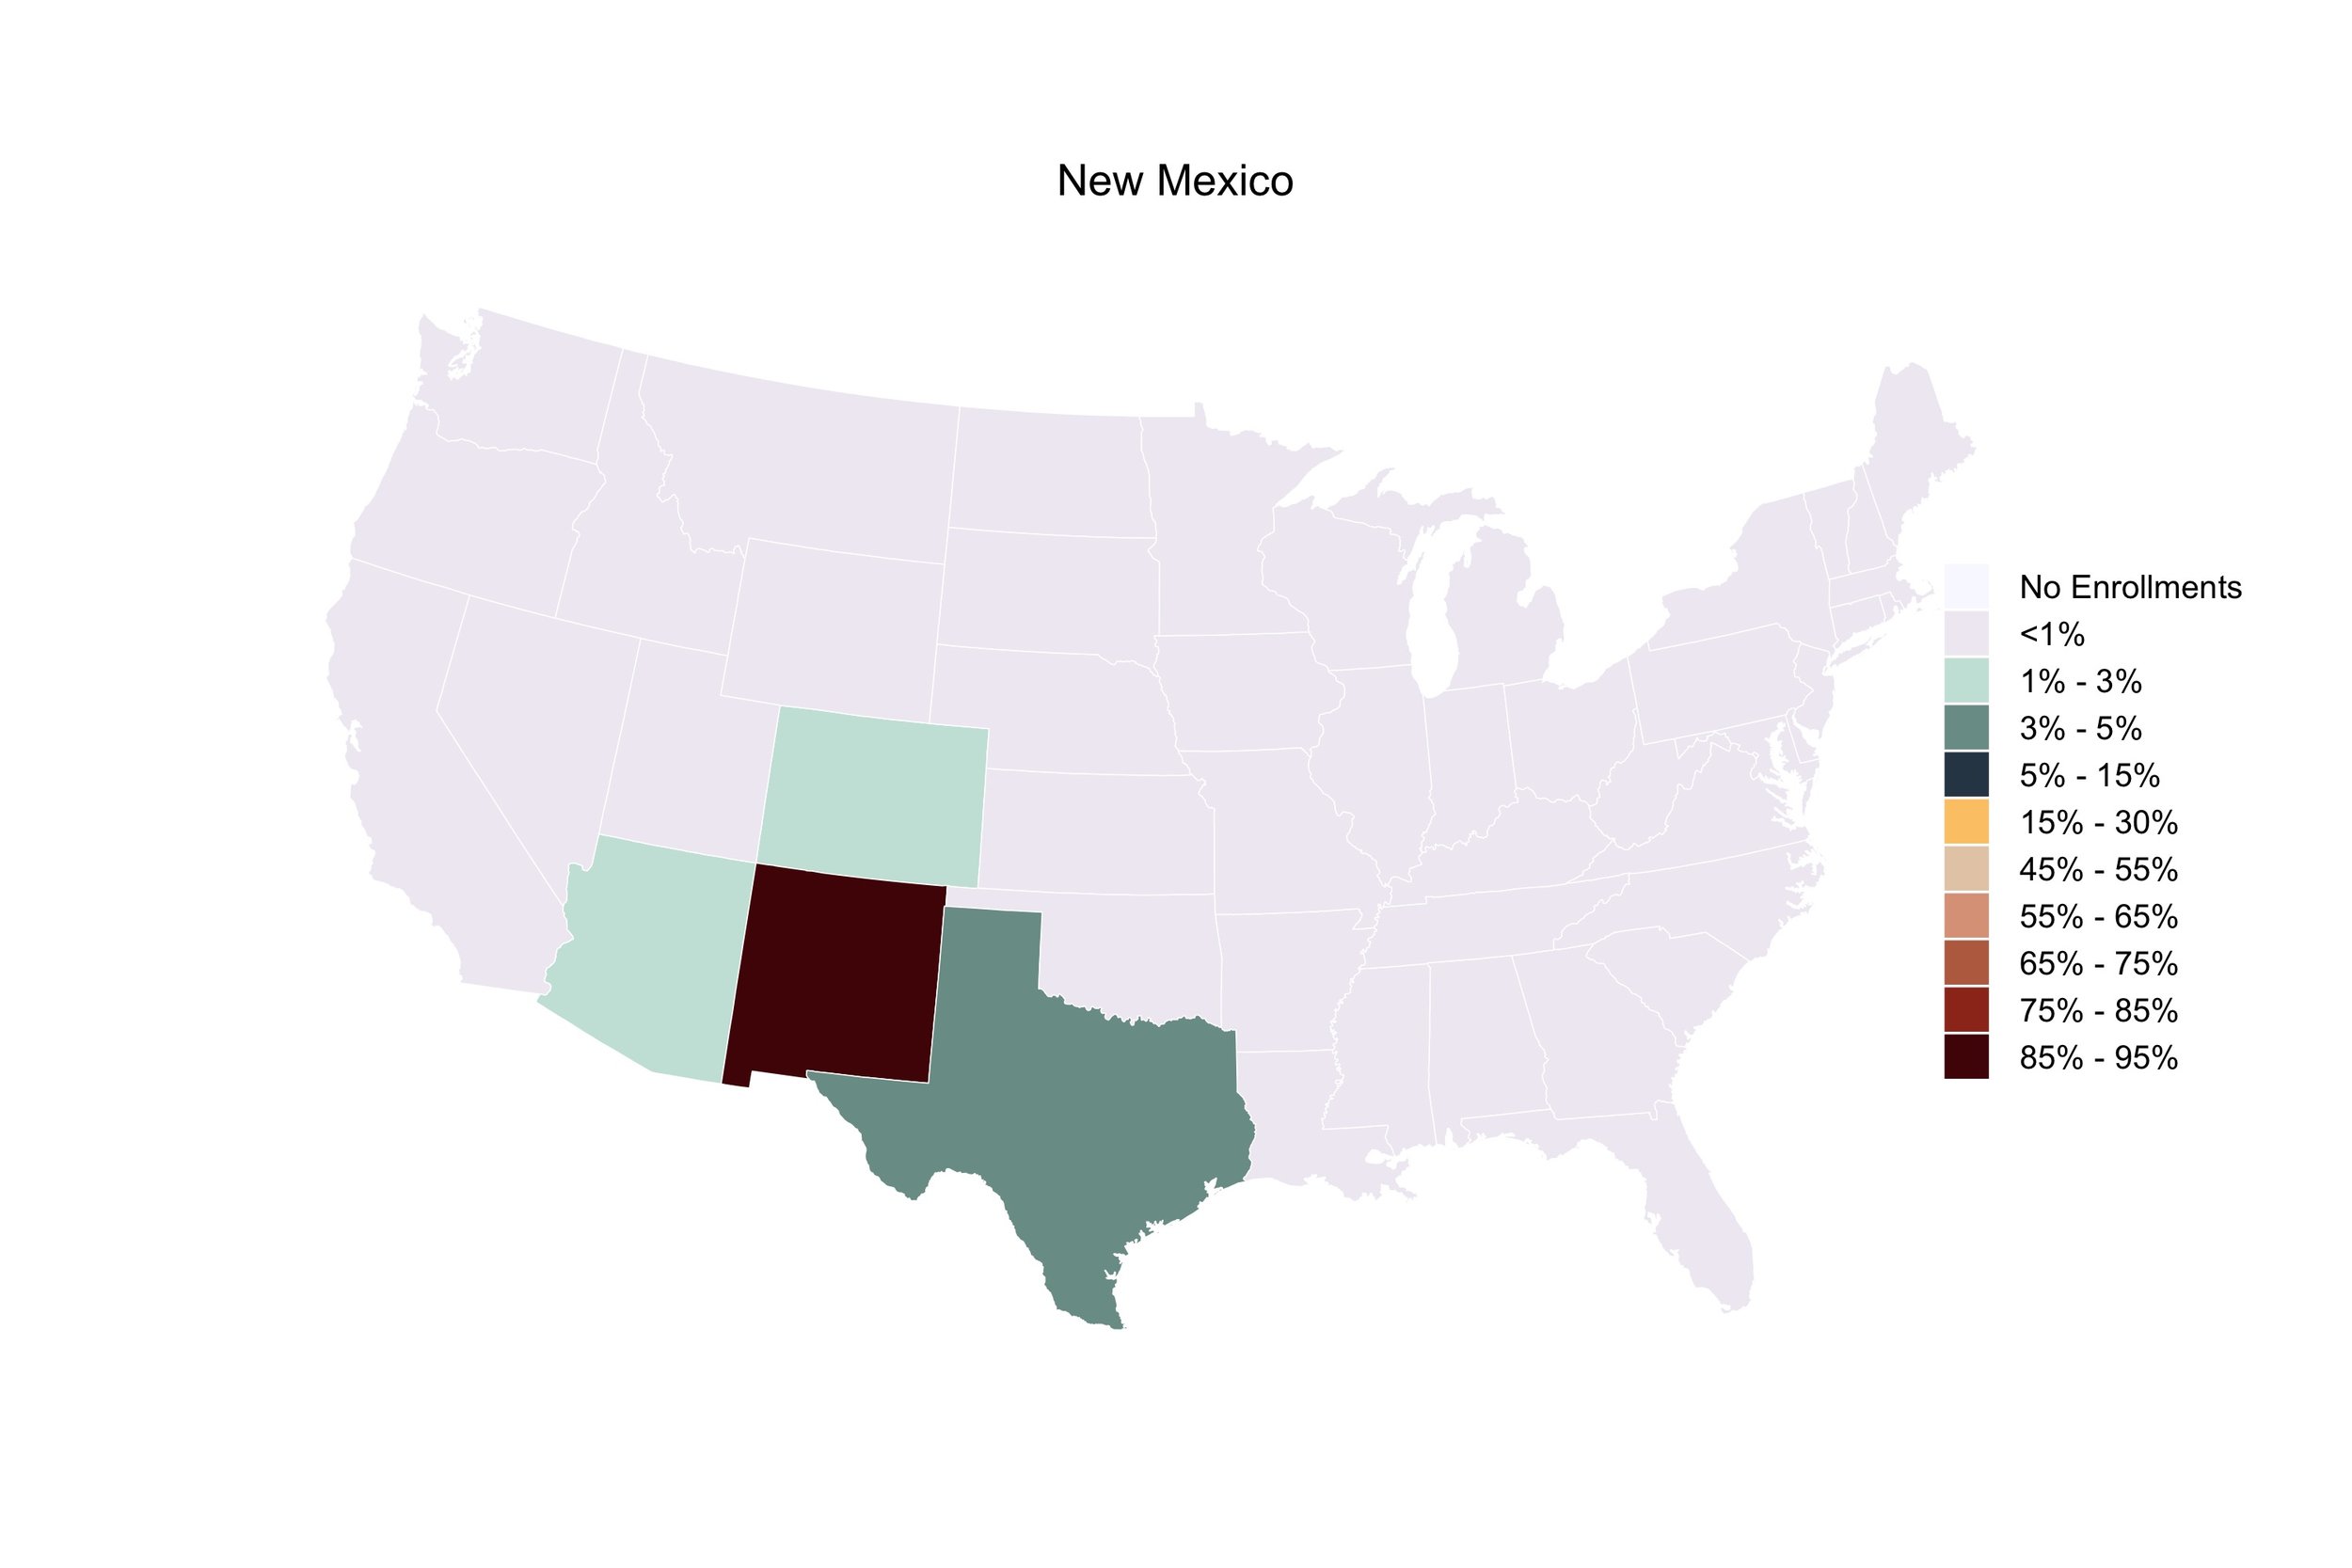
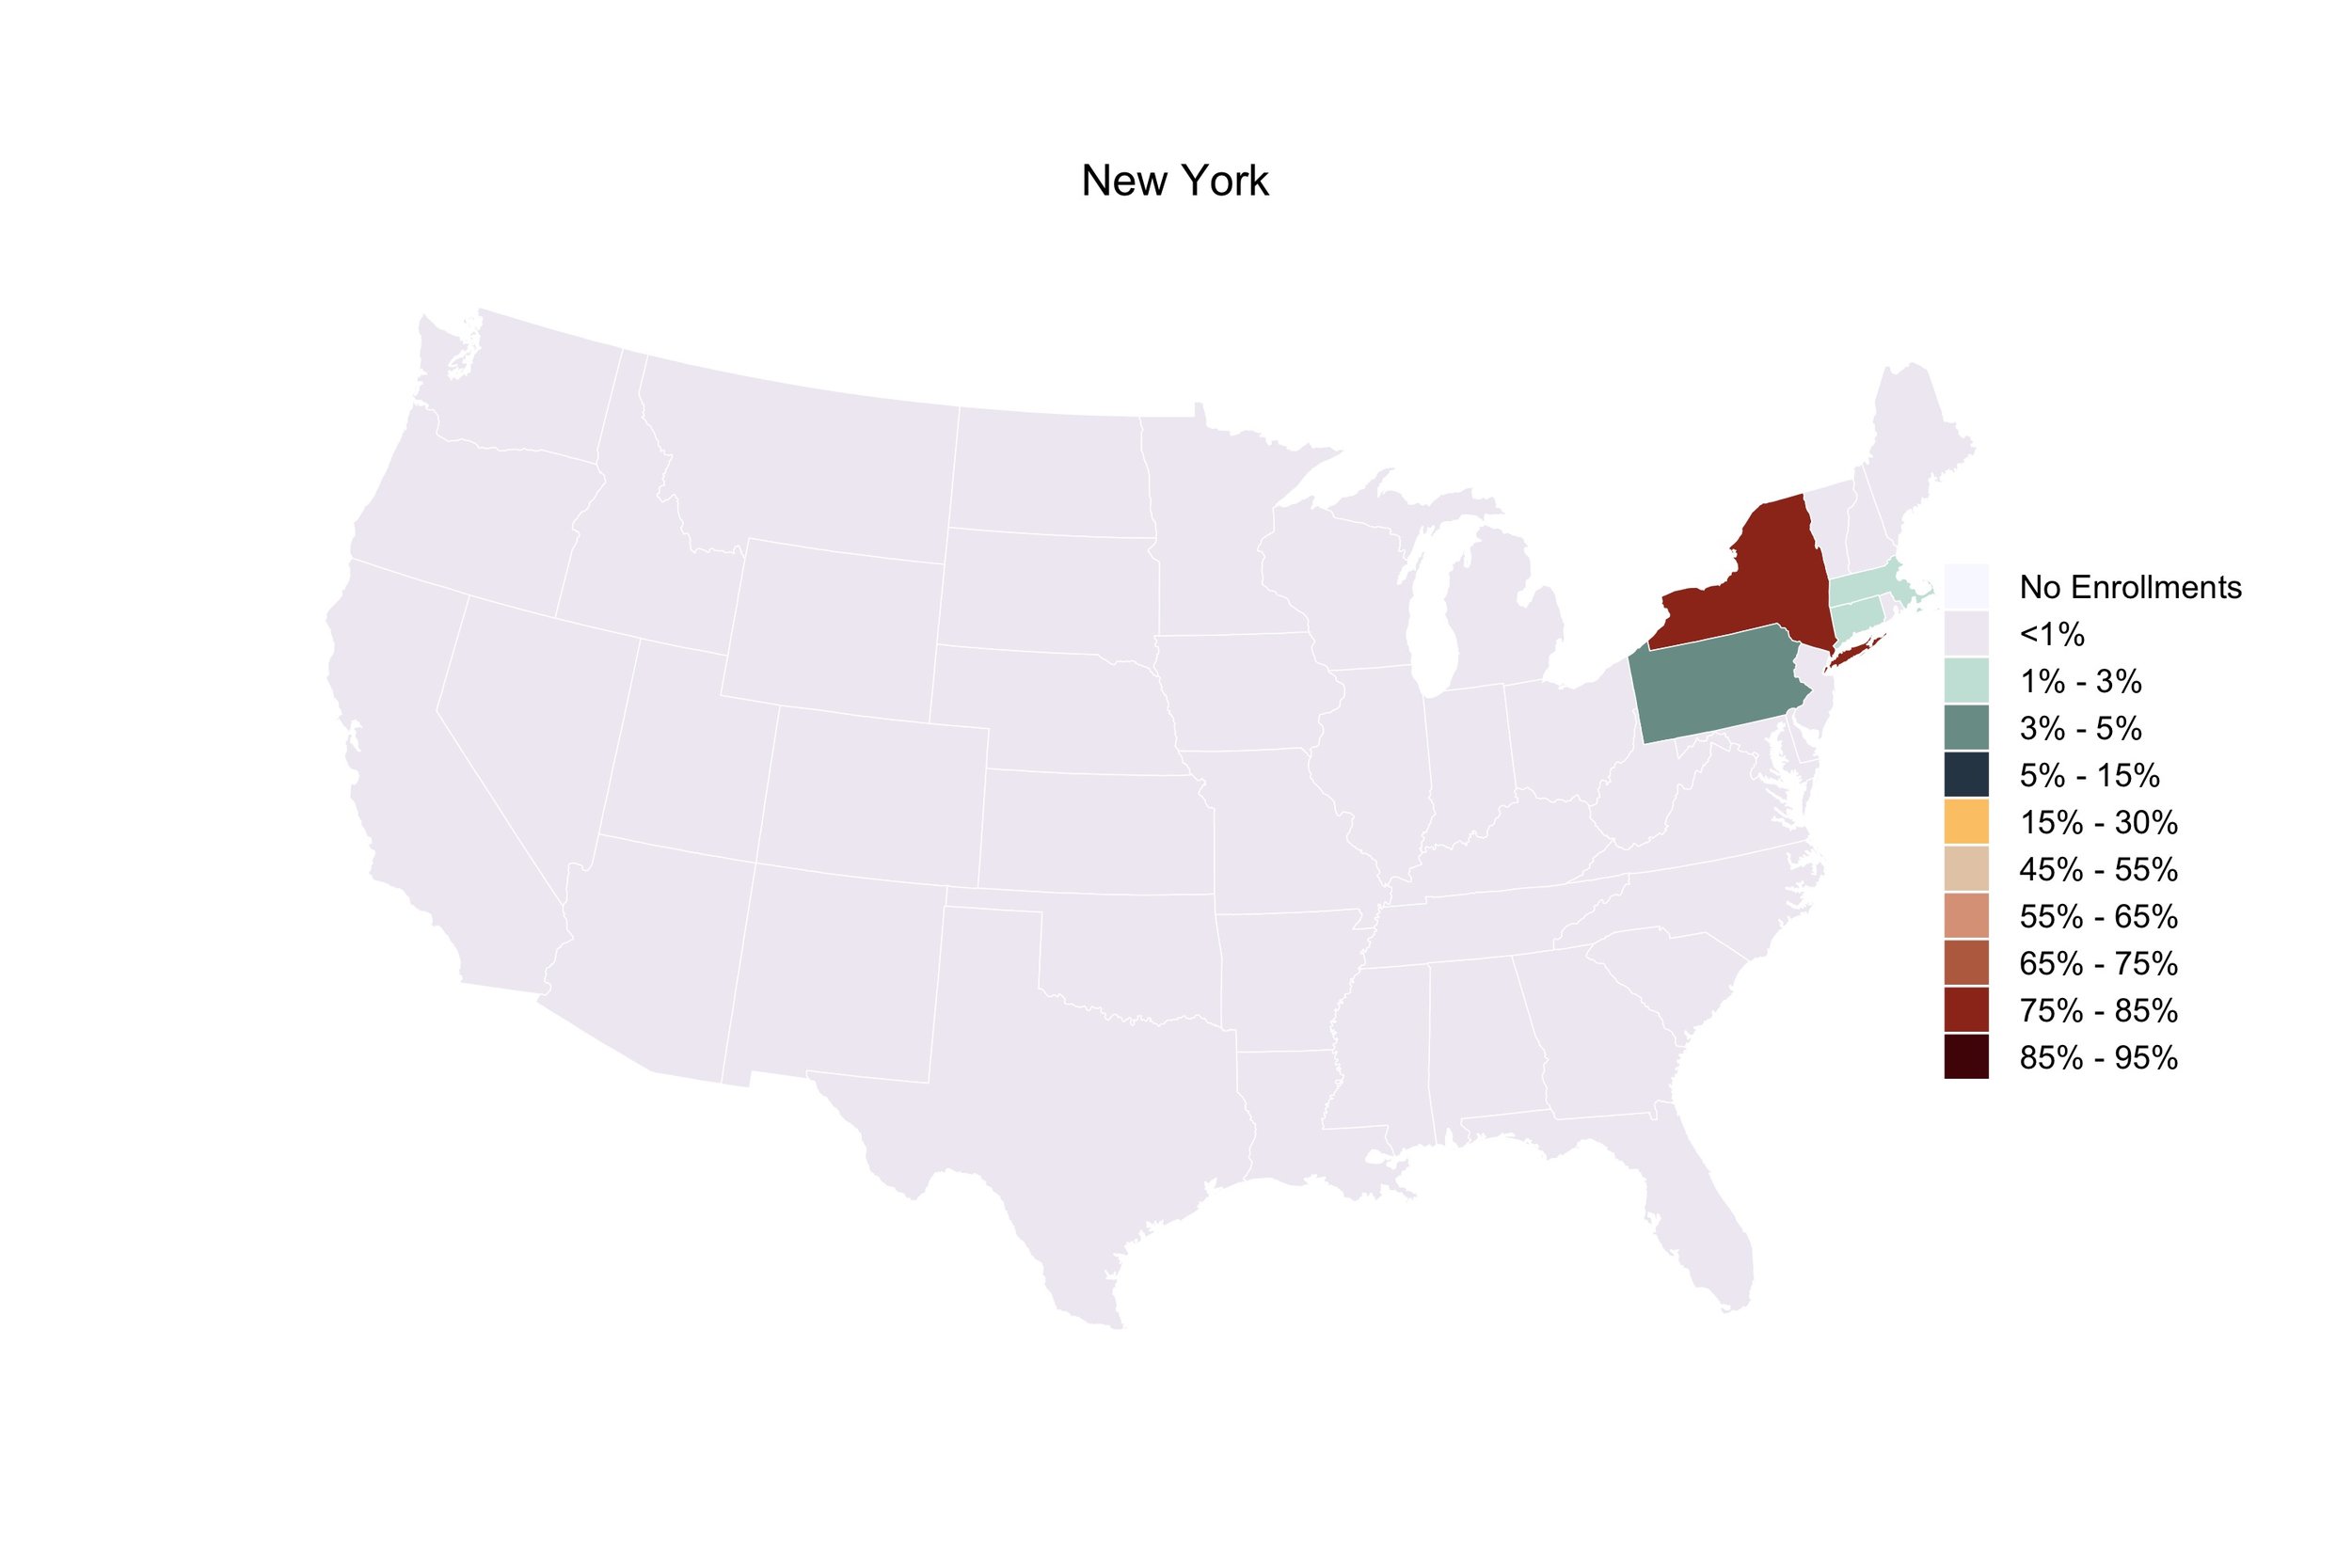
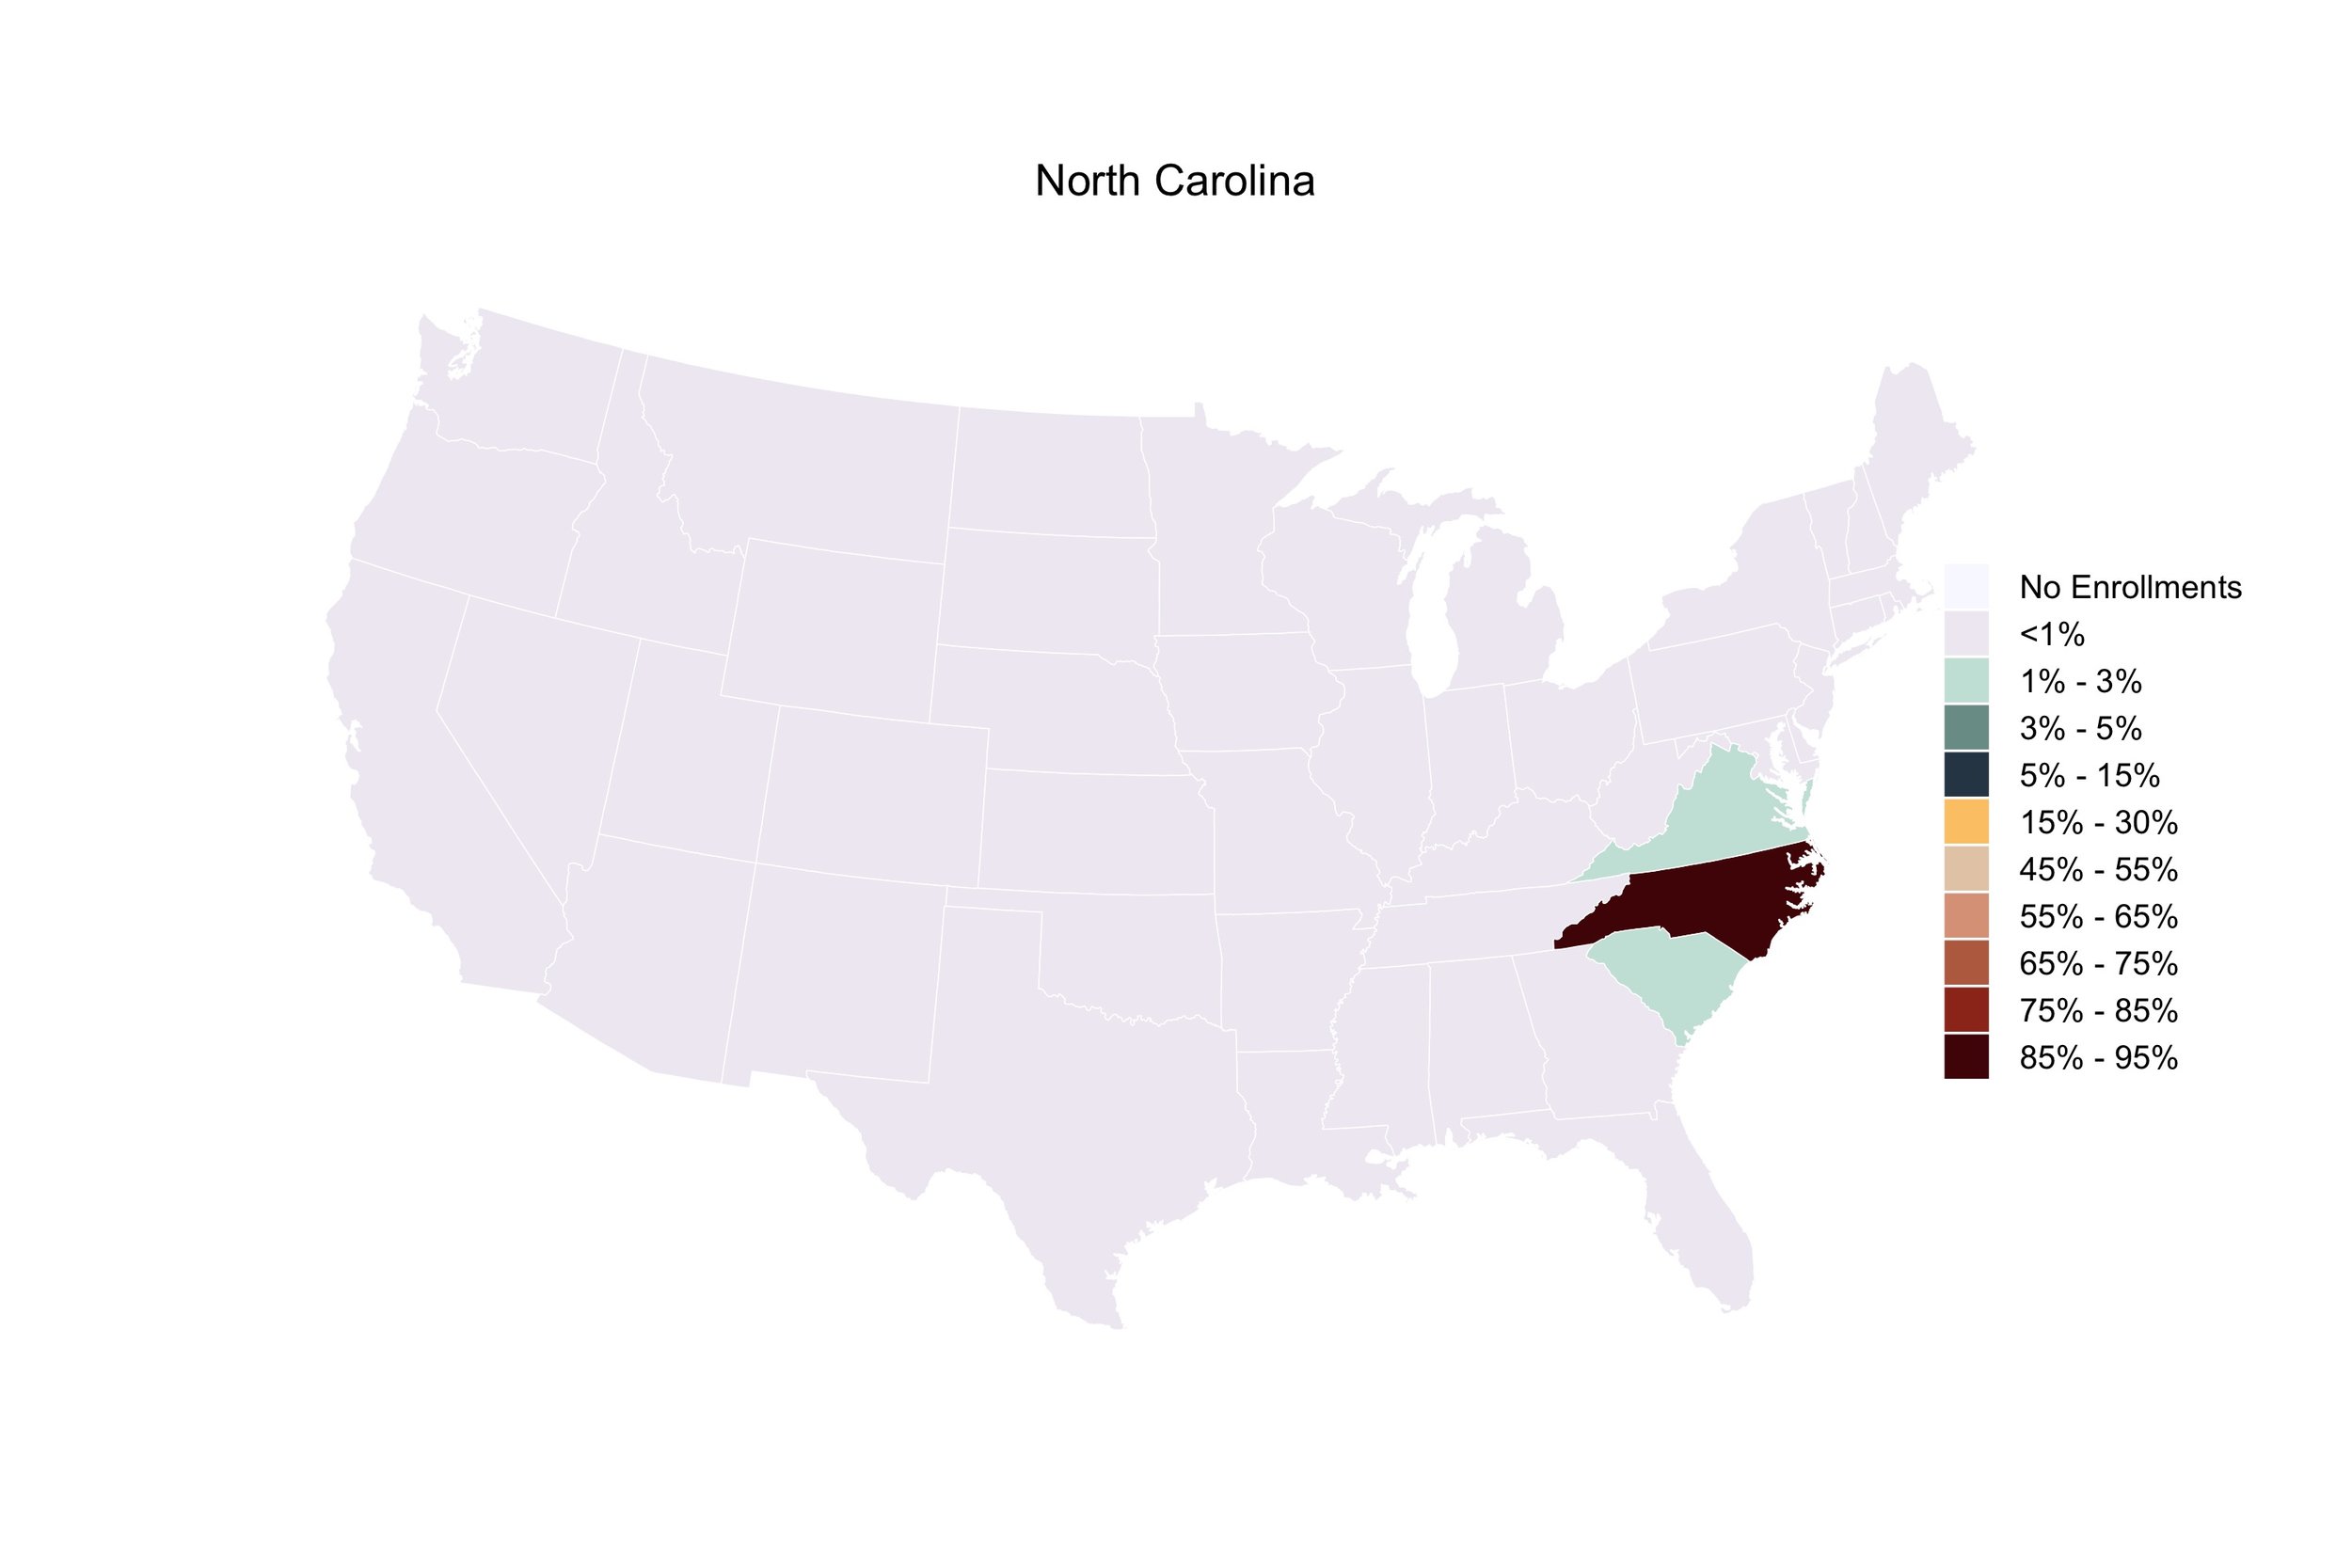
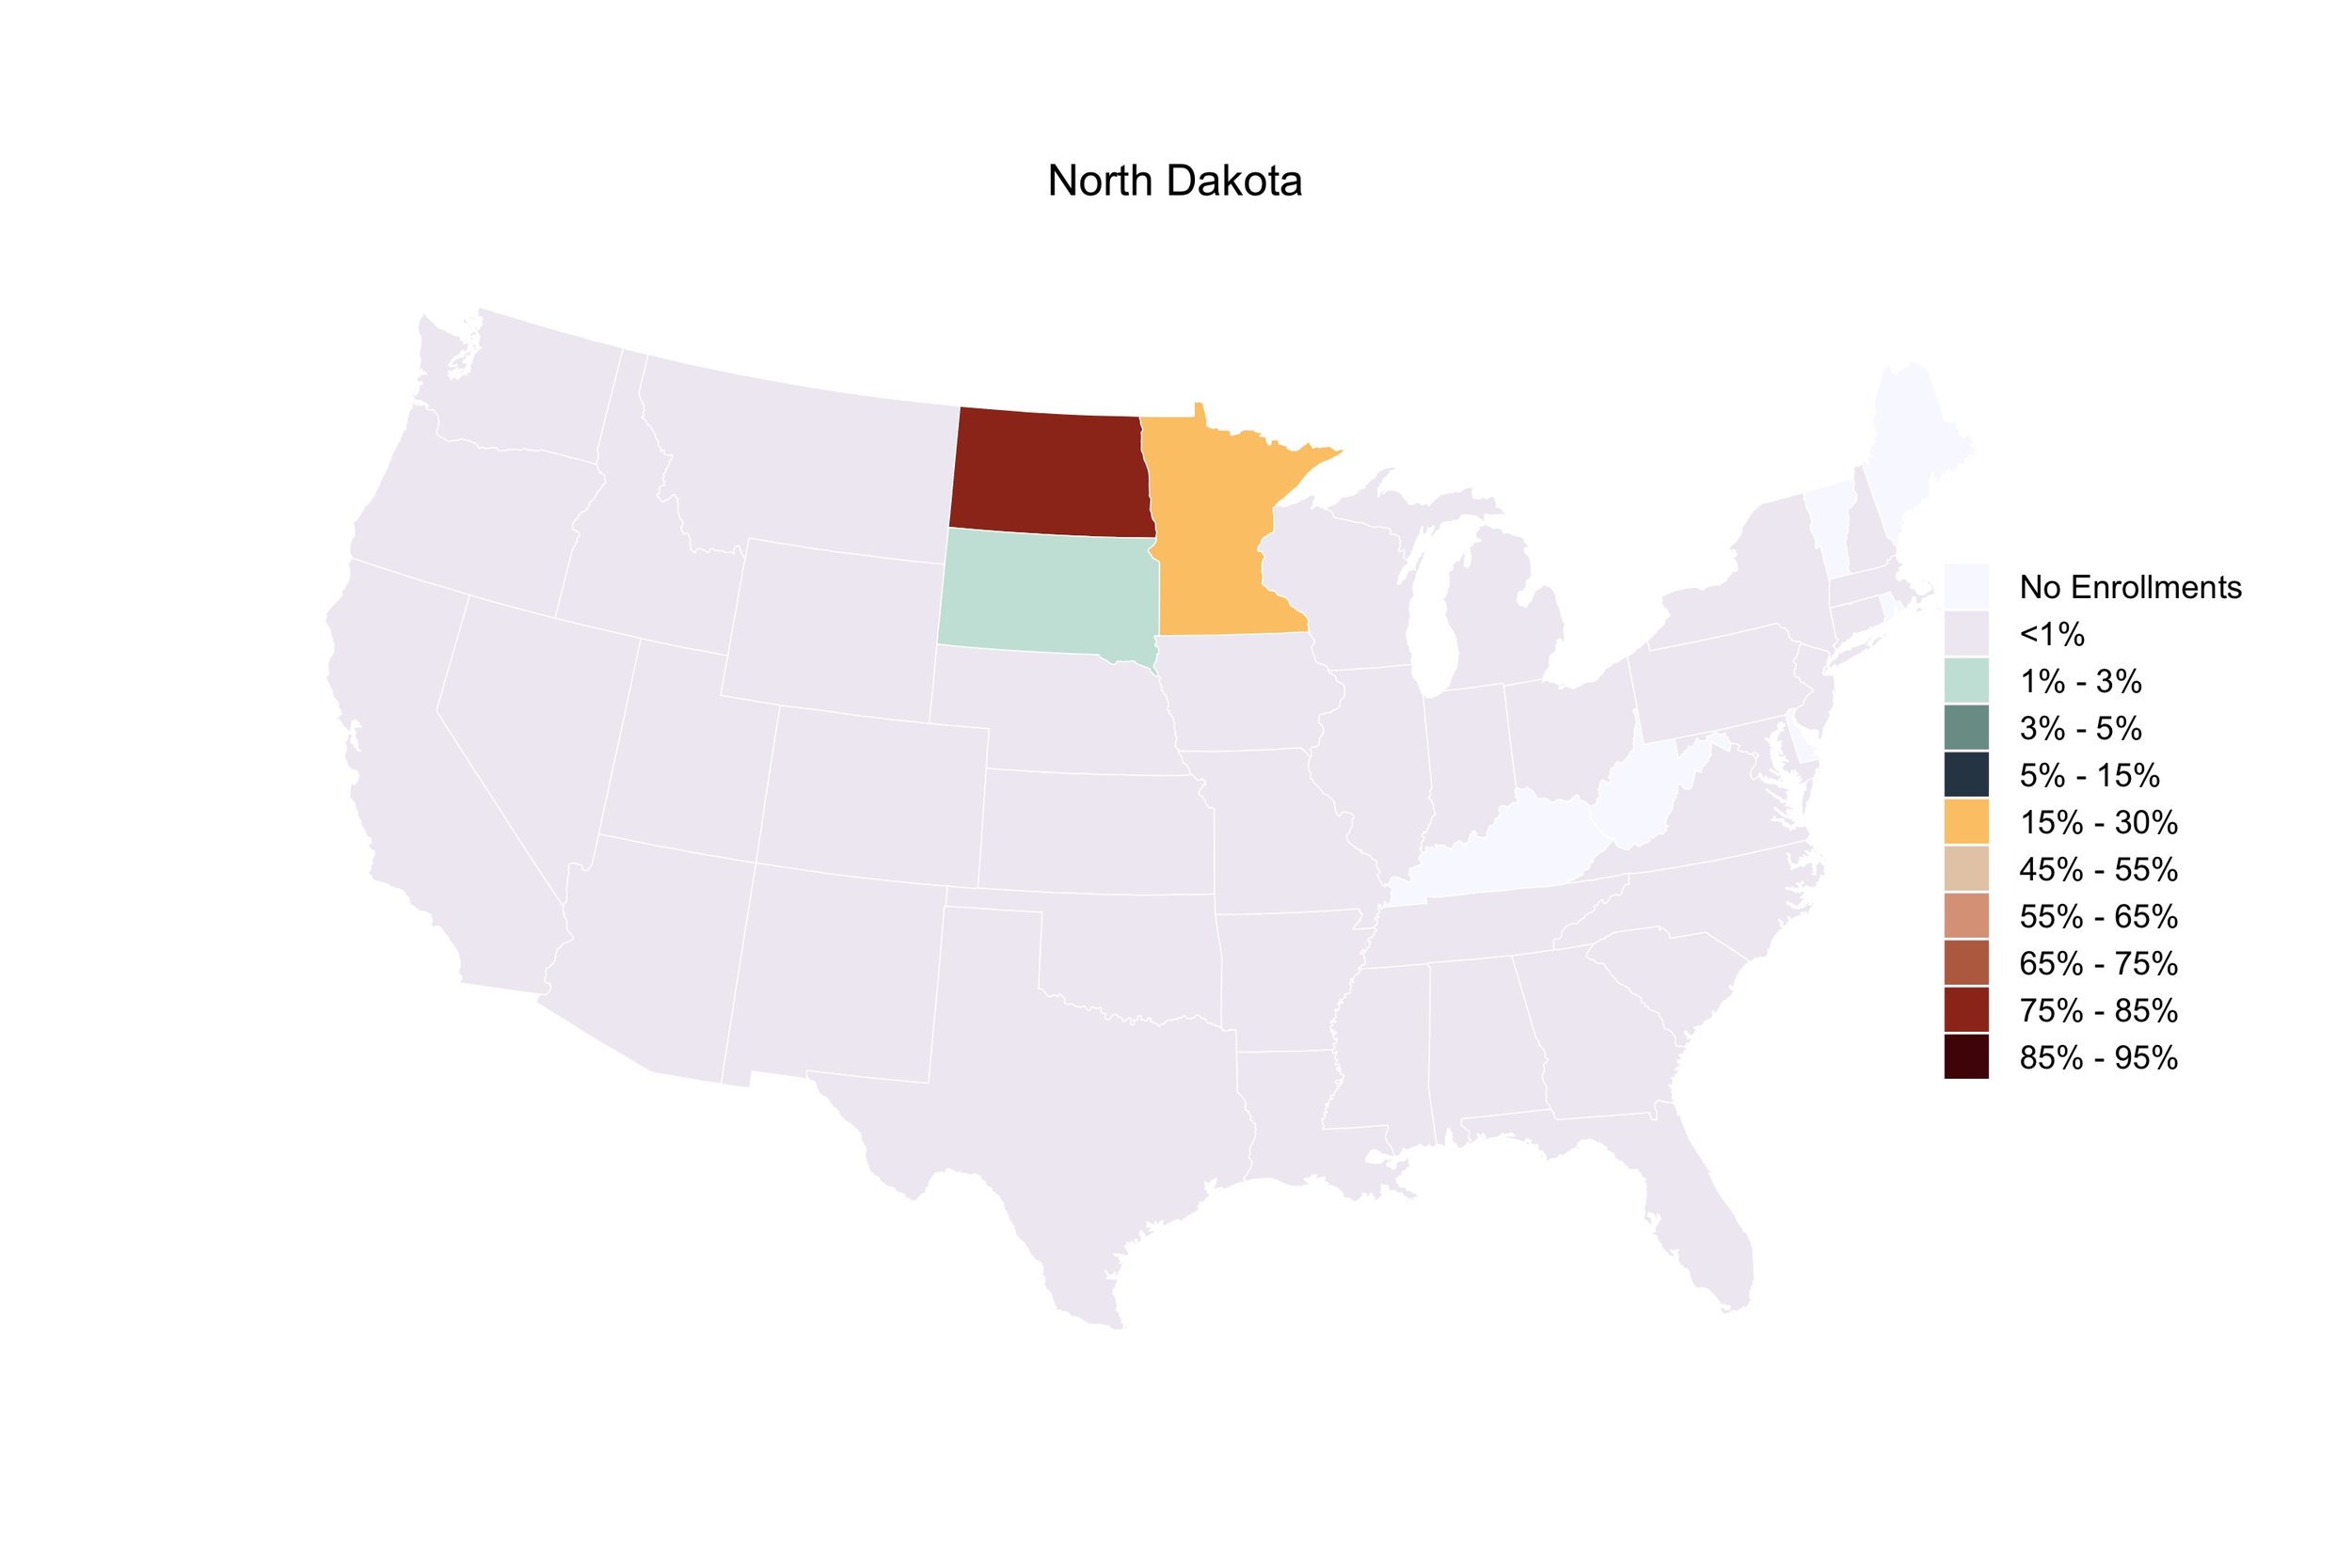
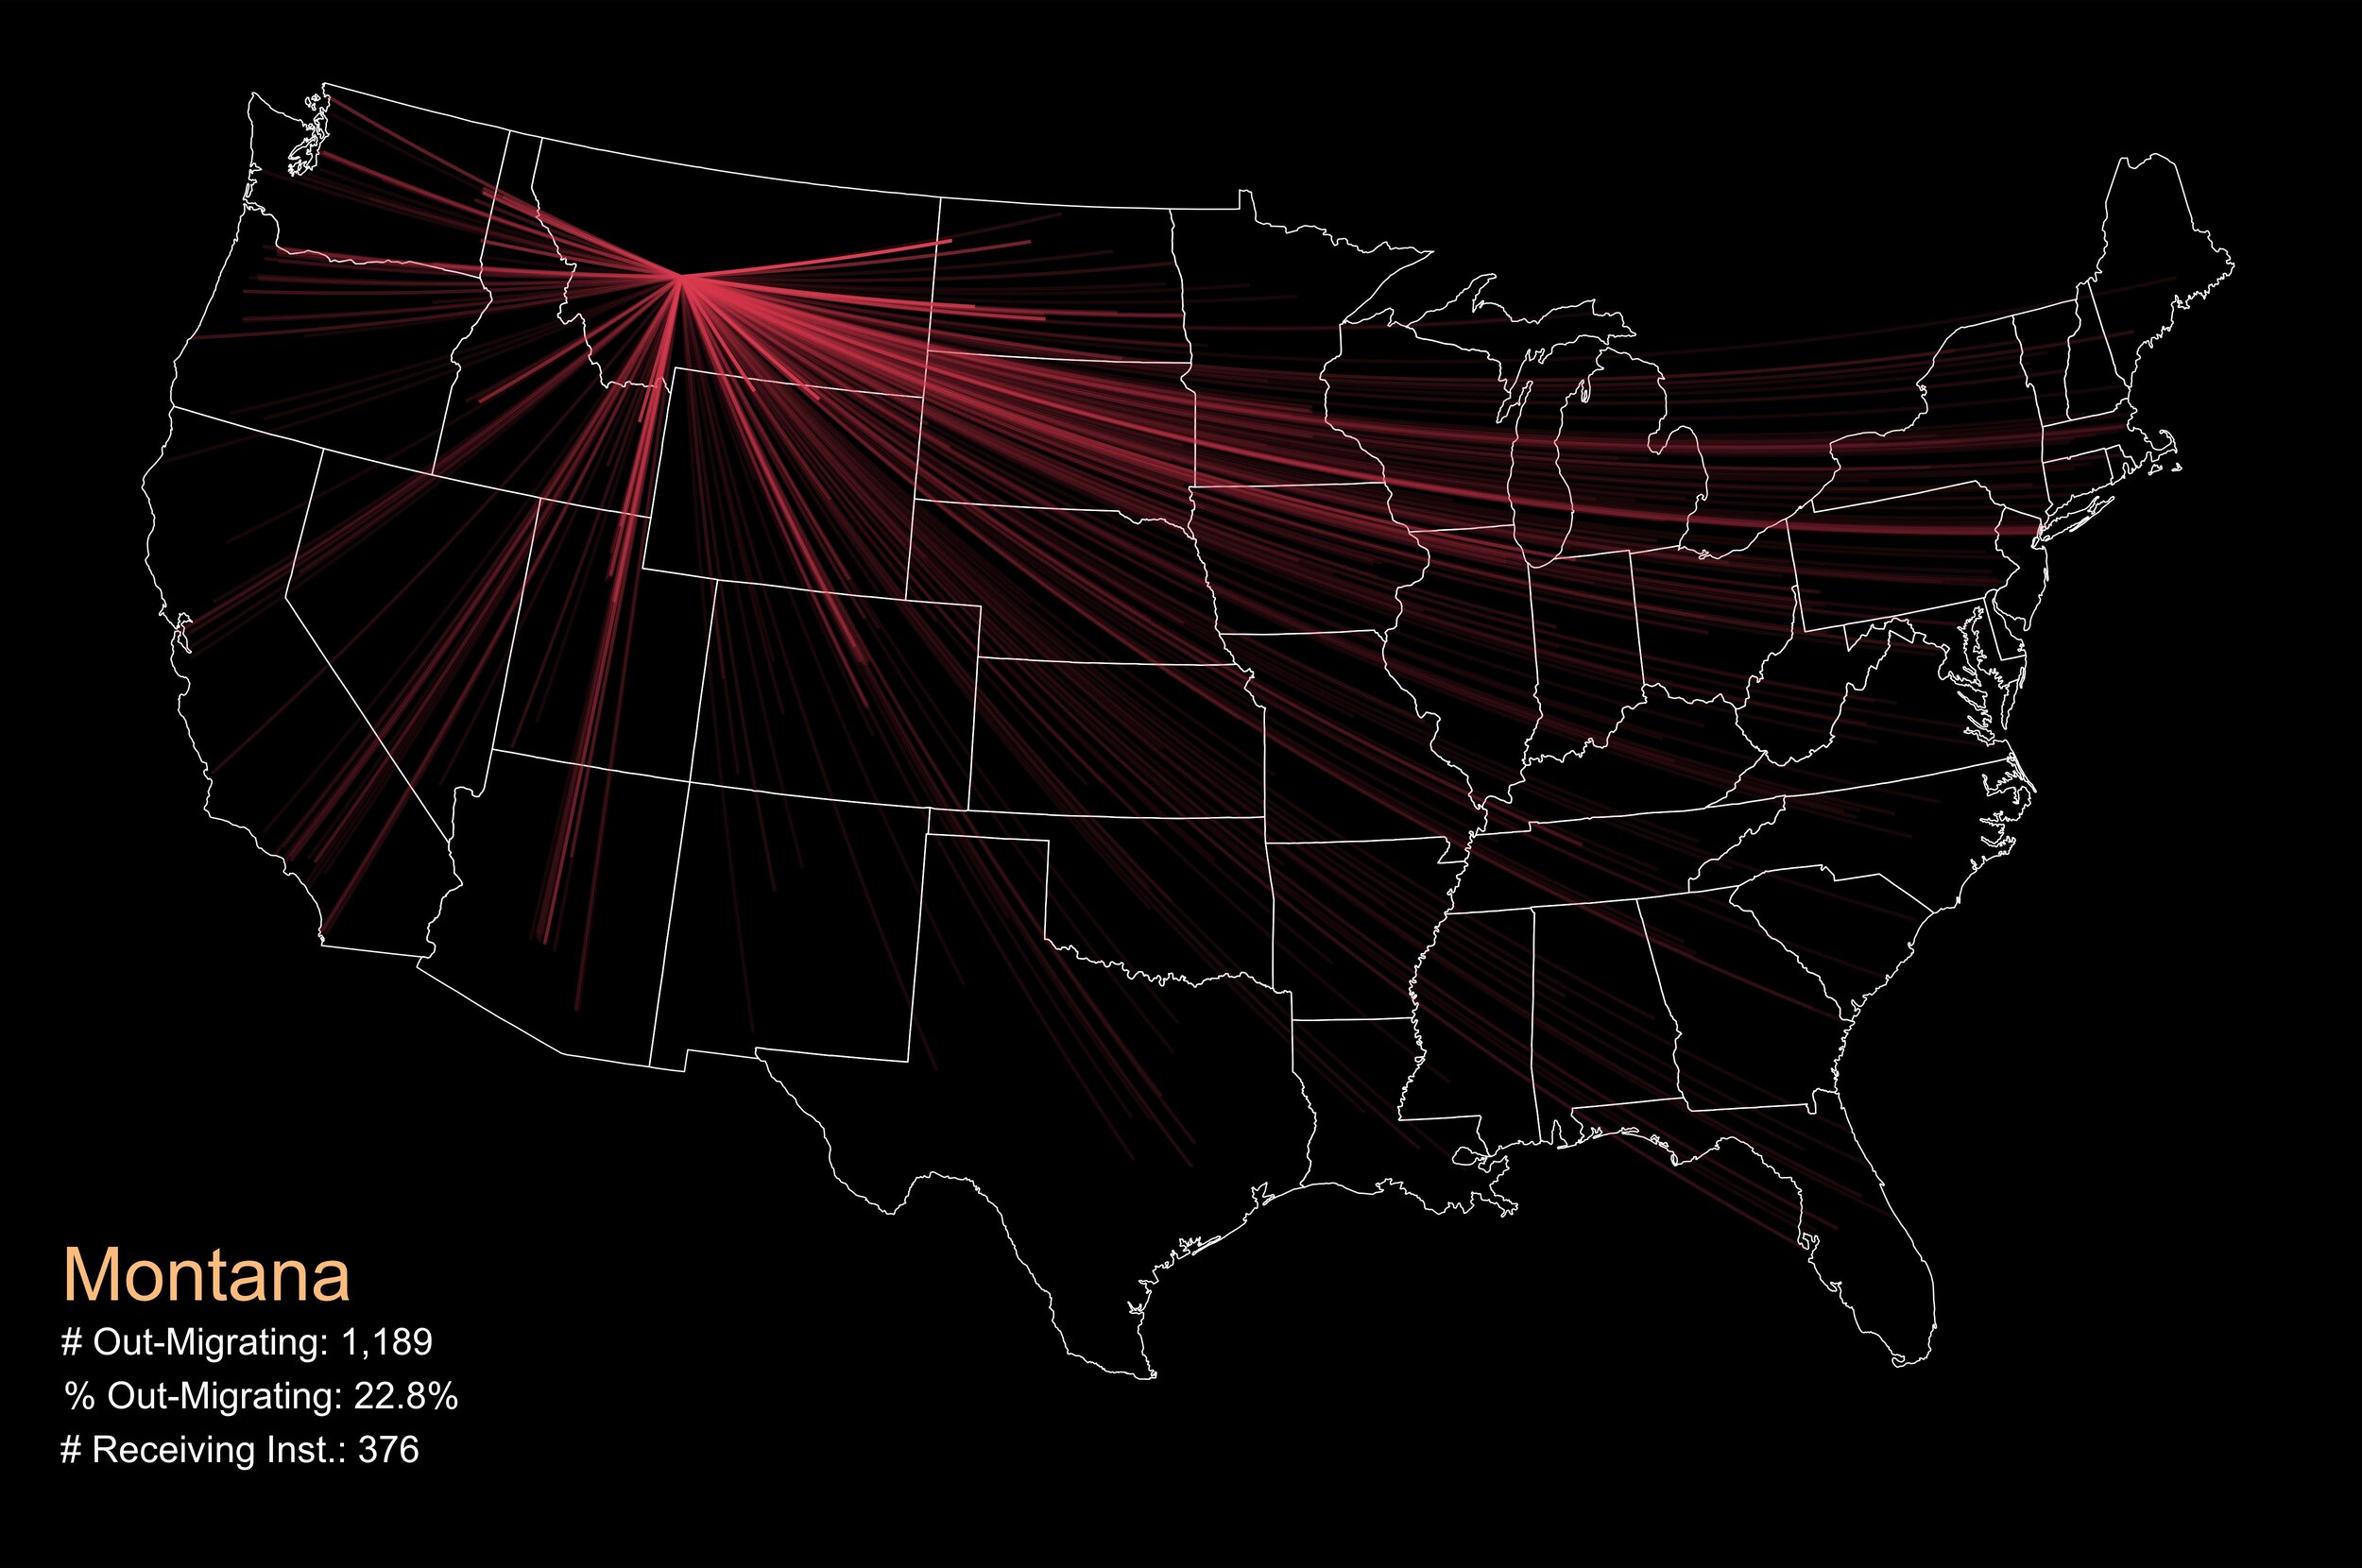
Exhibit B: Student Out-Migration Flows to College, by State of Residence: Fall 2018

The number of first-time college-goers who out-migrated to attend college in fall 2018 varied widely, ranging from approximately 700 Wyomingites to more than 38,000 Californians. Following California with the greatest number of out-migrants to college were Illinois (33,000), New Jersey (32,000), New York (30,000) and Texas (25,000). Thirty-six states and the District of Columbia had fewer than 10,000 residents out-migrate to attend college.

The map gallery below visualizes the geographic migration patterns of each state’s residents who attended an out-of-state college. Each line reflects a unique college destination, and the weight of the line is proportional to the number of residents who out-migrated to attend that particular college.

Notes: Exhibit includes U.S. degree-granting institutions that participate in Title IV federal financial aid programs. Student counts include U.S. residents who are first-time degree/certificate-seeking, completed high school within twelve months of…

Notes: Exhibit includes U.S. degree-granting institutions that participate in Title IV federal financial aid programs. Student counts include U.S. residents who are first-time degree/certificate-seeking, completed high school within twelve months of fall enrollment, and out-migrated from their states of residence to attend college. Origin points (i.e., state of residence locations) are operationalized as the geographic coordinates of each contiguous state’s mean population center, as reported by the U.S. Census Bureau. Alaska and Hawaii are excluded from this exhibit for visualization purposes but are included in out-migration counts. Source: Integrated Postsecondary Education Data system, Fall Enrollment (EF) survey, Spring 2019. Author’s calculations.

Exhibit C: Top 25 Out-of-State Colleges, by State of Residence: Fall 2018

While a state’s residents who out-migrate to college enroll at hundreds and up to more than a thousand different colleges, states typically supply only a handful of their residents to most of these out-of-state options. However, there are particular college destinations popular among out-migrants, especially colleges in neighboring states.

The table below displays each state’s top 25 most attended out-of-state colleges among first-time college-goers who out-migrated to attend college in fall 2018. Scroll across the table to reveal additional characteristics about each college including: percent of applicants admitted, published tuition and fees for in- and out-of-state first-time students (recognizing that many states participate in tuition reciprocity programs that reduce out-of-state tuition prices for nonresidents), and percent of students enrolled exclusively in distance education courses (e.g., online classes). Use the navigation arrow(s) at the top right of the table to toggle between states (in alphabetical order).

Notes: Student counts include U.S. residents who are first-time degree/certificate-seeking, completed high school within twelve months of fall enrollment, and out-migrated from their states of residence to attend college. The “% Admitted” column ref…

Notes: Student counts include U.S. residents who are first-time degree/certificate-seeking, completed high school within twelve months of fall enrollment, and out-migrated from their states of residence to attend college. The “% Admitted” column reflects the share of first-time degree/certificate-seeking applicants granted an offer of admission for fall 2019. Institutions that self-report an open admissions policy were assigned a 100% admission rate. Published tuition and fees reflect the 2019–20 academic year in 2019 dollars. The “% Enrolled Exclusively in Distance Education” column reflects the share of total enrollment in fall 2018 that enrolled only in courses delivered via distance education (i.e., online classes). Source: Integrated Postsecondary Education Data system, Fall Enrollment (EF) survey, Spring 2019; Admissions (ADM) survey, Winter 2019; Institutional Characteristics (IC) survey, Fall 2019. Barron’s Admissions Competitive Index, 2014. Author’s calculations.


Distance Education and Fall Enrollment: A Pre-COVID Snapshot

The global Coronavirus Pandemic has upended U.S. higher education, forcing thousands of colleges and universities last spring to unexpectedly cease face-to-face instruction and shift to online course delivery models. And as COVID-19 cases continue to rise in certain parts of the U.S., hundreds of postsecondary institutions are planning to turn to online instruction, fully or in part, in fall 2020 as a means to maintain enrollments (and revenues) and balance public health concerns.

Provisional data from the Integrated Postsecondary Education Data System (IPEDS) offer the most up-to-date national snapshot of distance education enrollments (from fall 2018) at U.S. postsecondary institutions. IPEDS defines distance education (DE) as “education that uses one or more technologies to deliver instruction to students who are separated from the instructor,” and the term is often used synonymously with online education or distance learning. Even pre-COVID, DE courses provided students access to postsecondary education in a manner more temporally and geographically flexible, but are now becoming even more important in the wake of COVID-related disruptions.

The following data visualizations highlight the variation in DE coursetaking by student level (i.e., undergraduate or graduate), institutional sector (e.g., public, two-year or four-year), and geographic location for the subset of students enrolled exclusively in DE courses.

Among the approximately 20 million students enrolled at U.S. postsecondary institutions in fall 2018, 17 million (85 percent) were undergraduates and 3 million (15 percent) were graduate students. DE coursetaking patterns varied by student level (figure 1). A majority (66 percent) of undergraduates did not enroll in any DE courses, 20 percent enrolled in both DE and non-DE courses, and a minority (14 percent) enrolled exclusively in DE courses. In contrast, graduate students were more than twice as likely as undergraduates (31 percent vs. 14 percent) to enroll exclusively in DE courses, though the majority (60 percent) did not enroll in any DE courses. Only 9 percent of graduate students enrolled in both DE and non-DE courses, suggesting an ‘all or nothing’ approach to their DE coursetaking preferences.

Figure 1: Enrollment, by Student Level and Distance Education Coursetaking: Fall 2018

Source: U.S. Department of Education, National Center for Education Statistics, IPEDS, Spring 2019, Fall Enrollment (EF) component (provisional data). Note: All U.S. Title IV institutions regardless of degree-granting status are included in analyses.

Source: U.S. Department of Education, National Center for Education Statistics, IPEDS, Spring 2019, Fall Enrollment (EF) component (provisional data). Note: All U.S. Title IV institutions regardless of degree-granting status are included in analyses.

The 17 million undergraduates enrolled at U.S. postsecondary institutions in fall 2018 were not equally distributed across institutional sectors, and DE coursetaking patterns varied by sector (figure 2). Most (77 percent) undergraduates enrolled in either public, four-year (44 percent) or public, two-year (33 percent) postsecondary institutions. Undergraduates within these two largest sectors demonstrated similar DE coursetaking patterns: a majority (66 percent within each sector) did not enroll in any DE courses and a minority (9 percent within the public, four-year sector and 14 percent within the public, two-year sector) enrolled exclusively in DE courses. In contrast, among the 586 thousand undergraduates enrolled in the private for-profit, four-year sector (4 percent of total undergraduate enrollment), a majority (67 percent) enrolled exclusively in DE courses, with an additional 13 percent enrolled in both DE and non-DE courses.

Figure 2: Undergraduate Enrollment, by Institutional Sector and Distance Education Coursetaking: Fall 2018

Source: U.S. Department of Education, National Center for Education Statistics, IPEDS, Spring 2019, Fall Enrollment (EF) component (provisional data). Notes: PUB = public; PNP = private nonprofit; PFP = private for-profit; OTHER includes all private…

Source: U.S. Department of Education, National Center for Education Statistics, IPEDS, Spring 2019, Fall Enrollment (EF) component (provisional data). Notes: PUB = public; PNP = private nonprofit; PFP = private for-profit; OTHER includes all private nonprofit and for-profit two-year institutions and all less-than-two-year institutions regardless of control. Institutional ‘sector’ is defined by IPEDS, which classifies community colleges that award bachelor’s degrees as four-year institutions, even if they primarily award subbaccalaureate degrees and certificates. All U.S. Title IV institutions regardless of degree-granting status are included in analyses.

The 3 million graduate students enrolled at U.S. postsecondary institutions in fall 2018 were relatively equally distributed across public, four-year (49 percent) and private nonprofit, four-year (43 percent) sectors, and DE coursetaking patterns were similar between these sectors (figure 3). Approximately two-thirds (66 percent within the public, four-year sector and 64 percent within the private nonprofit, four-year sector) of graduate students did not enroll in any DE courses. And approximately one-quarter (25 percent within the public, four-year sector and 27 percent within the private nonprofit, four-year sector) enrolled exclusively in DE courses. In contrast, among the 243 thousand graduate students enrolled in the private for-profit, four-year sector (8 percent of total graduate enrollment), most (87 percent) enrolled exclusively in DE courses. For graduate students enrolled in this sector, DE is the primary course delivery method, with only 9 percent not enrolled in any DE courses.

Figure 3: Graduate Enrollment, by Institutional Sector and Distance Education Coursetaking: Fall 2018

Source: U.S. Department of Education, National Center for Education Statistics, IPEDS, Spring 2019, Fall Enrollment component (provisional data). Notes: PUB = public; PNP = private nonprofit; PFP = private for-profit. Institutional ‘sector’ is defin…

Source: U.S. Department of Education, National Center for Education Statistics, IPEDS, Spring 2019, Fall Enrollment component (provisional data). Notes: PUB = public; PNP = private nonprofit; PFP = private for-profit. Institutional ‘sector’ is defined by IPEDS, which classifies community colleges that award bachelor’s degrees as four-year institutions, even if they primarily award subbaccalaureate degrees and certificates. All U.S. Title IV institutions regardless of degree-granting status are included in analyses.

Among the 3.3 million students enrolled exclusively in DE courses in fall 2018, 71 percent were undergraduates and 29 percent were graduate students (figure 4). DE course delivery ostensibly allows students access to postsecondary institutions regardless of location. But among the 2.3 million undergraduates enrolled exclusively in DE courses, a majority (63 percent) enrolled at postsecondary institutions located within the same state as their residence, suggesting that for DE-enrolled undergraduates physical location remains an important consideration. In contrast, among the 933 thousand graduate students enrolled exclusively in DE courses, a majority (53 percent) resided in a different state than that of their enrolled institution; however, more than two-fifths (44 percent) resided in the same state as their enrolled institution.

Figure 4: Exclusively Distance Education Enrollment, by Student Level and Location: Fall 2018

Source: U.S. Department of Education, National Center for Education Statistics, IPEDS, Spring 2019, Fall Enrollment component (provisional data). Note: All U.S. Title IV institutions regardless of degree-granting status are included in analyses.

Source: U.S. Department of Education, National Center for Education Statistics, IPEDS, Spring 2019, Fall Enrollment component (provisional data). Note: All U.S. Title IV institutions regardless of degree-granting status are included in analyses.

The data visualizations presented highlight the large role DE plays in U.S. higher education, particularly for graduate students and those enrolled in the for-profit sector. The effects of the Coronavirus Pandemic on fall 2020 enrollment remain to be seen, but the shares of undergraduate and graduate students enrolled in DE courses are likely to increase, even if overall enrollment decreases due to some students opting out of fall enrollment.

Do Public Flagship Universities Serve Their States' Residents?

Public flagship universities serve many critical roles within their states: as engines of social mobility and economic impact through skills development and postsecondary attainment, as drivers of innovation and technological advancement through scientific research and commercialization, among others. Flagships are generally perceived as ‘prestigious’ or ‘selective’ within their states, and many burnish nationally competitive profiles. Compared to other in-state public colleges and universities, flagships typically exhibit higher graduation rates and receive more per student funding from taxpayers.

Given that flagships find themselves perched atop the hierarchy of state public higher education systems, who is given access? As publicly subsidized educational institutions, should flagships make it their mission to serve primarily residents of their own state?

The following visualizations explore the relationship between residency and enrollment, recently and over time, at the nation’s 50 public flagship universities.

Figure 1 displays the count of in-state students (y-axis) plotted against the count of out-of-state students (x-axis) among the cohort of first-time, degree-seeking domestic students in fall 2016. Flagships with larger in-state and out-of-state enrollments fall higher on the y-axis and farther to the right on the x-axis, respectively. Flagships with the largest incoming cohorts include the University of Texas at Austin (8,266 students), the Pennsylvania State University—Main Campus (7,641 students), and the University of Alabama (7,501 students).

Figure 1. Count of In-State and Out-of-State Enrollments Among First-Time, Degree/Certificate-Seeking Domestic Undergraduate Cohort, by State Flagship University: Fall 2016

Source: Integrated Postsecondary Education Data System (IPEDS), Spring 2017, Fall Enrollment (EF) Survey. Notes: The roster of state flagship universities is modeled after the institutions listed in College Board’s Trends in College Pricing 2019 rep…

Source: Integrated Postsecondary Education Data System (IPEDS), Spring 2017, Fall Enrollment (EF) Survey. Notes: The roster of state flagship universities is modeled after the institutions listed in College Board’s Trends in College Pricing 2019 report (Figure 7).

In fall 2016, most flagships (40 out of 50) enrolled more in-state than out-of-state students (visualized as points falling to the left of the dashed diagonal line). The remaining minority of flagships (10 out of 50) enrolled more out-of-state than in-state students (points falling to the right of the dashed diagonal line). The share of in-state enrollments at flagships ranged from 21.2% at the University of Vermont (524 Vermonters among an incoming cohort of 2,469 students) to 96.9% at the University at Buffalo (3,432 New Yorkers among an incoming cohort of 3,542 students). Color-coded points provide more detailed information on the share of in-state student enrollments at each flagship (see legend).

How have trends in residency and enrollment changed over time? Figure 2 displays a decade-long trend in the share of in-state enrollments at public flagship universities from fall 2006 to fall 2016. Institutions appear in descending order from the largest to smallest share of in-state enrollments in fall 2016.

Figure 2. Share of In-State Enrollments Among First-Time, Degree/Certificate-Seeking Undergraduate Domestic Cohort, by State Flagship University: Fall 2006 to Fall 2016 (even-numbered years)

Source: Integrated Postsecondary Education Data System (IPEDS), Spring 2007 through 2017, Fall Enrollment (EF) Survey (odd-numbered years).

Source: Integrated Postsecondary Education Data System (IPEDS), Spring 2007 through 2017, Fall Enrollment (EF) Survey (odd-numbered years).

Between fall 2006 and fall 2016, most flagships maintained a stable share of in-state enrollments (visualized as flat trend lines) regardless of their relative positions (y-axis). For example, Rutgers University-New Brunswick (first row) consistently enrolled more than 90% New Jerseyans among its fall cohorts, and the University of Delaware (last row) consistently enrolled between 35% and 45% Delawareans among its cohorts.

Given the relative stability in the share of in-state enrollments over time, the minority of flagships that demonstrate shifting trends (typically declining) stand out. The University of Maine, the University of Arkansas, and the University of Alabama are among a handful of flagships that exhibit steep declines in the share of in-state enrollments over time.

Figure 3 visualizes the percentage point difference in the share of in-state enrollments between fall 2006 and fall 2016 at the nation’s 50 public flagship universities. In fall 2016, most flagships (38 out of 50) enrolled smaller shares of in-state students than in fall 2006 (visualized as points falling to the left of zero on the x-axis). The remaining 12 flagships enrolled larger shares of in-state students (falling to the right of zero on the x-axis). But only one flagship—the University of Idaho—exhibited an increase of more than 5 percentage points. By contrast, approximately one-quarter of flagships (13 out of 50) exhibited a decrease of more than 10 percentage points.

Figure 3. Percentage Point Difference in Share of In-State Enrollments Among First-Time, Degree/Certificate-Seeking Domestic Undergraduate Cohort, by State Flagship University: Fall 2016 vs. Fall 2006

Source: Integrated Postsecondary Education Data System (IPEDS), Spring 2007 and 2017, Fall Enrollment (EF) Survey.

Source: Integrated Postsecondary Education Data System (IPEDS), Spring 2007 and 2017, Fall Enrollment (EF) Survey.

What explains the observed trends in residency and enrollment at public flagship universities? Flagships may recruit out-of-state students for several reasons: to improve their academic profiles and maximize prestige, to offset stagnant or dwindling enrollments, and to generate tuition revenue at the higher out-of-state rate to counter declining state appropriations.

Some states and university systems have adopted policies that prioritize in-state over out-of-state enrollments. For example, Texas’s longstanding ‘Top 10 Percent Rule’ guarantees admission to its most selective public universities (including the University of Texas at Austin) based on residents’ high school class rank. And in 2017, the University of California (UC) system capped out-of-state undergraduate enrollments at 18% for five UC campuses, and UC Berkeley, UCLA, UC Irvine, and UC San Diego are not permitted to exceed their 2017-18 out-of-state levels.

By contrast, some flagships have built enrollment management strategies around recruiting out-of-state students. For example, the University of Arkansas offers the New Arkansan Non-Resident Tuition Award (NRTA), a merit-based scholarship for incoming freshmen from neighboring states that covers up to 90% of the difference between in-state and out-of-state tuition, and in 2017 expanded the program to include all 50 states and the District of Columbia with its ‘Extended States’ NRTA.

The University of Alabama also stands out for its steep decline in the share of in-state enrollments among incoming cohorts, falling approximately 35 percentage points from fall 2006 (66.6%) to fall 2016 (32.2%). A recent research report highlights Alabama’s aggressive out-of-state recruitment activities: spending millions of dollars in the 2010s to purchase prospective ‘student lists’ from testing companies and conducting approximately 4,000 out-of-state recruiting visits in 2017 (more than 90% of Alabama’s total visits).

If the majority of Alabama’s incoming students are increasingly nonresidents, where do they come from? Figure 4 presents a map gallery spanning fall 2006 to fall 2016 (even-numbered years) and shows the proportion of Alabama’s incoming cohorts by state of residence at the time of admission. For example, among Alabama’s 4,349 first-time, degree-seeking students in fall 2006, 66.6% were Alabamans and 9.4% were Georgians (geographic neighbors). Scroll through the map gallery below to explore how geographic enrollment patterns at the University of Alabama have changed over the decade.

Figure 4. Share of First-time, Degree/Certificate-Seeking Domestic Undergraduate Cohort at University of Alabama, by State of Residence: Fall 2006 to Fall 2016 (even-numbered years)

legend_tile_map-01.jpg
Source: Integrated Postsecondary Education Data System (IPEDS), Spring 2007 through 2017, Fall Enrollment (EF) Survey (odd-numbered years).

Source: Integrated Postsecondary Education Data System (IPEDS), Spring 2007 through 2017, Fall Enrollment (EF) Survey (odd-numbered years).

The map gallery visualizes the declining share of in-state enrollments at the University of Alabama and the geographic expansion of its out-of-state enrollments over time. Reflecting a national approach to student recruitment, Alabama increased enrollment shares from the Southeast, Midwest, and Mid-Atlantic regions and as far west as California. The states that experienced the largest increased shares of representation between fall 2006 and fall 2016 include Illinois (from 0.6% to 6.2% of the incoming cohort), California (from 0.5% to 4.1%), and New Jersey (from 0.3% to 2.9%).

What are the implications for growing out-of-state enrollments at public flagship universities? Research on out-of-state enrollments at public research universities (institutions that mirror and largely overlap with flagships) suggests that out-of-state enrollments may have a crowding out effect on in-state enrollments at highly selective institutions and that increased out-of-state enrollments correlate with declining racial/ethnic and socioeconomic diversity among the student body.

As flagships strive to live up to their historical mission to serve the residents of their states, they must balance the complicated and competing interests of revenue and prestige with access and diversity.


The Geography of College Choice

Despite a nationwide network of more than 4,000 degree-granting colleges and universities in the U.S., student college choice remains a largely localized phenomenon. In fall 2016, 80% of the approximately 2.2 million recent high school graduates who were first-time college enrollees selected a postsecondary institution within their home state. This makes economic sense. States incentivize in-state college enrollment by subsidizing public higher education to keep tuition substantially lower for residents, compared to non-residents, and through financial aid programs designed to retain their academically high-achieving students.

But states demonstrate great variability in the share of students who remain in-state or out-migrate to attend college. The following visualizations highlight differences in the geographic mobility of each state’s residents when making their college choice.

In-State College Enrollment

How does in-state college enrollment vary by state? The map below reveals that Southern states generally exhibit the highest rates of in-state college enrollment. The states with the largest shares of in-state college enrollment among their residents are Mississippi (93%), Utah (91%), Louisiana (90%), Oklahoma (89%), and Arkansas (89%). For these states and others shaded in burgundy, college out-migration is the rare exception to the rule of in-state college enrollment.

On the other hand, states in the Northeast typically exhibit the lowest rates of in-state college enrollment, suggesting their residents exercise greater geographic mobility when making their college choice. The states with the smallest shares of in-state college enrollment among their residents are the District of Columbia (18%), Vermont (49%), New Hampshire (52%), Connecticut (53%), and New Jersey (57%).

Percentage of In-State College Enrollment, by State: Fall 2016

Source: Integrated Postsecondary Education Data System (IPEDS), Spring 2017, Fall Enrollment (EF) Survey. Notes: Calculations include all first-time degree/certificate-seeking undergraduate students who graduated from high school in the past 12 mont…

Source: Integrated Postsecondary Education Data System (IPEDS), Spring 2017, Fall Enrollment (EF) Survey. Notes: Calculations include all first-time degree/certificate-seeking undergraduate students who graduated from high school in the past 12 months and attend a U.S. degree-granting postsecondary institution (i.e., awards associate degree or higher) that participates in Title IV federal financial aid programs.

Geographic Mobility Patterns of College Enrollment

Where do out-of-state enrollees go to attend college? Short answer: Not far. Though they represent the minority of all college-goers, the majority of out-of-state enrollees choose a college located in a geographically bordering state. As an example, while 82% of Georgia’s recent high school graduates who were first-time college enrollees remained in-state, another 10% selected a college or university in a neighboring state (i.e., Alabama, Florida, North Carolina, South Carolina, or Tennessee). Overall, only 8% of college-going Georgians migrated beyond a bordering state to attend college.

These largely localized college enrollment patterns are presented in the map gallery below. By visually inspecting the geographic mobility of first-time college enrollees, a clear pattern emerges. In general, the highest concentration of states’ college-going residents are found to remain in the state of residence (warm colors), followed by neighboring states (cool colors), and then only minimally represented in non-bordering or geographically distant states (light grey), or not at all (lightest grey). Most states’ college-going residents are substantively represented in only a handful of states, clustered primarily in their home state and to a lesser extent in neighboring states.

Twenty states have residents represented at colleges and universities in all 50 states and the District of Columbia, whereas the remaining 31 (including the District of Columbia) lack geographic representation in at least one state. The District of Columbia, South Dakota, and West Virginia exhibit the lowest levels of overall geographic representation nationally, with no college enrollments in 9 different states, respectively.

Some states, however, defy the typical geographic mobility patterns in their residents’ college destinations. For example, in fall 2016 more than 3,000 Californians and 1,500 Floridians enrolled in a college or university located in New York state, representing 1.2% and 1.4% of first-time college enrollment among California and Florida recent high school graduates, respectively. In addition, residents of Mid-Atlantic and New England states demonstrate an affinity for migrating south to attend Florida colleges. Between 1% and 2% of college-going residents of Massachusetts, Vermont, Maine, Delaware, Maryland, Rhode Island, Connecticut, New Hampshire, New Jersey, and the District of Columbia enrolled at a Florida college or university in fall 2016. Despite the geographic distance, at least of subset of these states’ residents were able to overcome spatial and economic constraints when making their college choice.

The District of Columbia also stands out as a geographic outlier in terms of its residents’ college destinations. Despite representing the smallest number of college-going high school graduates of any state—approximately 2,500—District residents exhibit tremendous geographic mobility in where they attend college. With only 18% of residents remaining in-district to attend college, more than 4 out of 5 choose to enroll out-of-district. In fall 2016, approximately 14% of District residents enrolled in a Virginia college or university; 10% each in Pennsylvania, Maryland, and North Carolina; 6% in New York; and 3% each in Massachusetts and Georgia.

The District of Columbia is a case study in financial aid policy that promotes geographic mobility in the college choice process. Established by an act of Congress in 1999, the District of Columbia Tuition Assistance Grant Program (DCTAG) provides eligible District residents a subsidy to attend any of more than 300 participating colleges and universities nationwide at a substantially reduced price, effectively allowing District residents to pay ‘in-state tuition’ at out-of-district institutions. And research suggests that DCTAG was effective in increasing District enrollments at out-of-district participating colleges.

For more insights on the geographic mobility patterns of each state’s first-time college enrollees, scroll through the map gallery below.

Geographic Distribution of First-Time College Enrollees, by State: Fall 2016

Source: Integrated Postsecondary Education Data System (IPEDS), Spring 2017, Fall Enrollment (EF) Survey. Notes: Calculations include all first-time degree/certificate-seeking undergraduate students who graduated from high school in the past 12 mont…

Source: Integrated Postsecondary Education Data System (IPEDS), Spring 2017, Fall Enrollment (EF) Survey. Notes: Calculations include all first-time degree/certificate-seeking undergraduate students who graduated from high school in the past 12 months and attend a U.S. degree-granting postsecondary institution (i.e., awards associate degree or higher) that participates in Title IV federal financial aid programs.