Do Public Flagship Universities Serve Their States' Residents?
Public flagship universities serve many critical roles within their states: as engines of social mobility and economic impact through skills development and postsecondary attainment, as drivers of innovation and technological advancement through scientific research and commercialization, among others. Flagships are generally perceived as ‘prestigious’ or ‘selective’ within their states, and many burnish nationally competitive profiles. Compared to other in-state public colleges and universities, flagships typically exhibit higher graduation rates and receive more per student funding from taxpayers.
Given that flagships find themselves perched atop the hierarchy of state public higher education systems, who is given access? As publicly subsidized educational institutions, should flagships make it their mission to serve primarily residents of their own state?
The following visualizations explore the relationship between residency and enrollment, recently and over time, at the nation’s 50 public flagship universities.
Figure 1 displays the count of in-state students (y-axis) plotted against the count of out-of-state students (x-axis) among the cohort of first-time, degree-seeking domestic students in fall 2016. Flagships with larger in-state and out-of-state enrollments fall higher on the y-axis and farther to the right on the x-axis, respectively. Flagships with the largest incoming cohorts include the University of Texas at Austin (8,266 students), the Pennsylvania State University—Main Campus (7,641 students), and the University of Alabama (7,501 students).
Figure 1. Count of In-State and Out-of-State Enrollments Among First-Time, Degree/Certificate-Seeking Domestic Undergraduate Cohort, by State Flagship University: Fall 2016
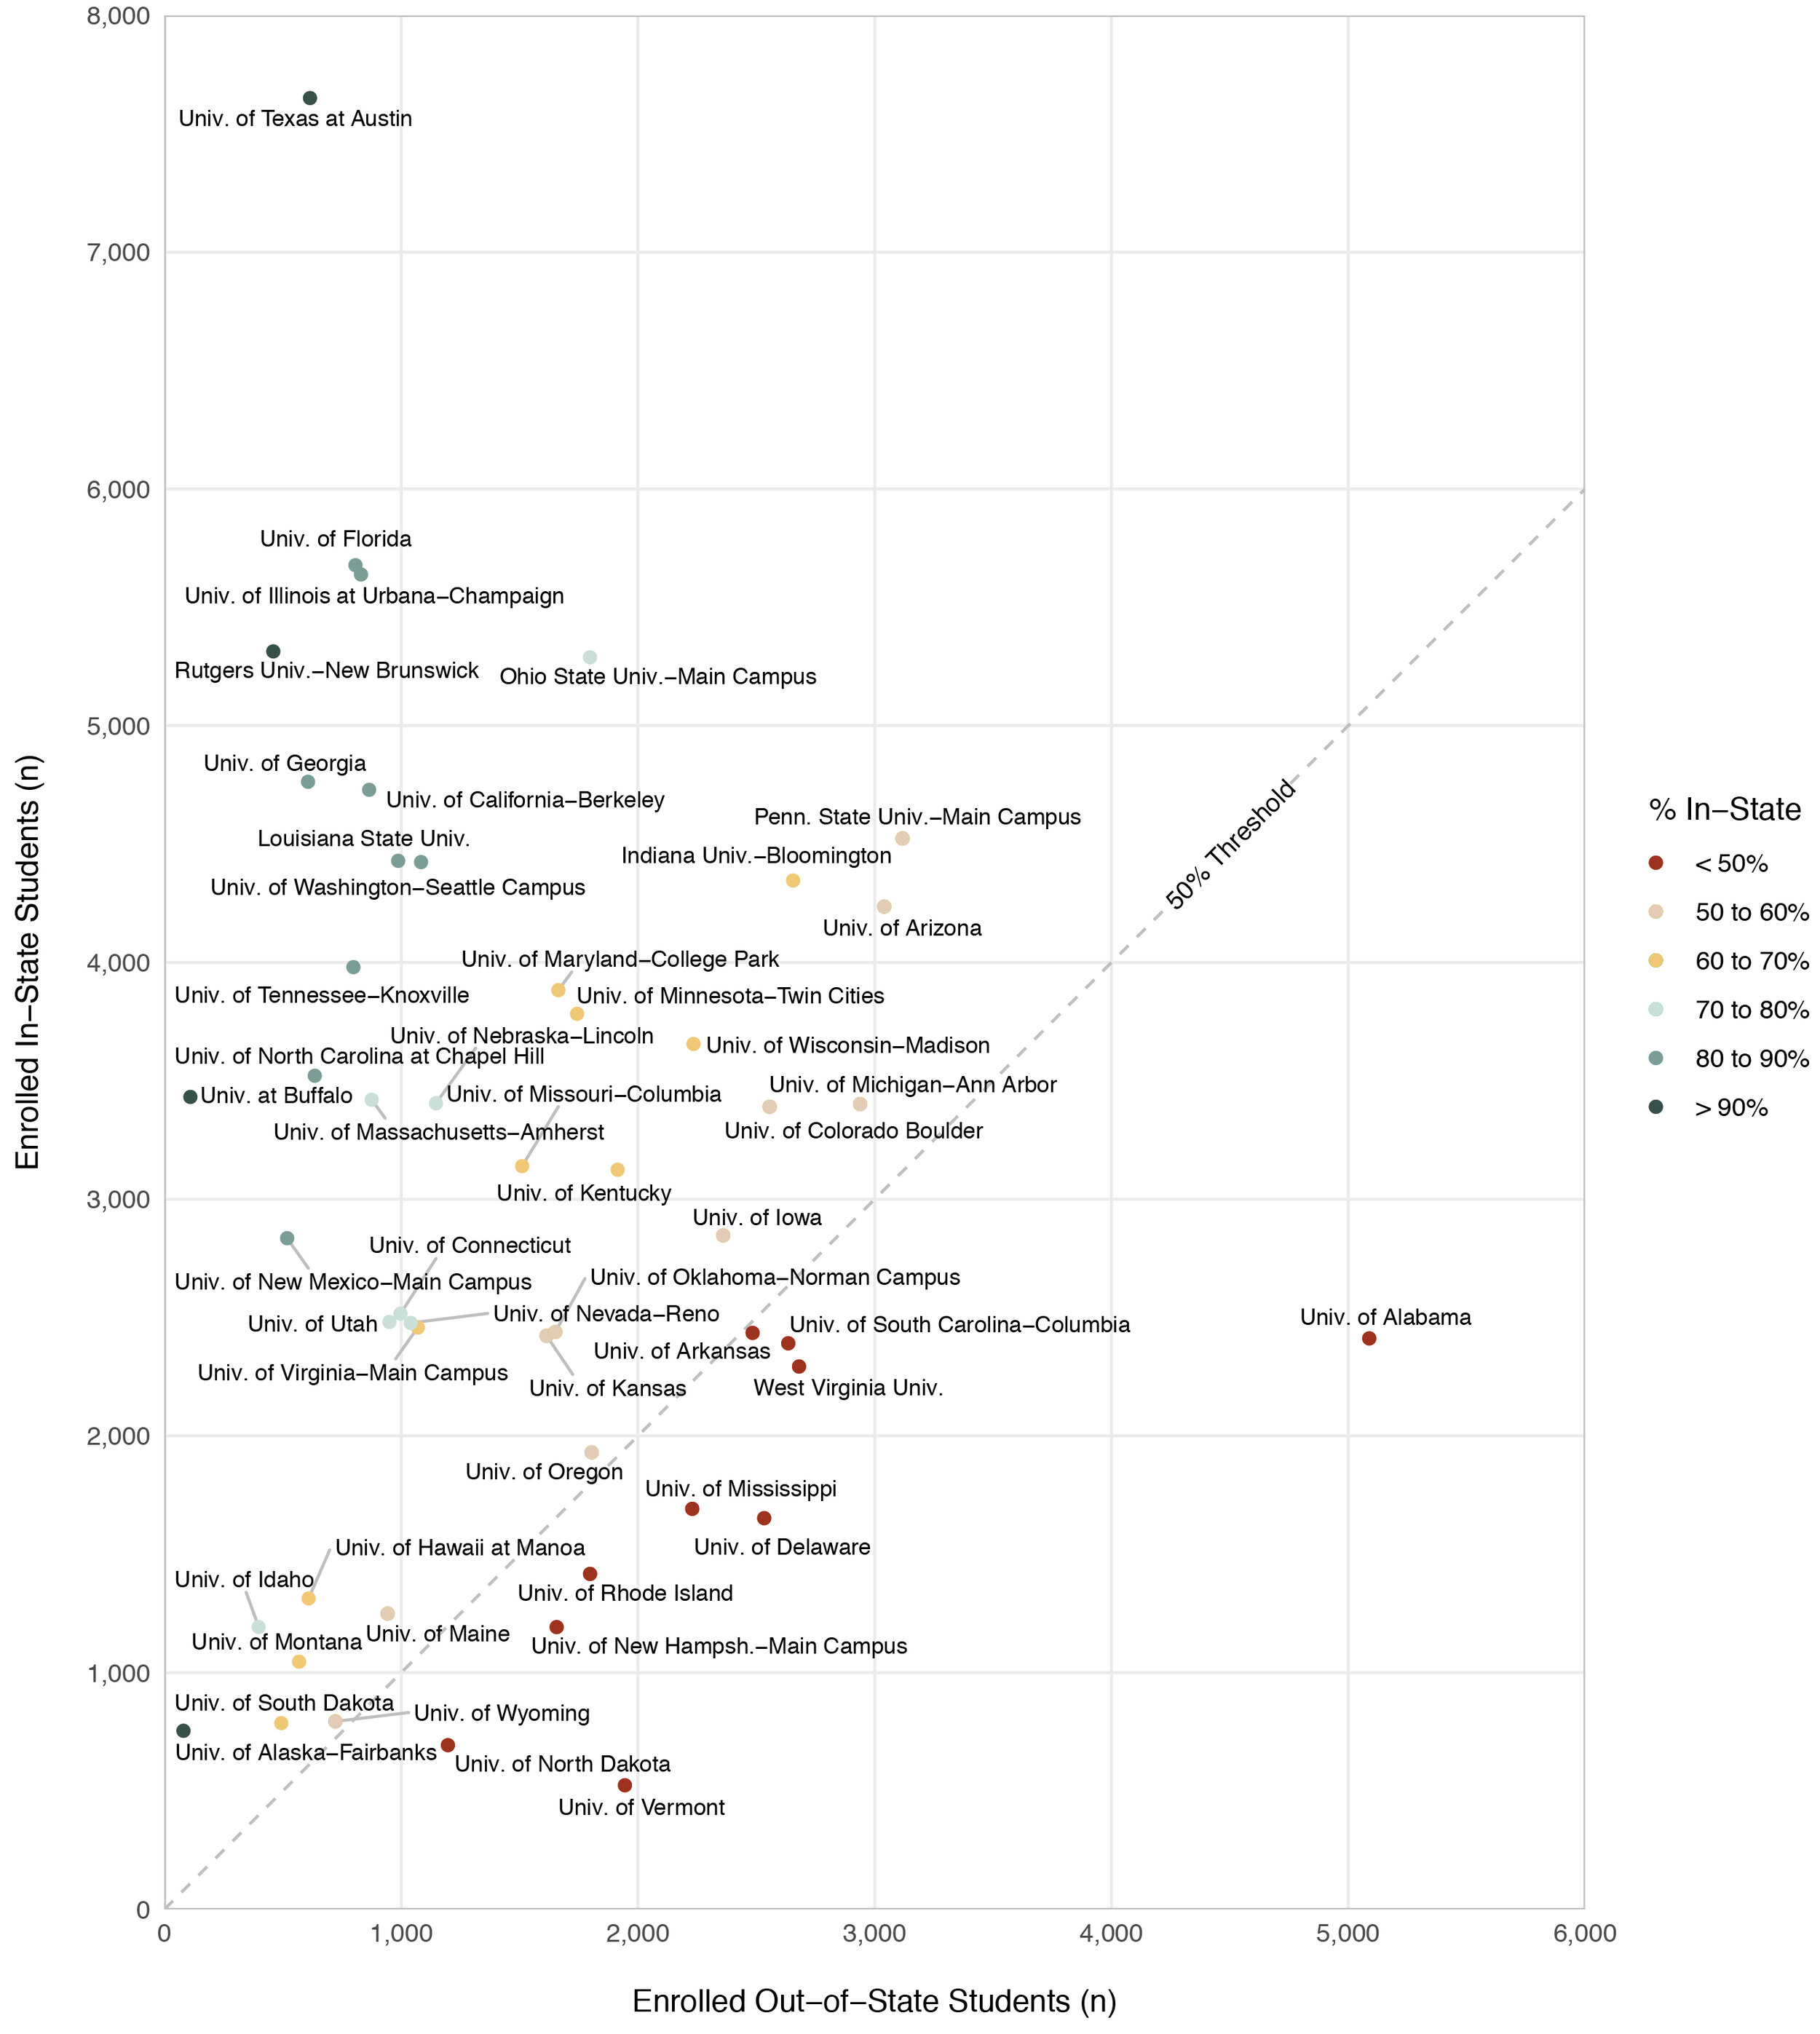
Source: Integrated Postsecondary Education Data System (IPEDS), Spring 2017, Fall Enrollment (EF) Survey. Notes: The roster of state flagship universities is modeled after the institutions listed in College Board’s Trends in College Pricing 2019 report (Figure 7).
In fall 2016, most flagships (40 out of 50) enrolled more in-state than out-of-state students (visualized as points falling to the left of the dashed diagonal line). The remaining minority of flagships (10 out of 50) enrolled more out-of-state than in-state students (points falling to the right of the dashed diagonal line). The share of in-state enrollments at flagships ranged from 21.2% at the University of Vermont (524 Vermonters among an incoming cohort of 2,469 students) to 96.9% at the University at Buffalo (3,432 New Yorkers among an incoming cohort of 3,542 students). Color-coded points provide more detailed information on the share of in-state student enrollments at each flagship (see legend).
How have trends in residency and enrollment changed over time? Figure 2 displays a decade-long trend in the share of in-state enrollments at public flagship universities from fall 2006 to fall 2016. Institutions appear in descending order from the largest to smallest share of in-state enrollments in fall 2016.
Figure 2. Share of In-State Enrollments Among First-Time, Degree/Certificate-Seeking Undergraduate Domestic Cohort, by State Flagship University: Fall 2006 to Fall 2016 (even-numbered years)

Source: Integrated Postsecondary Education Data System (IPEDS), Spring 2007 through 2017, Fall Enrollment (EF) Survey (odd-numbered years).
Between fall 2006 and fall 2016, most flagships maintained a stable share of in-state enrollments (visualized as flat trend lines) regardless of their relative positions (y-axis). For example, Rutgers University-New Brunswick (first row) consistently enrolled more than 90% New Jerseyans among its fall cohorts, and the University of Delaware (last row) consistently enrolled between 35% and 45% Delawareans among its cohorts.
Given the relative stability in the share of in-state enrollments over time, the minority of flagships that demonstrate shifting trends (typically declining) stand out. The University of Maine, the University of Arkansas, and the University of Alabama are among a handful of flagships that exhibit steep declines in the share of in-state enrollments over time.
Figure 3 visualizes the percentage point difference in the share of in-state enrollments between fall 2006 and fall 2016 at the nation’s 50 public flagship universities. In fall 2016, most flagships (38 out of 50) enrolled smaller shares of in-state students than in fall 2006 (visualized as points falling to the left of zero on the x-axis). The remaining 12 flagships enrolled larger shares of in-state students (falling to the right of zero on the x-axis). But only one flagship—the University of Idaho—exhibited an increase of more than 5 percentage points. By contrast, approximately one-quarter of flagships (13 out of 50) exhibited a decrease of more than 10 percentage points.
Figure 3. Percentage Point Difference in Share of In-State Enrollments Among First-Time, Degree/Certificate-Seeking Domestic Undergraduate Cohort, by State Flagship University: Fall 2016 vs. Fall 2006

Source: Integrated Postsecondary Education Data System (IPEDS), Spring 2007 and 2017, Fall Enrollment (EF) Survey.
What explains the observed trends in residency and enrollment at public flagship universities? Flagships may recruit out-of-state students for several reasons: to improve their academic profiles and maximize prestige, to offset stagnant or dwindling enrollments, and to generate tuition revenue at the higher out-of-state rate to counter declining state appropriations.
Some states and university systems have adopted policies that prioritize in-state over out-of-state enrollments. For example, Texas’s longstanding ‘Top 10 Percent Rule’ guarantees admission to its most selective public universities (including the University of Texas at Austin) based on residents’ high school class rank. And in 2017, the University of California (UC) system capped out-of-state undergraduate enrollments at 18% for five UC campuses, and UC Berkeley, UCLA, UC Irvine, and UC San Diego are not permitted to exceed their 2017-18 out-of-state levels.
By contrast, some flagships have built enrollment management strategies around recruiting out-of-state students. For example, the University of Arkansas offers the New Arkansan Non-Resident Tuition Award (NRTA), a merit-based scholarship for incoming freshmen from neighboring states that covers up to 90% of the difference between in-state and out-of-state tuition, and in 2017 expanded the program to include all 50 states and the District of Columbia with its ‘Extended States’ NRTA.
The University of Alabama also stands out for its steep decline in the share of in-state enrollments among incoming cohorts, falling approximately 35 percentage points from fall 2006 (66.6%) to fall 2016 (32.2%). A recent research report highlights Alabama’s aggressive out-of-state recruitment activities: spending millions of dollars in the 2010s to purchase prospective ‘student lists’ from testing companies and conducting approximately 4,000 out-of-state recruiting visits in 2017 (more than 90% of Alabama’s total visits).
If the majority of Alabama’s incoming students are increasingly nonresidents, where do they come from? Figure 4 presents a map gallery spanning fall 2006 to fall 2016 (even-numbered years) and shows the proportion of Alabama’s incoming cohorts by state of residence at the time of admission. For example, among Alabama’s 4,349 first-time, degree-seeking students in fall 2006, 66.6% were Alabamans and 9.4% were Georgians (geographic neighbors). Scroll through the map gallery below to explore how geographic enrollment patterns at the University of Alabama have changed over the decade.
Figure 4. Share of First-time, Degree/Certificate-Seeking Domestic Undergraduate Cohort at University of Alabama, by State of Residence: Fall 2006 to Fall 2016 (even-numbered years)

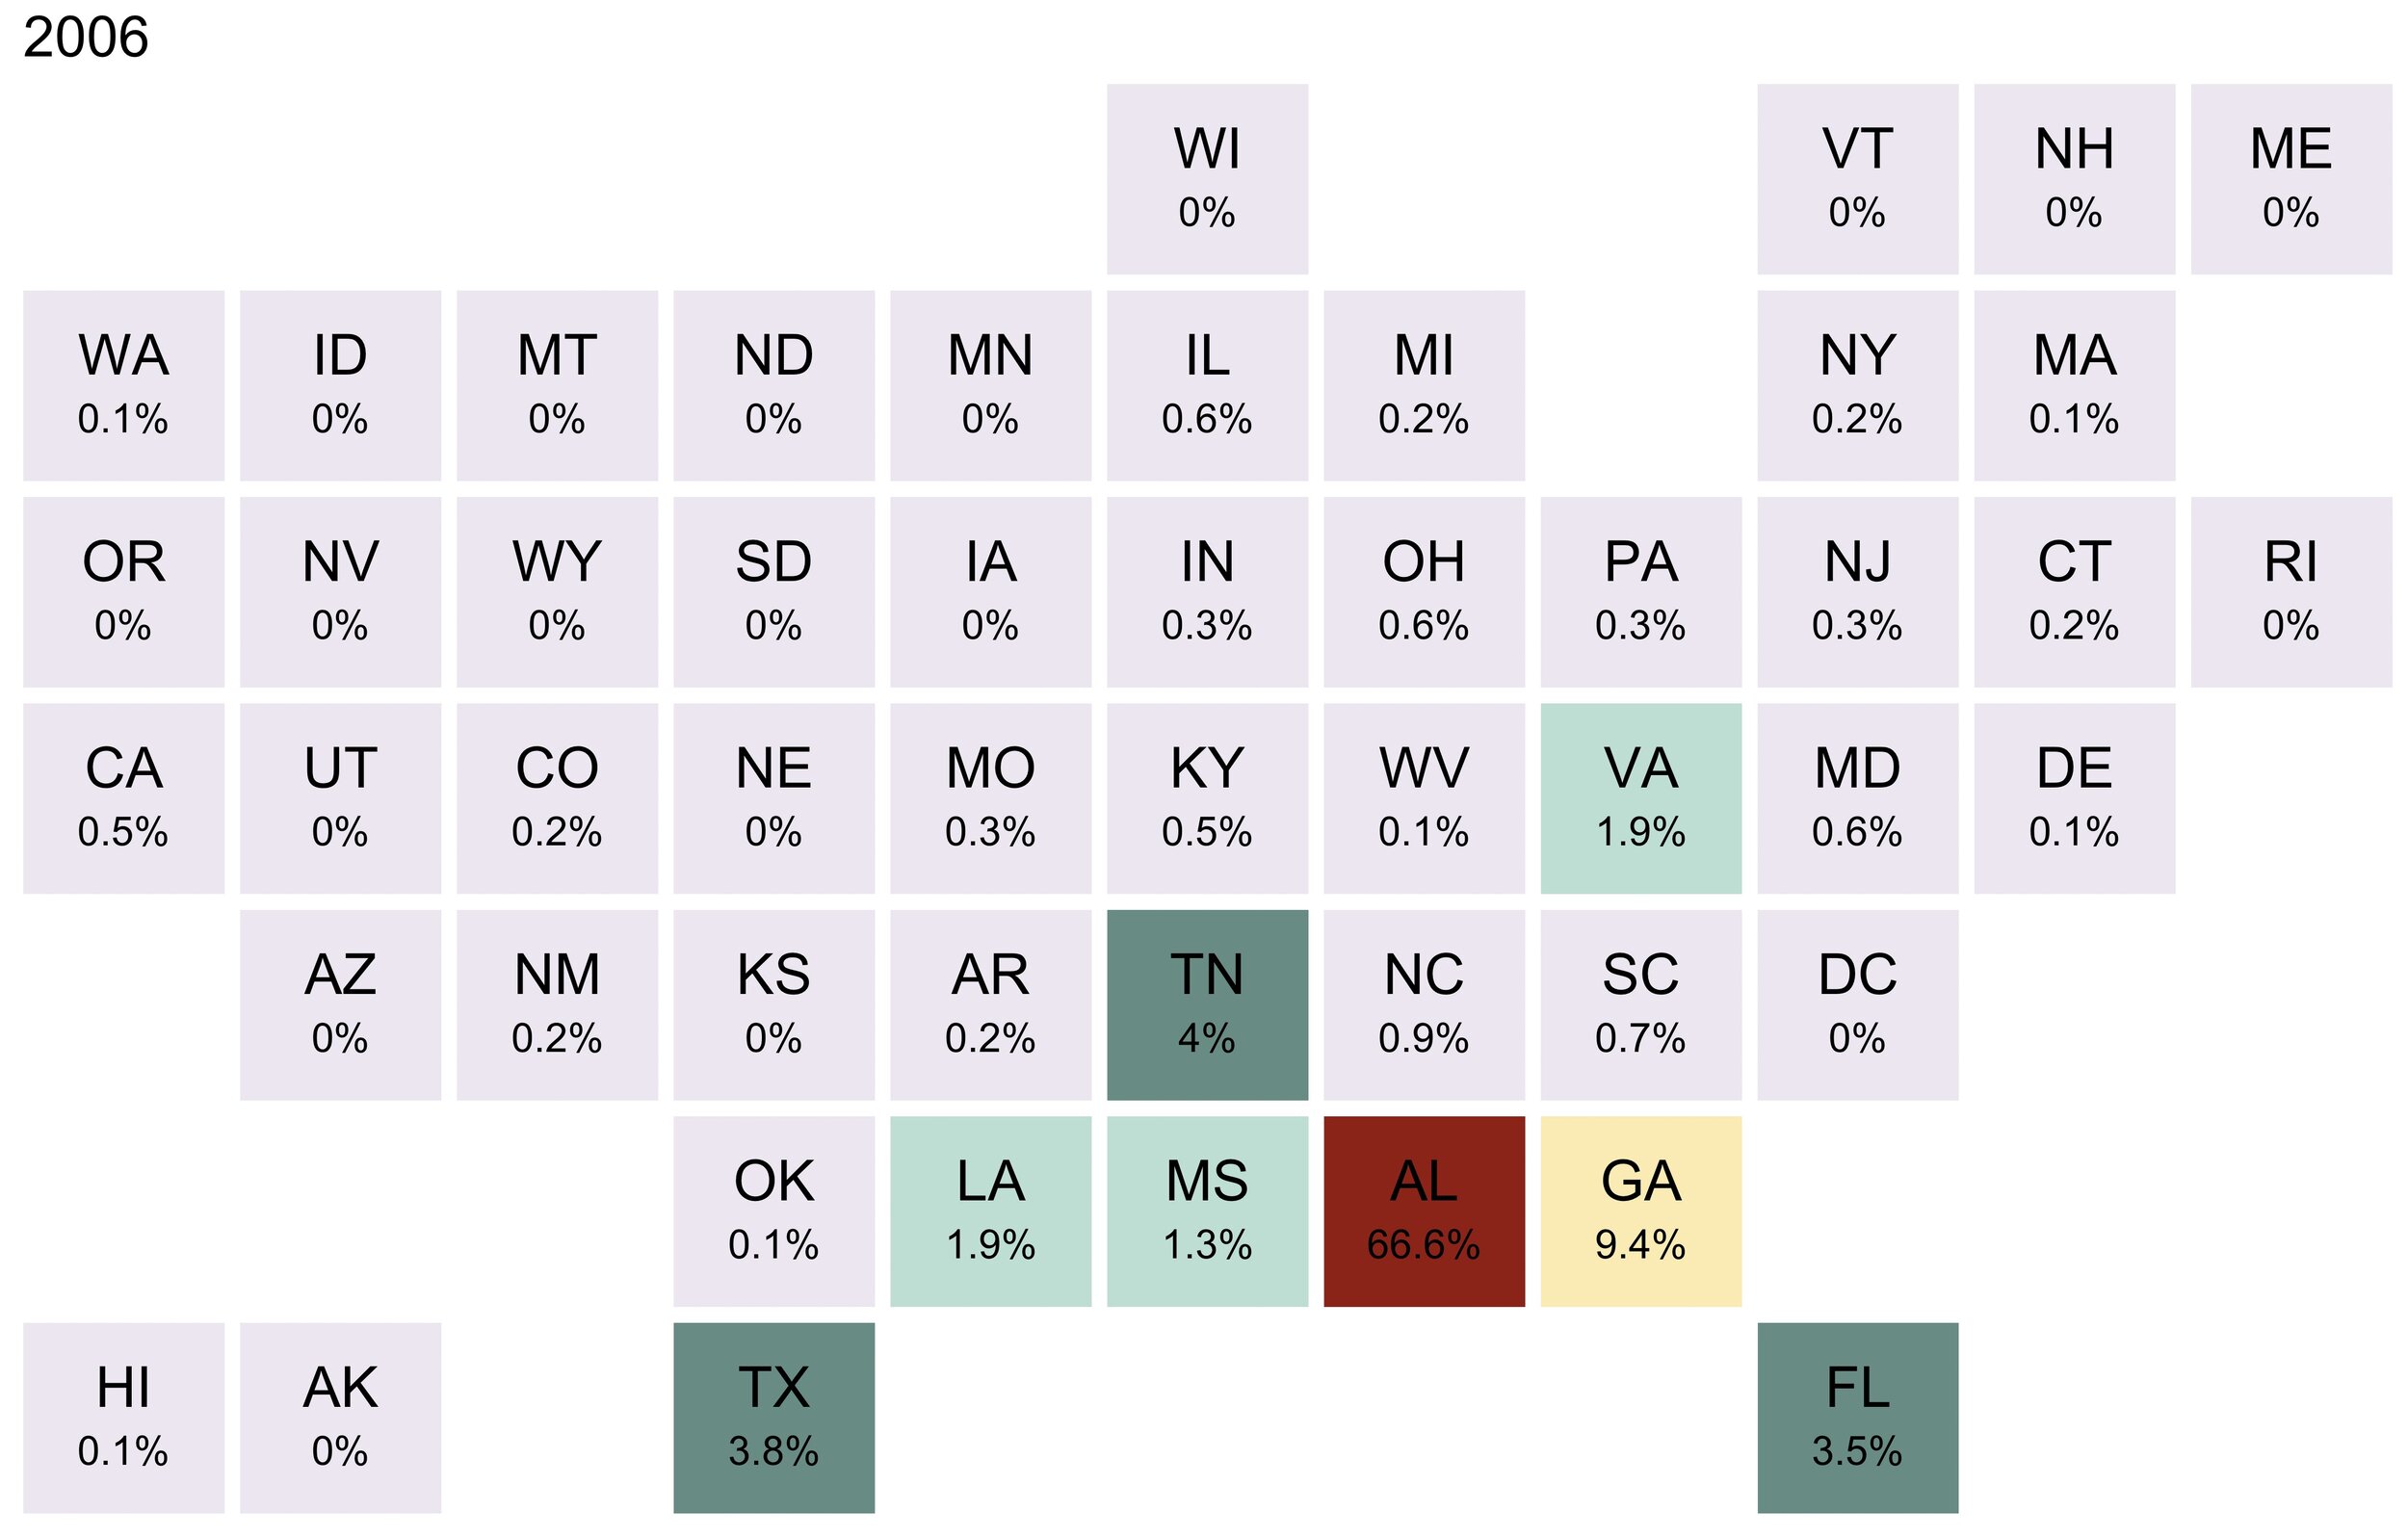
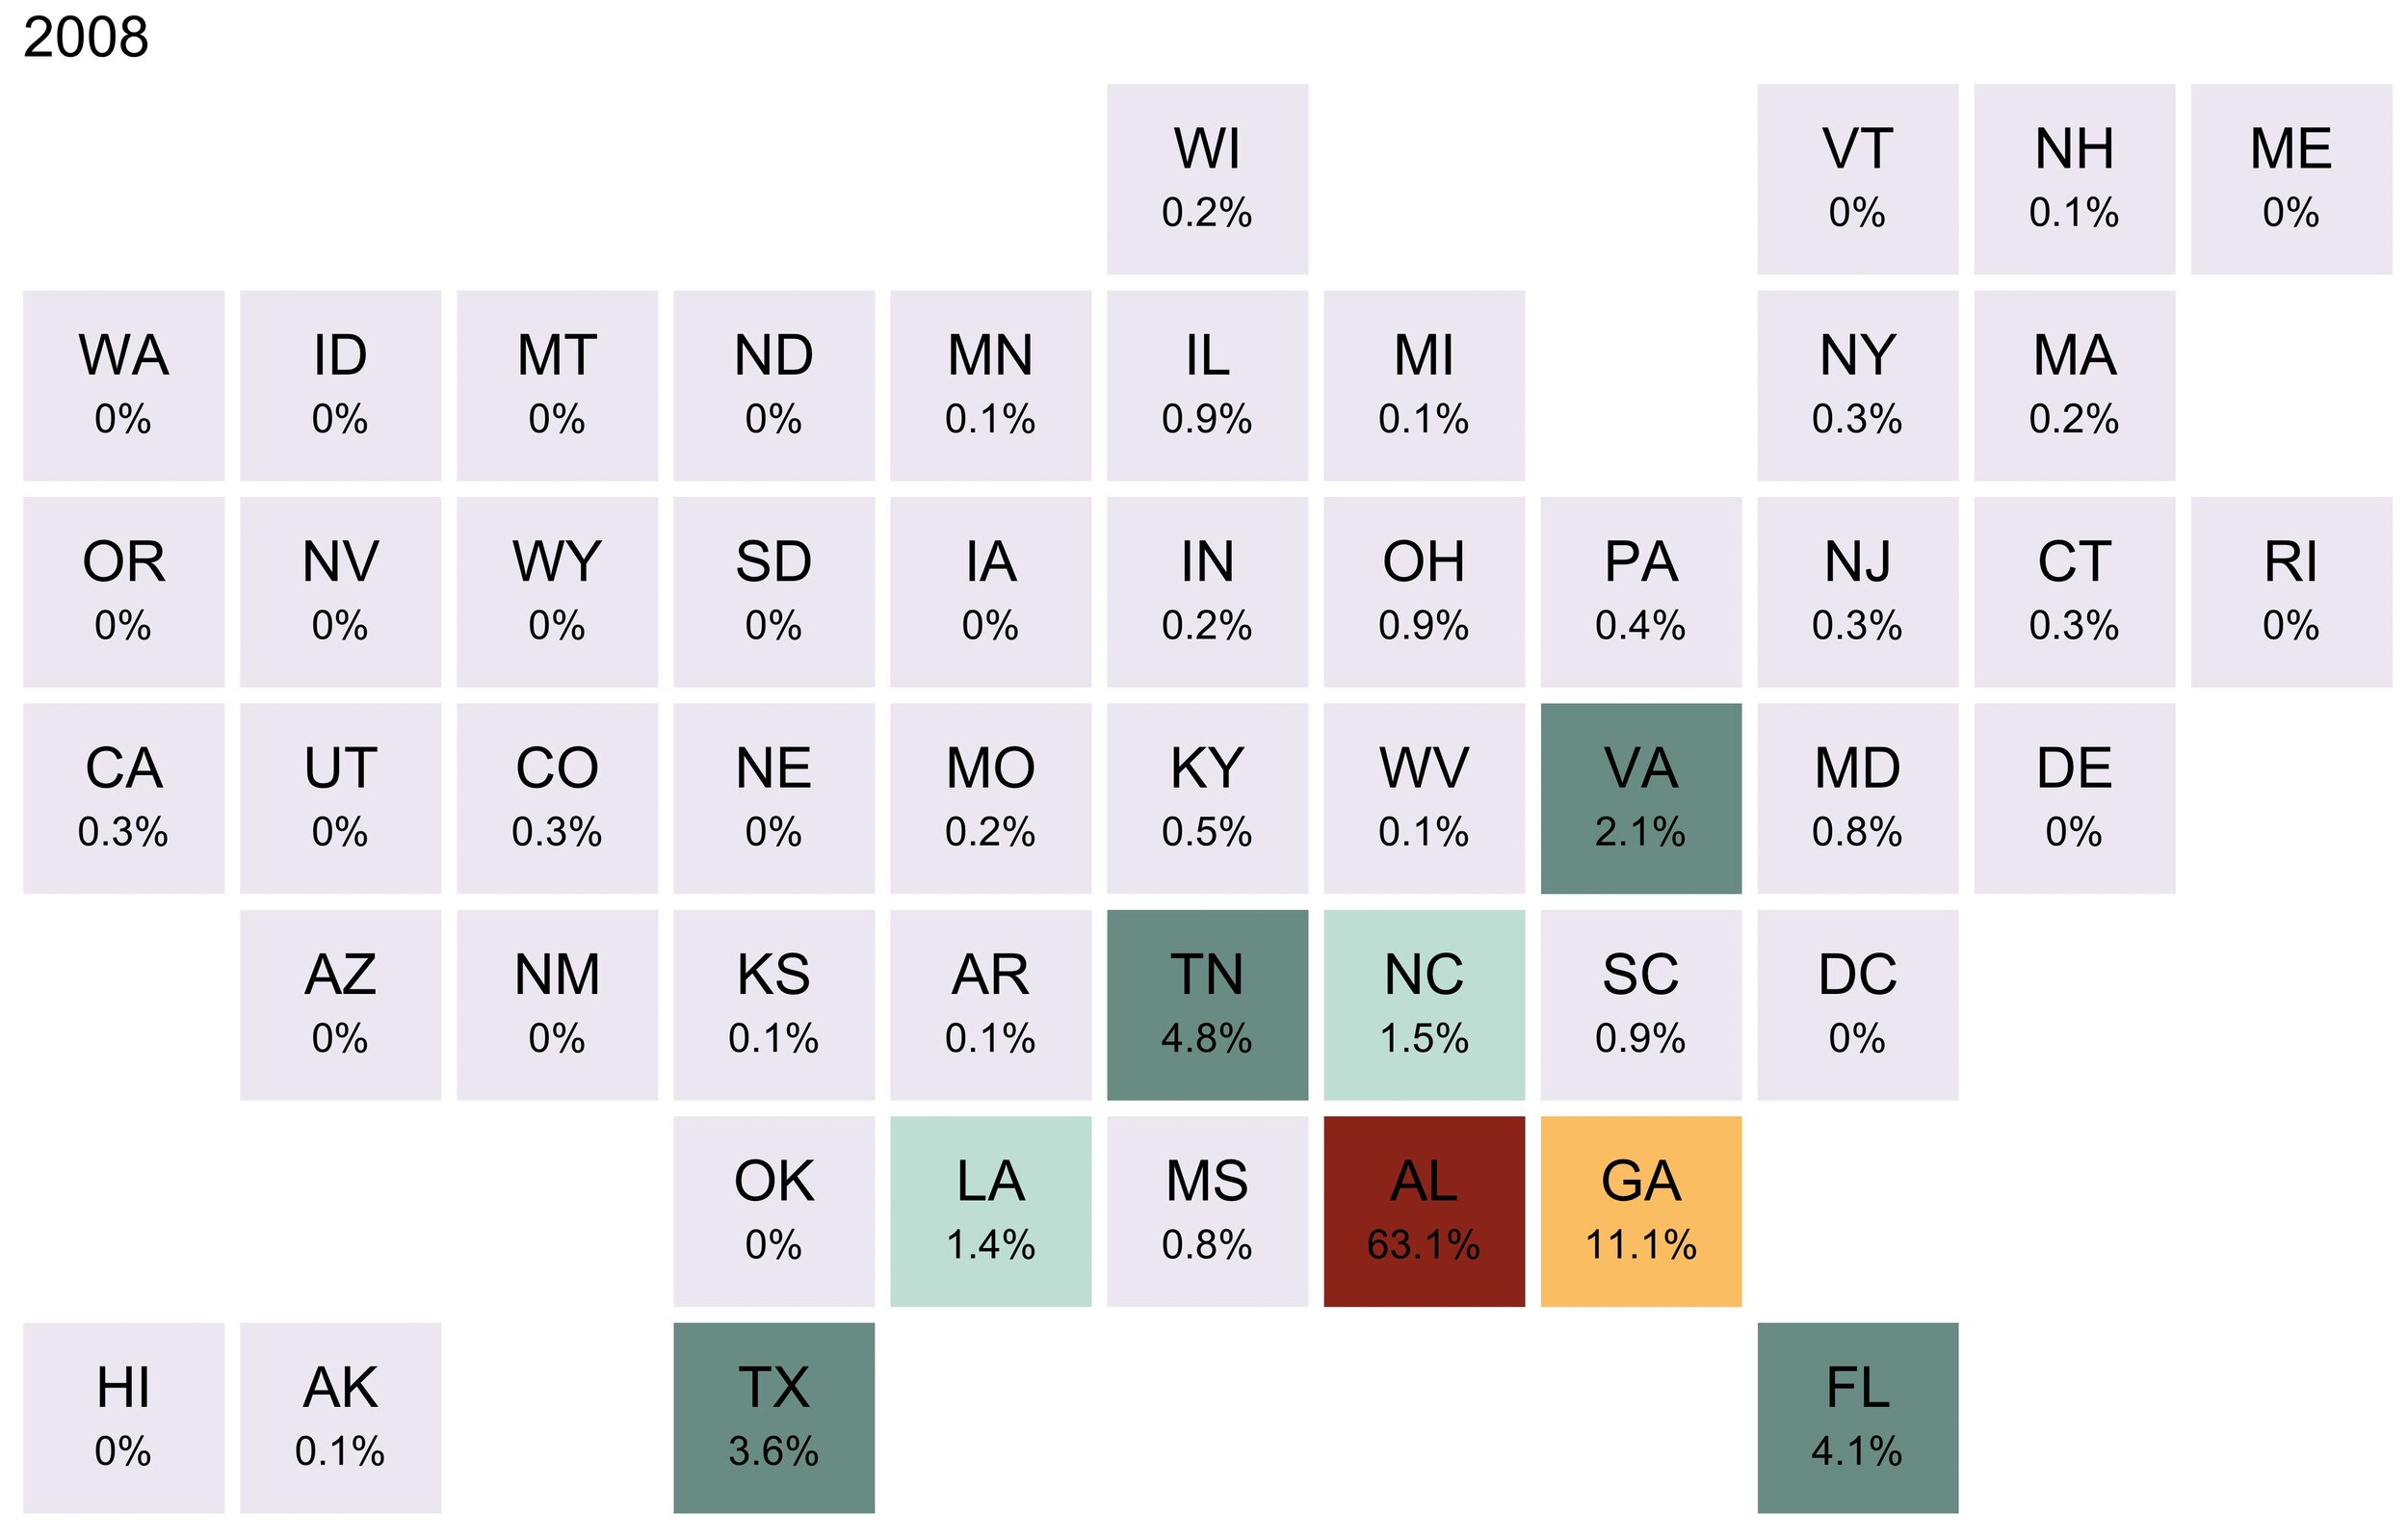
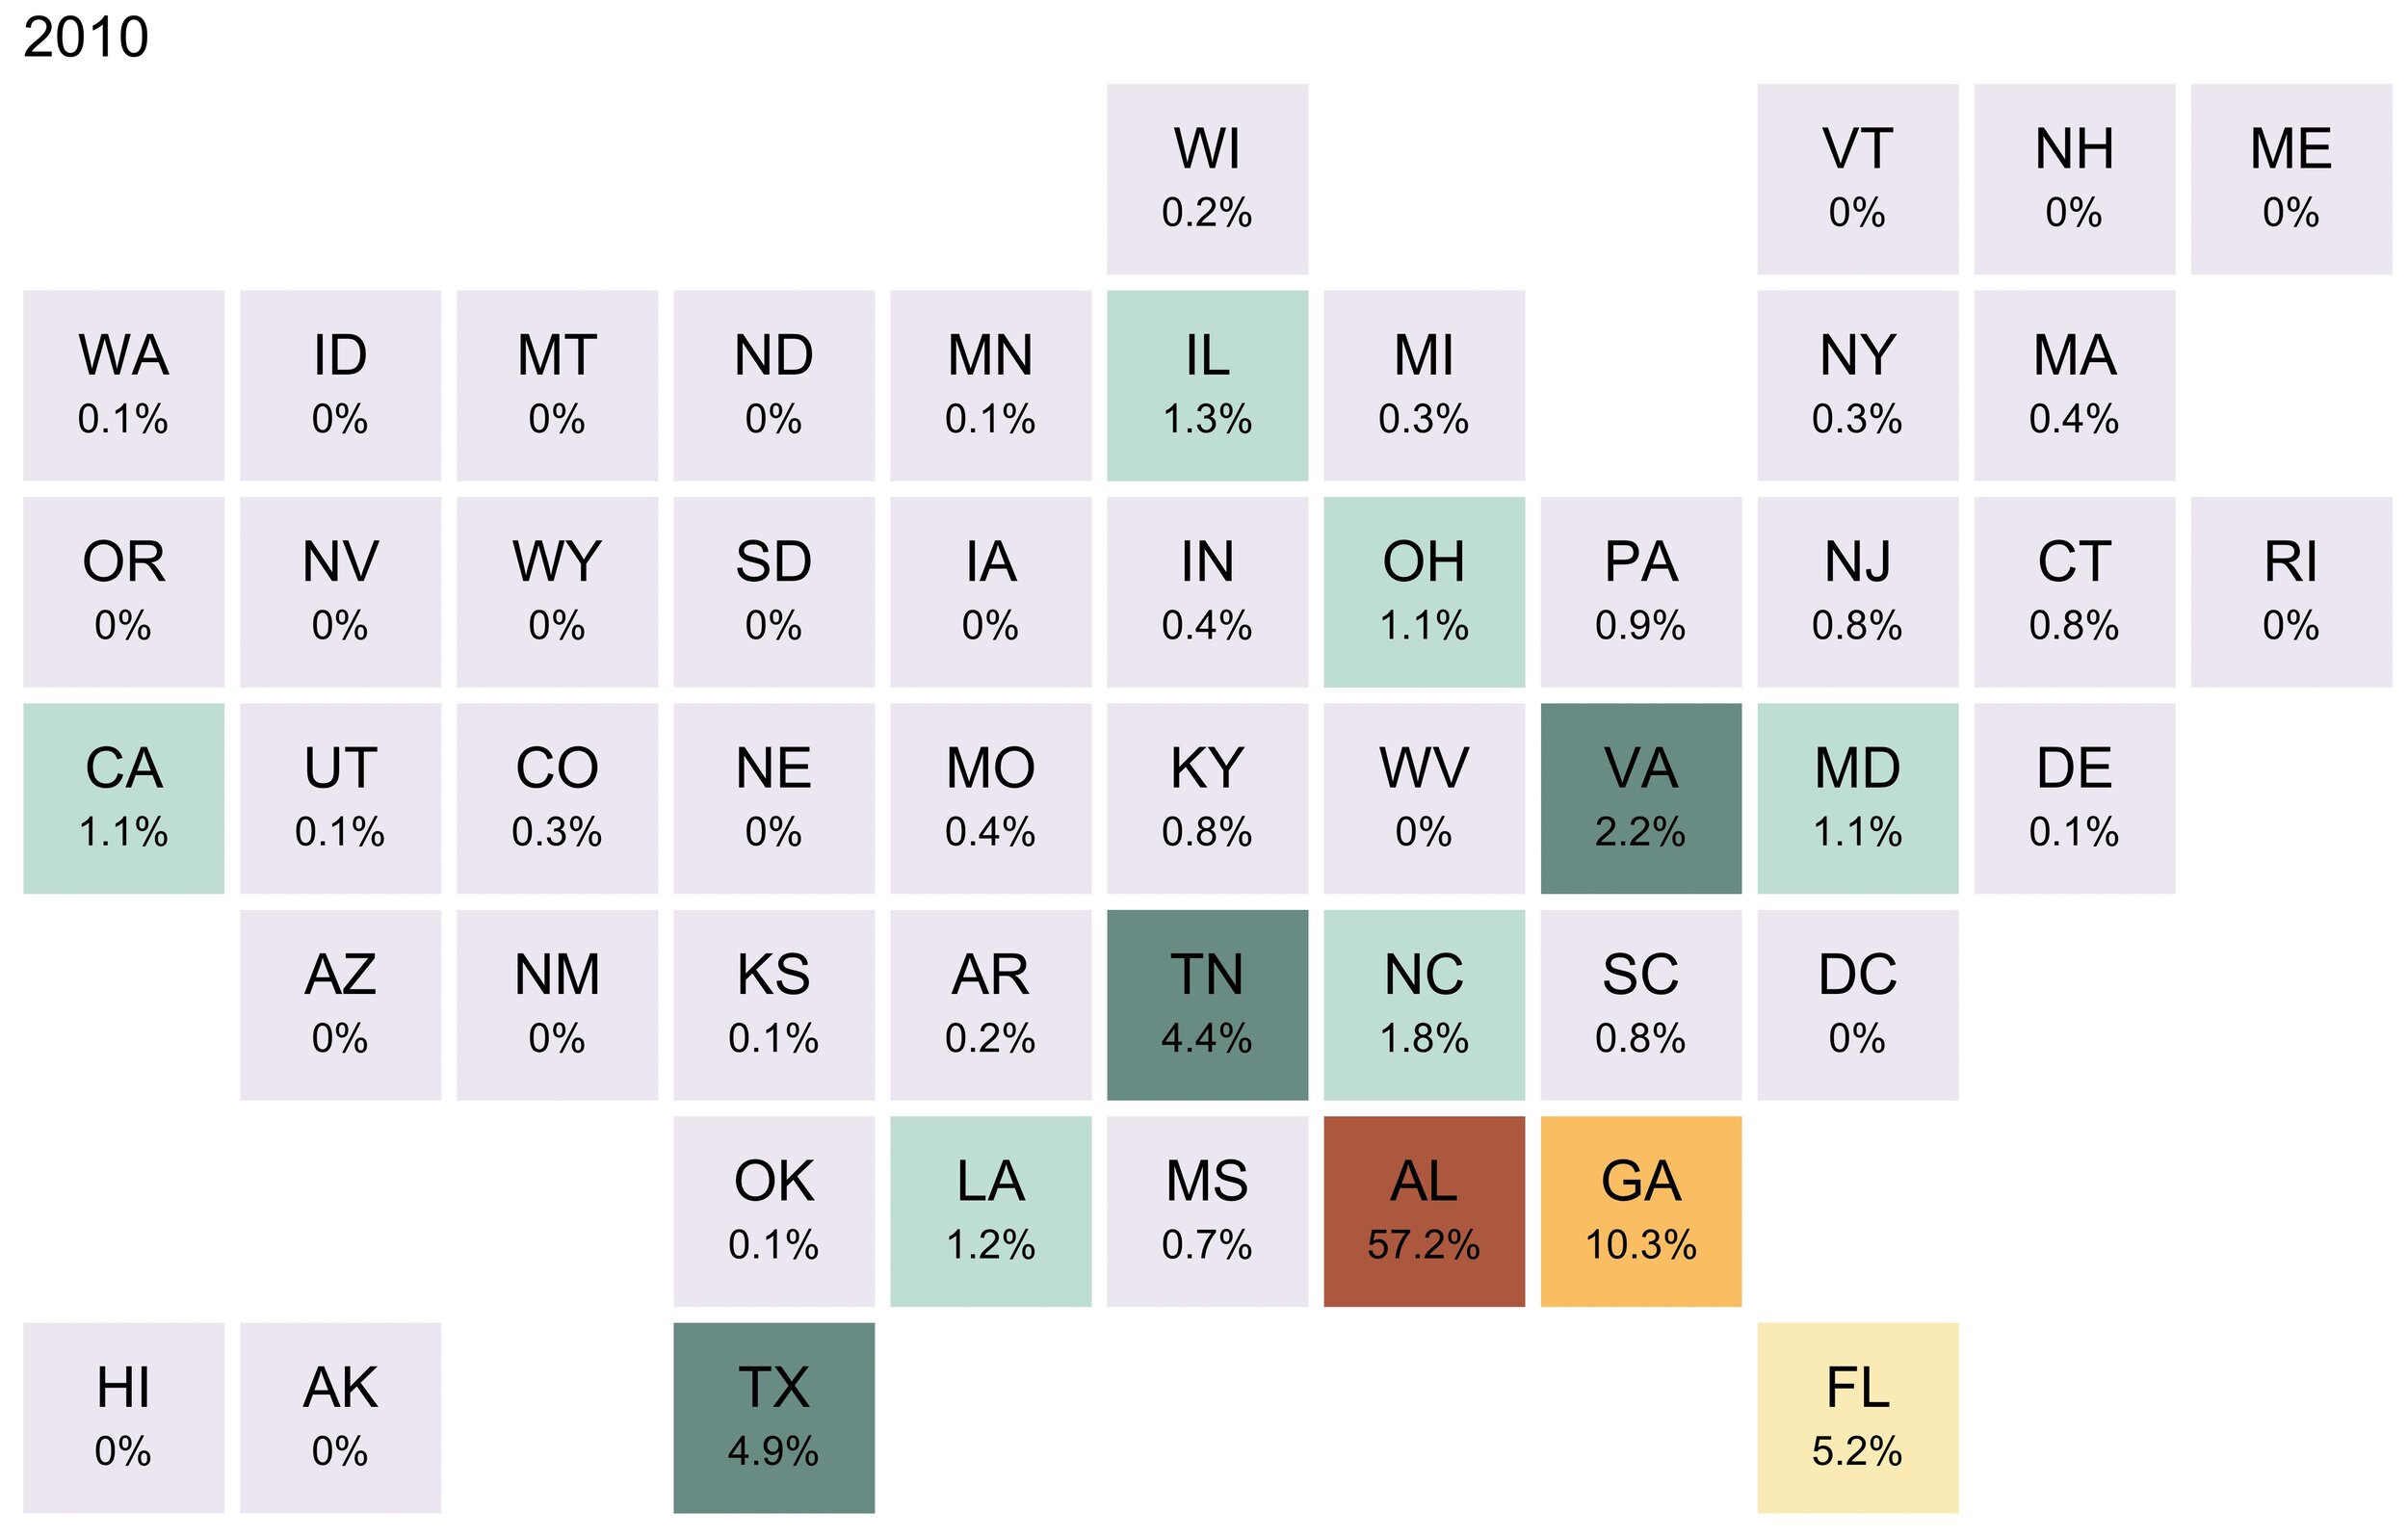
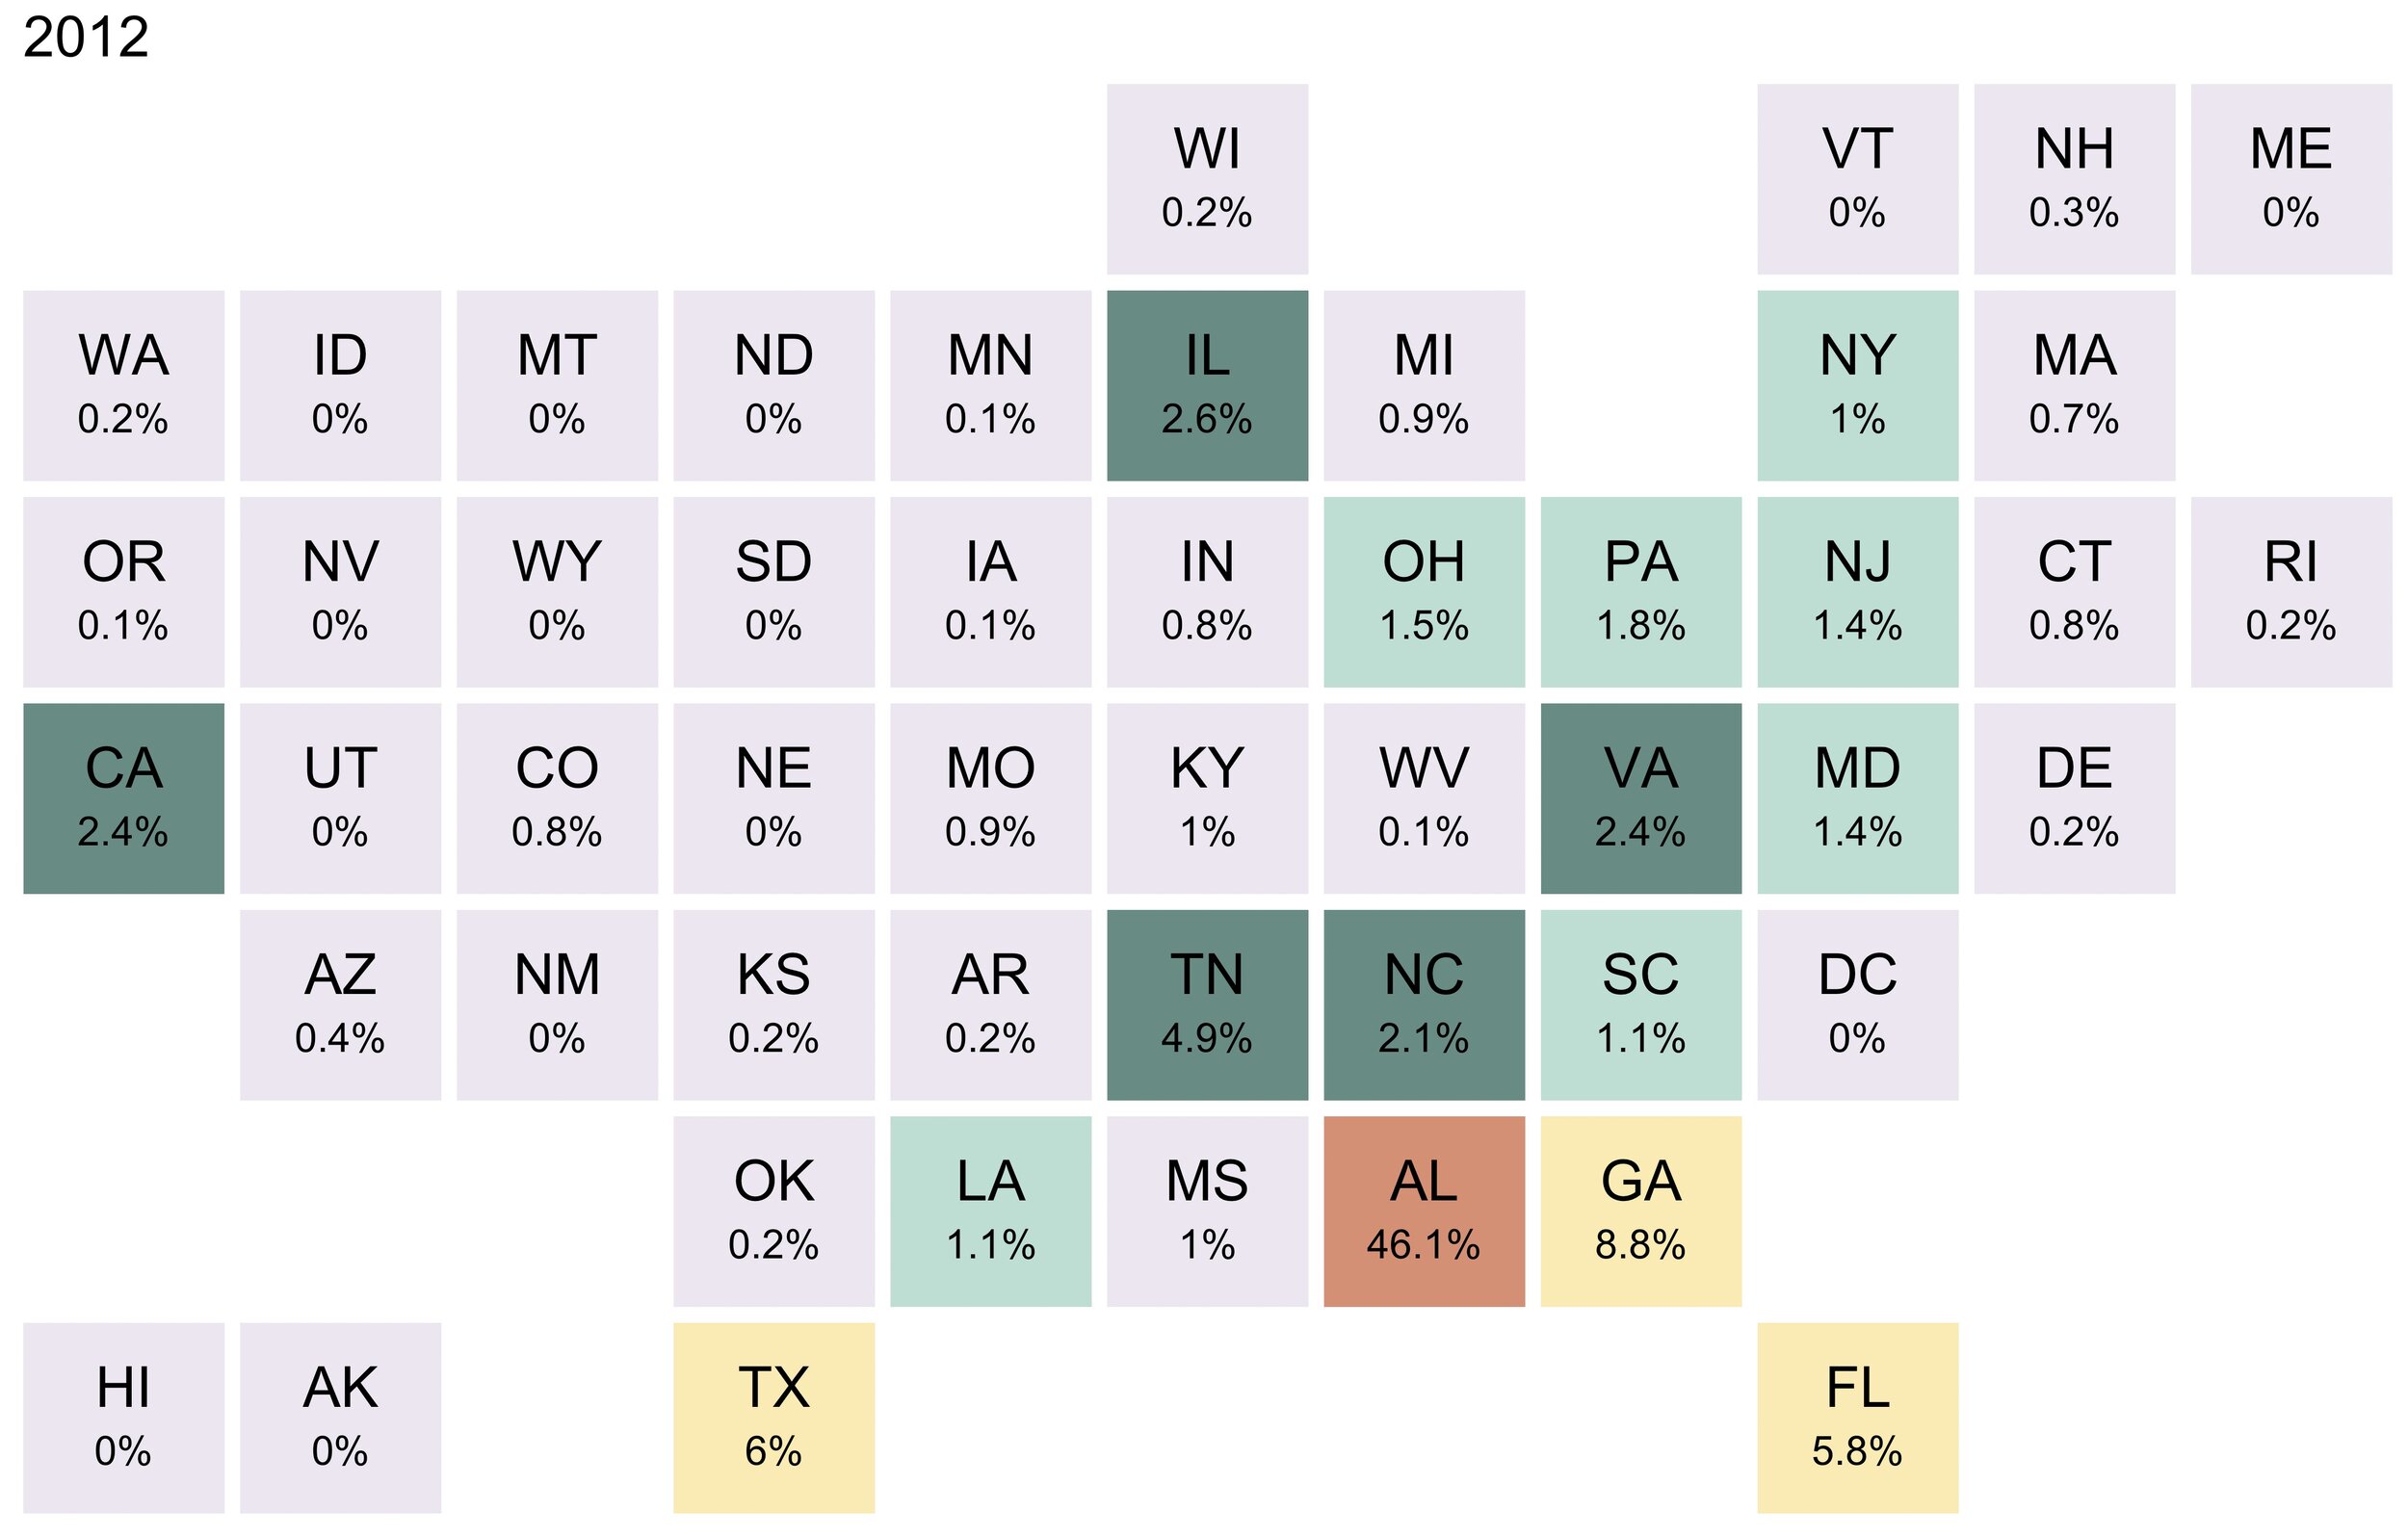
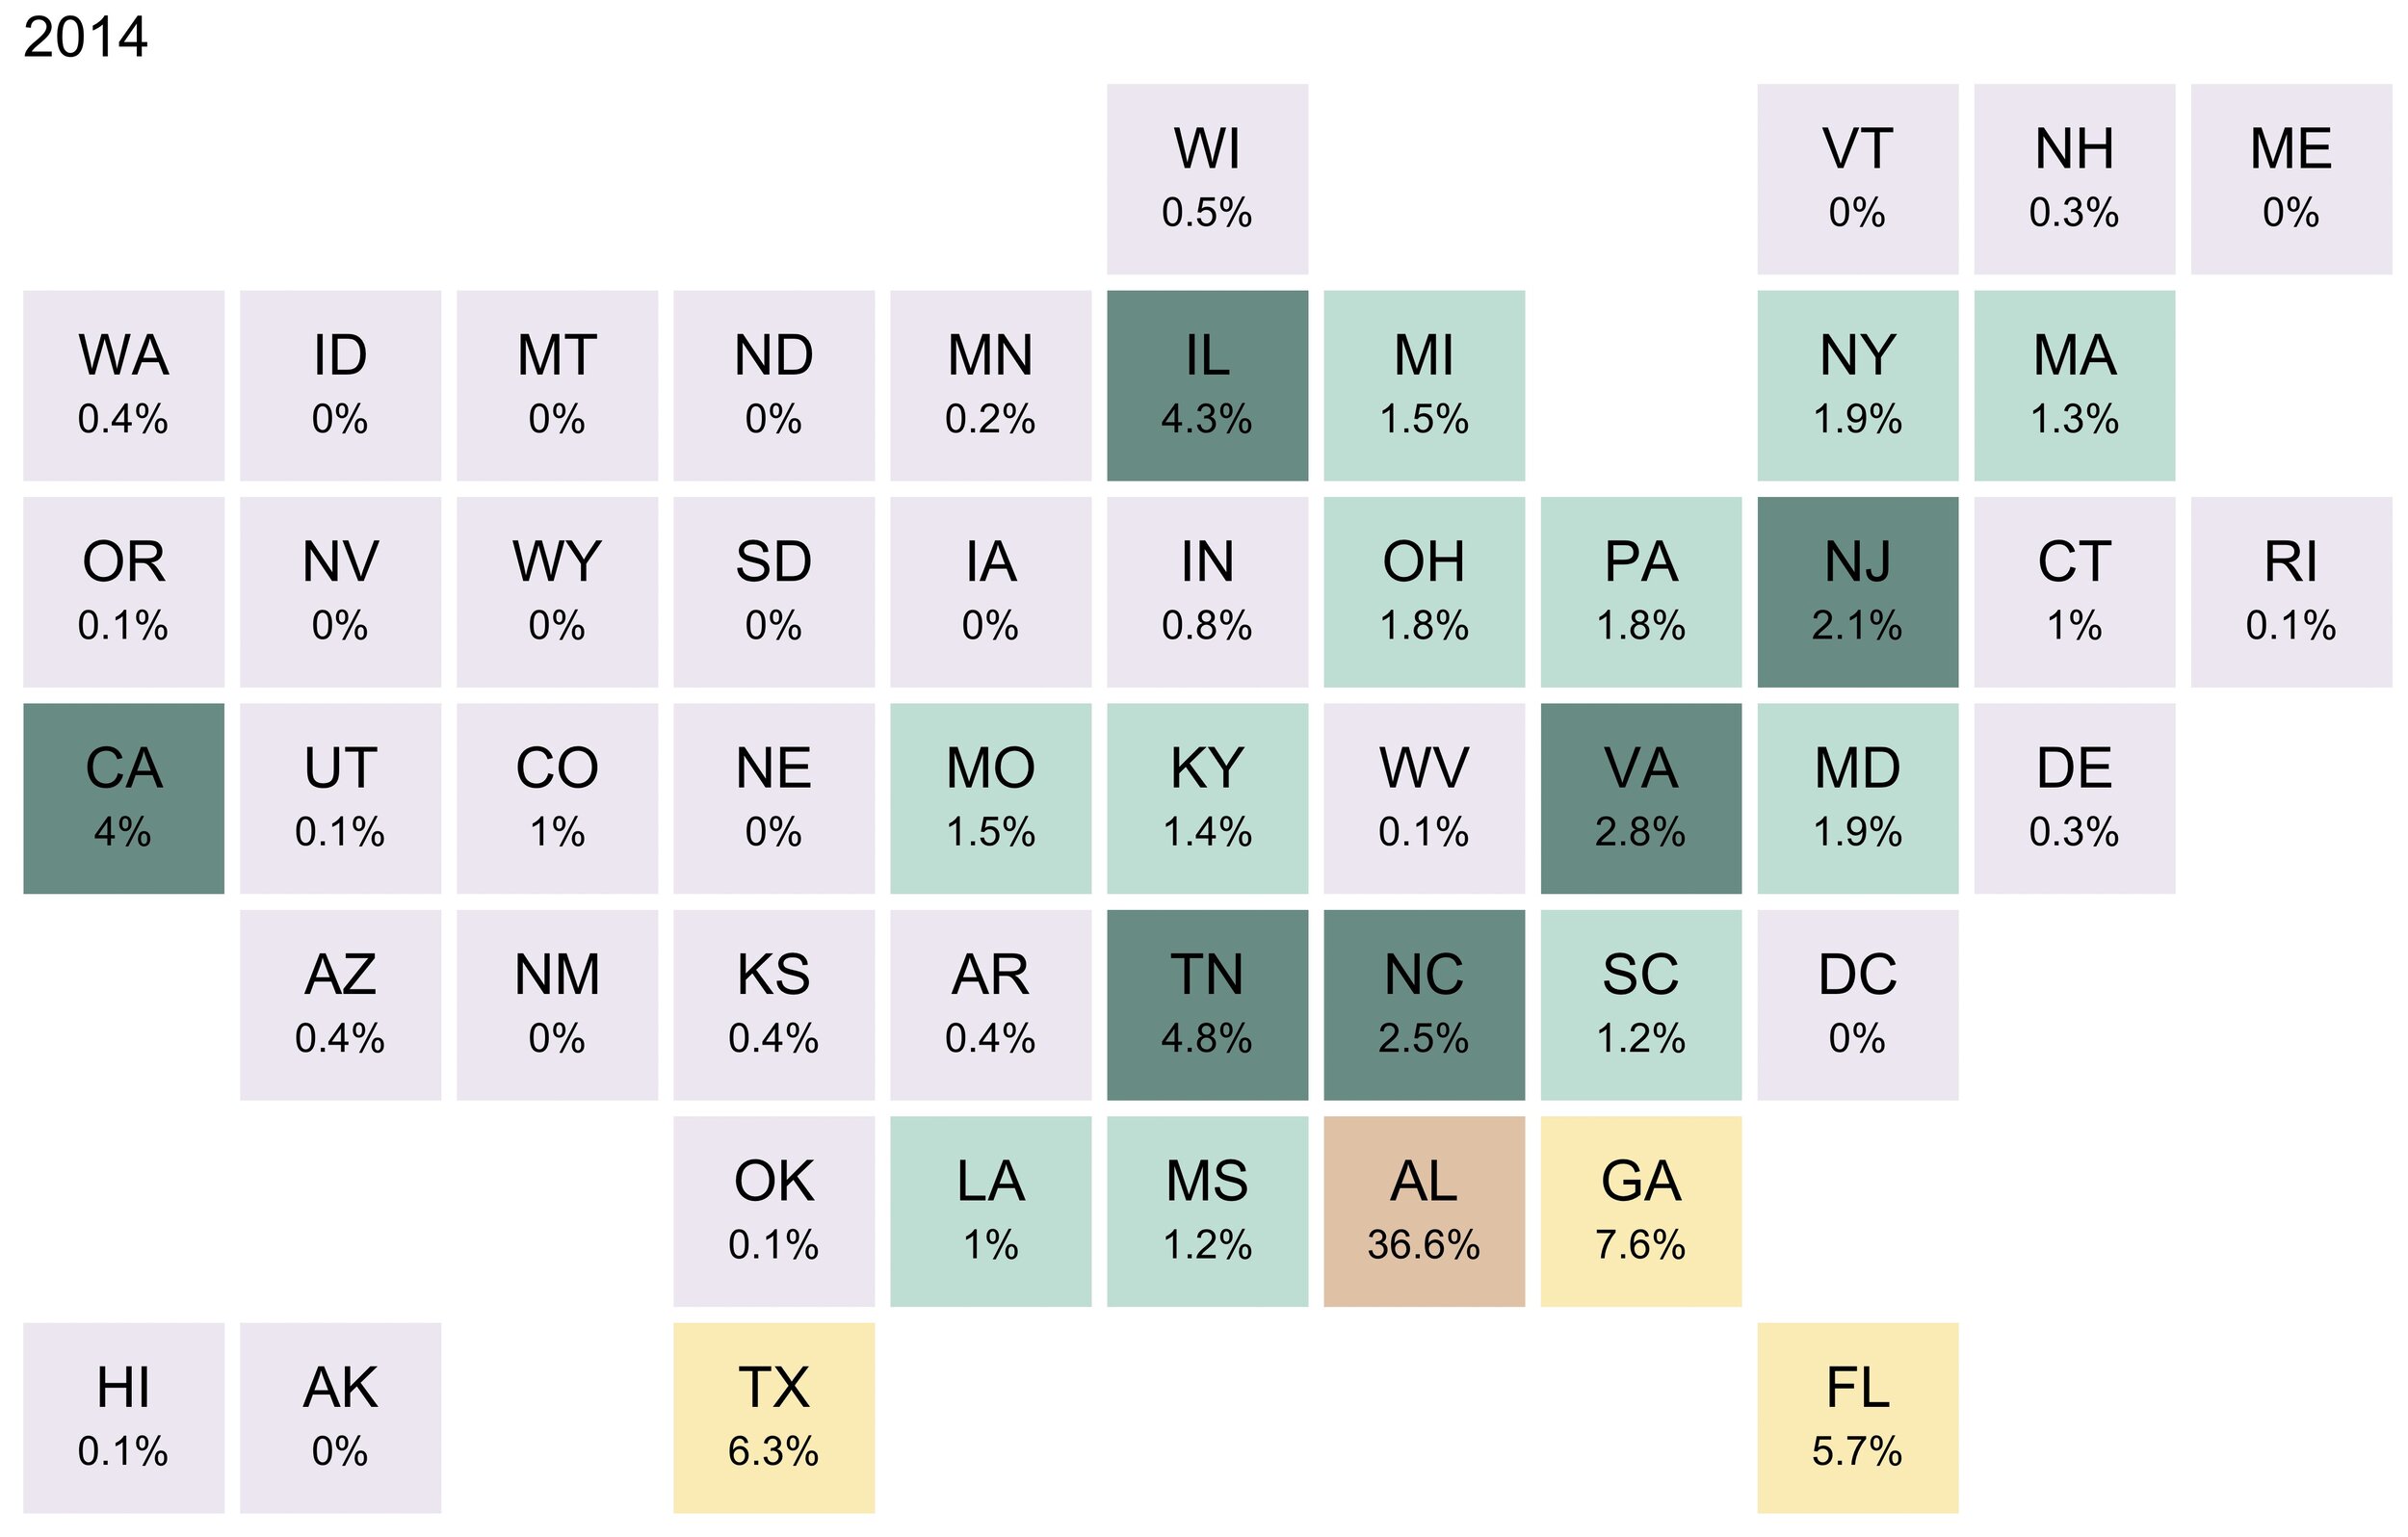
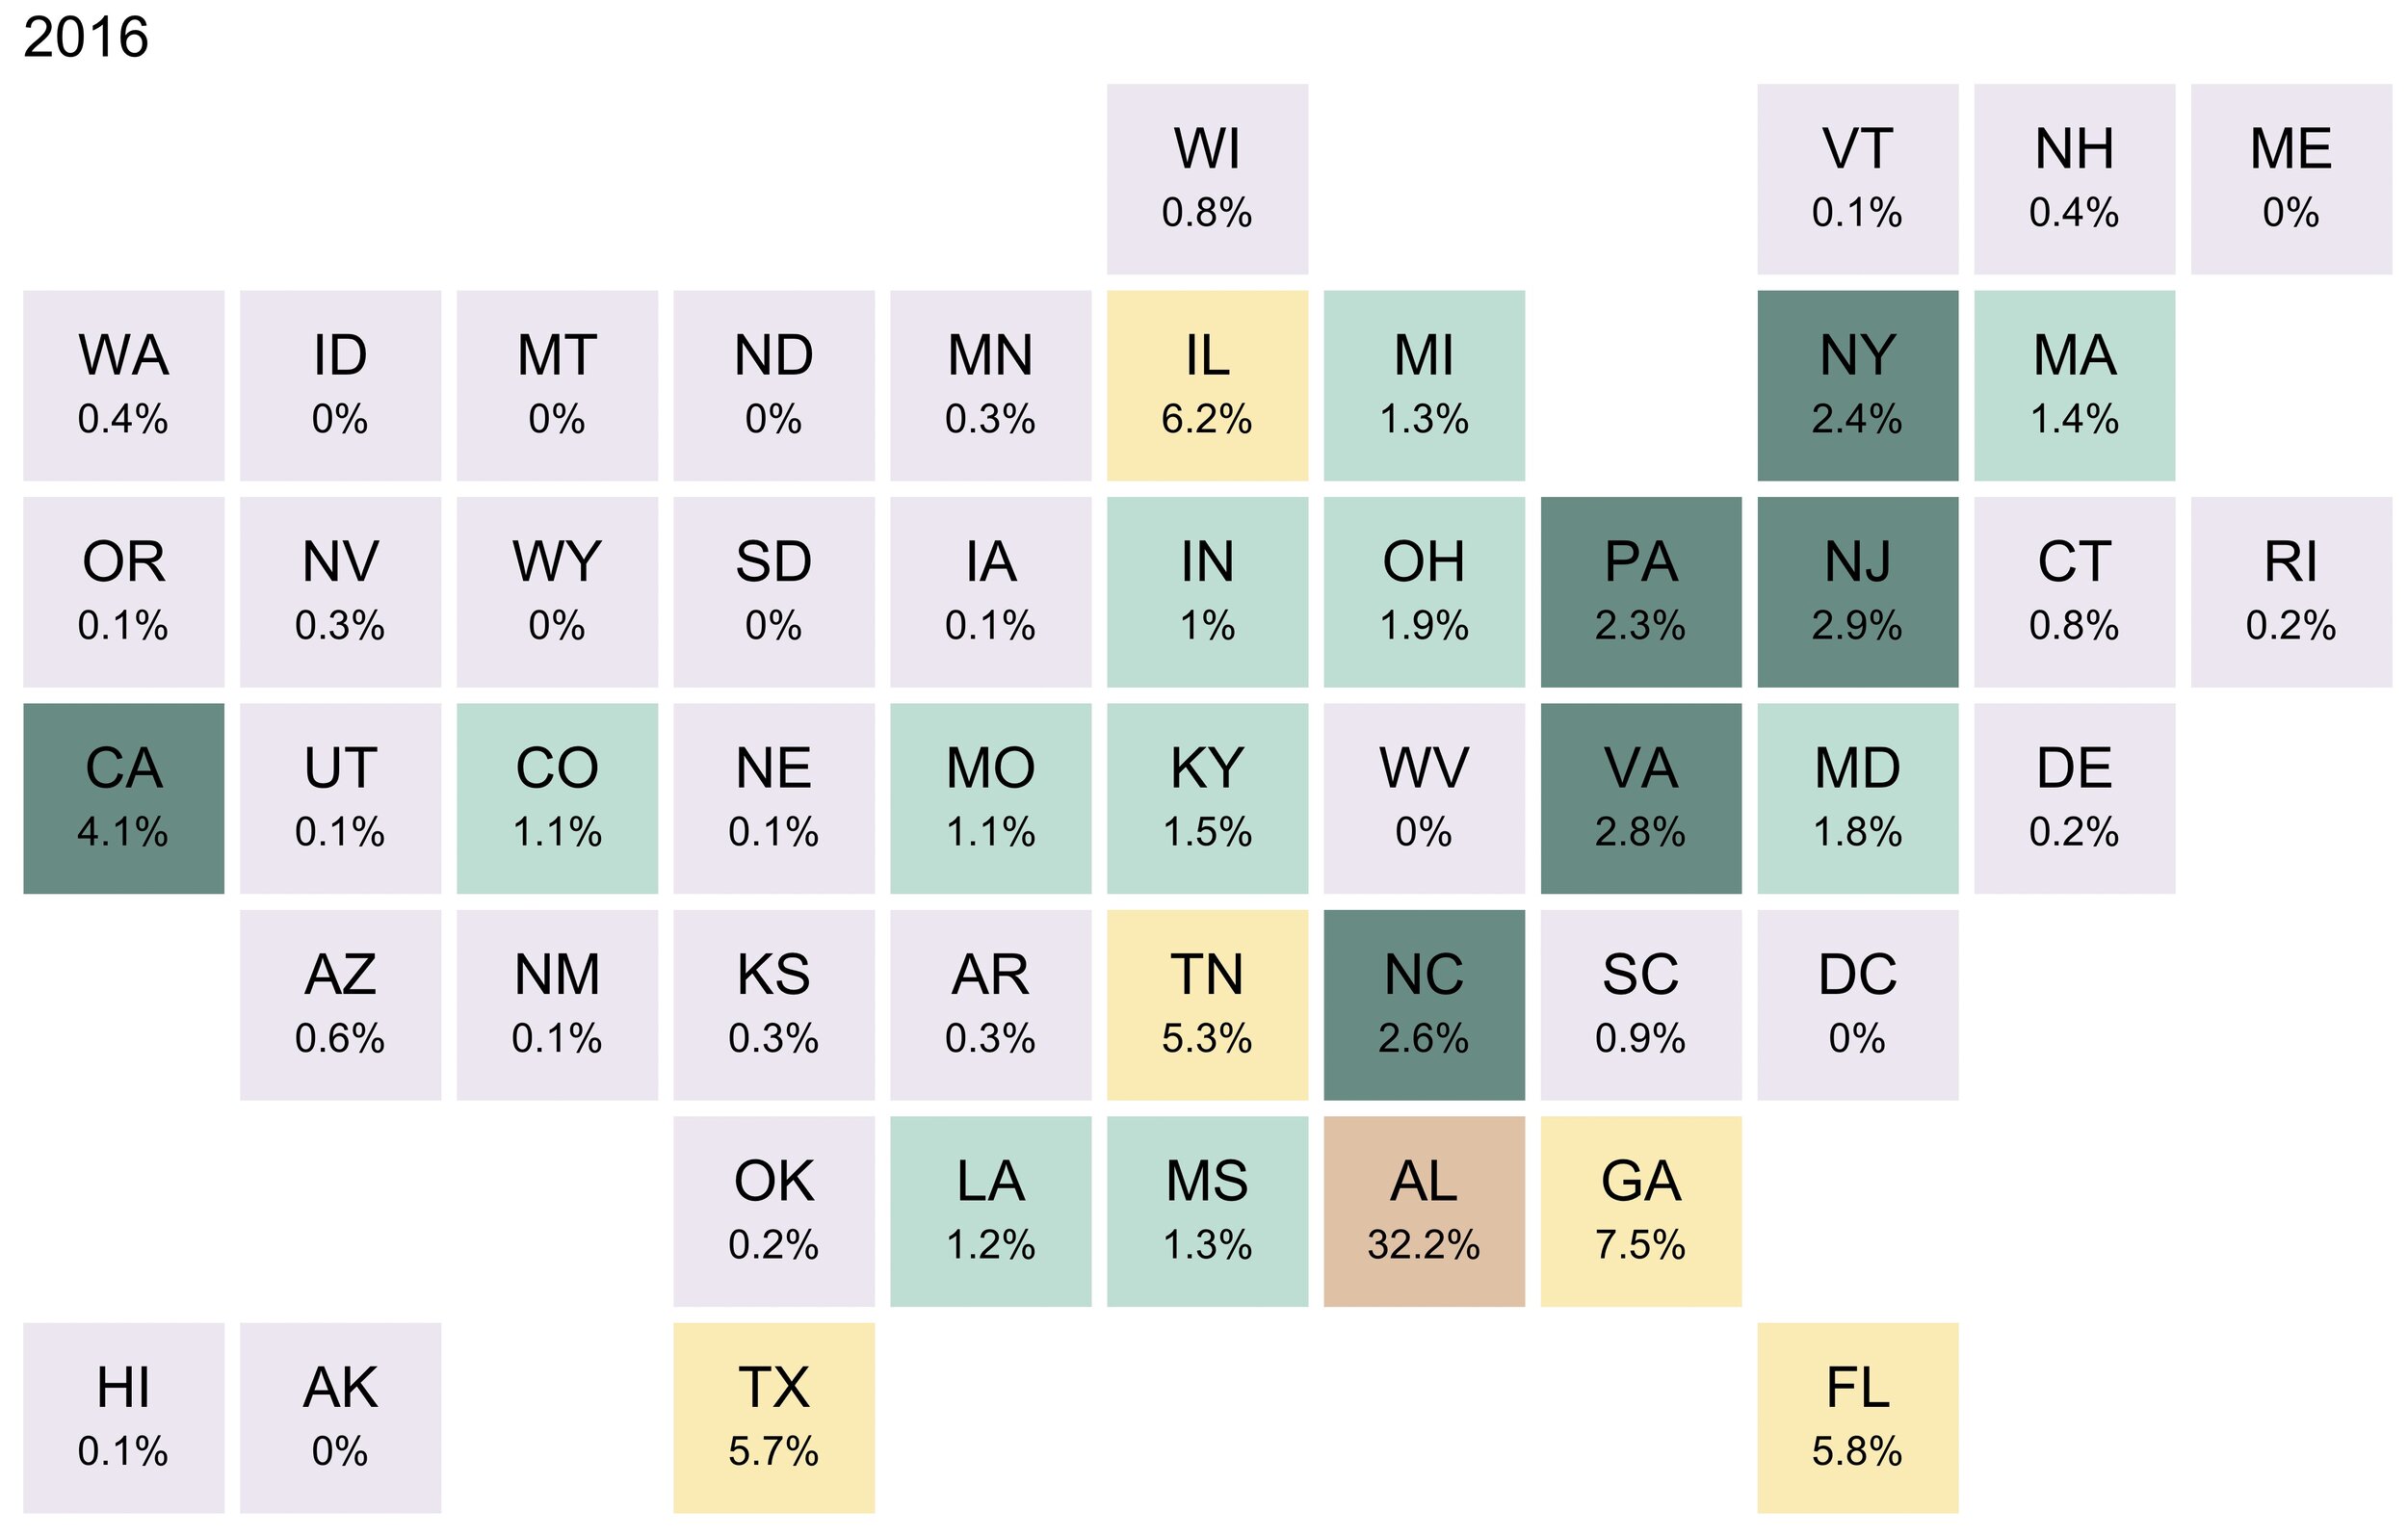
Source: Integrated Postsecondary Education Data System (IPEDS), Spring 2007 through 2017, Fall Enrollment (EF) Survey (odd-numbered years).
The map gallery visualizes the declining share of in-state enrollments at the University of Alabama and the geographic expansion of its out-of-state enrollments over time. Reflecting a national approach to student recruitment, Alabama increased enrollment shares from the Southeast, Midwest, and Mid-Atlantic regions and as far west as California. The states that experienced the largest increased shares of representation between fall 2006 and fall 2016 include Illinois (from 0.6% to 6.2% of the incoming cohort), California (from 0.5% to 4.1%), and New Jersey (from 0.3% to 2.9%).
What are the implications for growing out-of-state enrollments at public flagship universities? Research on out-of-state enrollments at public research universities (institutions that mirror and largely overlap with flagships) suggests that out-of-state enrollments may have a crowding out effect on in-state enrollments at highly selective institutions and that increased out-of-state enrollments correlate with declining racial/ethnic and socioeconomic diversity among the student body.
As flagships strive to live up to their historical mission to serve the residents of their states, they must balance the complicated and competing interests of revenue and prestige with access and diversity.