The Geography of College Choice
Despite a nationwide network of more than 4,000 degree-granting colleges and universities in the U.S., student college choice remains a largely localized phenomenon. In fall 2016, 80% of the approximately 2.2 million recent high school graduates who were first-time college enrollees selected a postsecondary institution within their home state. This makes economic sense. States incentivize in-state college enrollment by subsidizing public higher education to keep tuition substantially lower for residents, compared to non-residents, and through financial aid programs designed to retain their academically high-achieving students.
But states demonstrate great variability in the share of students who remain in-state or out-migrate to attend college. The following visualizations highlight differences in the geographic mobility of each state’s residents when making their college choice.
In-State College Enrollment
How does in-state college enrollment vary by state? The map below reveals that Southern states generally exhibit the highest rates of in-state college enrollment. The states with the largest shares of in-state college enrollment among their residents are Mississippi (93%), Utah (91%), Louisiana (90%), Oklahoma (89%), and Arkansas (89%). For these states and others shaded in burgundy, college out-migration is the rare exception to the rule of in-state college enrollment.
On the other hand, states in the Northeast typically exhibit the lowest rates of in-state college enrollment, suggesting their residents exercise greater geographic mobility when making their college choice. The states with the smallest shares of in-state college enrollment among their residents are the District of Columbia (18%), Vermont (49%), New Hampshire (52%), Connecticut (53%), and New Jersey (57%).
Percentage of In-State College Enrollment, by State: Fall 2016

Source: Integrated Postsecondary Education Data System (IPEDS), Spring 2017, Fall Enrollment (EF) Survey. Notes: Calculations include all first-time degree/certificate-seeking undergraduate students who graduated from high school in the past 12 months and attend a U.S. degree-granting postsecondary institution (i.e., awards associate degree or higher) that participates in Title IV federal financial aid programs.
Geographic Mobility Patterns of College Enrollment
Where do out-of-state enrollees go to attend college? Short answer: Not far. Though they represent the minority of all college-goers, the majority of out-of-state enrollees choose a college located in a geographically bordering state. As an example, while 82% of Georgia’s recent high school graduates who were first-time college enrollees remained in-state, another 10% selected a college or university in a neighboring state (i.e., Alabama, Florida, North Carolina, South Carolina, or Tennessee). Overall, only 8% of college-going Georgians migrated beyond a bordering state to attend college.
These largely localized college enrollment patterns are presented in the map gallery below. By visually inspecting the geographic mobility of first-time college enrollees, a clear pattern emerges. In general, the highest concentration of states’ college-going residents are found to remain in the state of residence (warm colors), followed by neighboring states (cool colors), and then only minimally represented in non-bordering or geographically distant states (light grey), or not at all (lightest grey). Most states’ college-going residents are substantively represented in only a handful of states, clustered primarily in their home state and to a lesser extent in neighboring states.
Twenty states have residents represented at colleges and universities in all 50 states and the District of Columbia, whereas the remaining 31 (including the District of Columbia) lack geographic representation in at least one state. The District of Columbia, South Dakota, and West Virginia exhibit the lowest levels of overall geographic representation nationally, with no college enrollments in 9 different states, respectively.
Some states, however, defy the typical geographic mobility patterns in their residents’ college destinations. For example, in fall 2016 more than 3,000 Californians and 1,500 Floridians enrolled in a college or university located in New York state, representing 1.2% and 1.4% of first-time college enrollment among California and Florida recent high school graduates, respectively. In addition, residents of Mid-Atlantic and New England states demonstrate an affinity for migrating south to attend Florida colleges. Between 1% and 2% of college-going residents of Massachusetts, Vermont, Maine, Delaware, Maryland, Rhode Island, Connecticut, New Hampshire, New Jersey, and the District of Columbia enrolled at a Florida college or university in fall 2016. Despite the geographic distance, at least of subset of these states’ residents were able to overcome spatial and economic constraints when making their college choice.
The District of Columbia also stands out as a geographic outlier in terms of its residents’ college destinations. Despite representing the smallest number of college-going high school graduates of any state—approximately 2,500—District residents exhibit tremendous geographic mobility in where they attend college. With only 18% of residents remaining in-district to attend college, more than 4 out of 5 choose to enroll out-of-district. In fall 2016, approximately 14% of District residents enrolled in a Virginia college or university; 10% each in Pennsylvania, Maryland, and North Carolina; 6% in New York; and 3% each in Massachusetts and Georgia.
The District of Columbia is a case study in financial aid policy that promotes geographic mobility in the college choice process. Established by an act of Congress in 1999, the District of Columbia Tuition Assistance Grant Program (DCTAG) provides eligible District residents a subsidy to attend any of more than 300 participating colleges and universities nationwide at a substantially reduced price, effectively allowing District residents to pay ‘in-state tuition’ at out-of-district institutions. And research suggests that DCTAG was effective in increasing District enrollments at out-of-district participating colleges.
For more insights on the geographic mobility patterns of each state’s first-time college enrollees, scroll through the map gallery below.
Geographic Distribution of First-Time College Enrollees, by State: Fall 2016
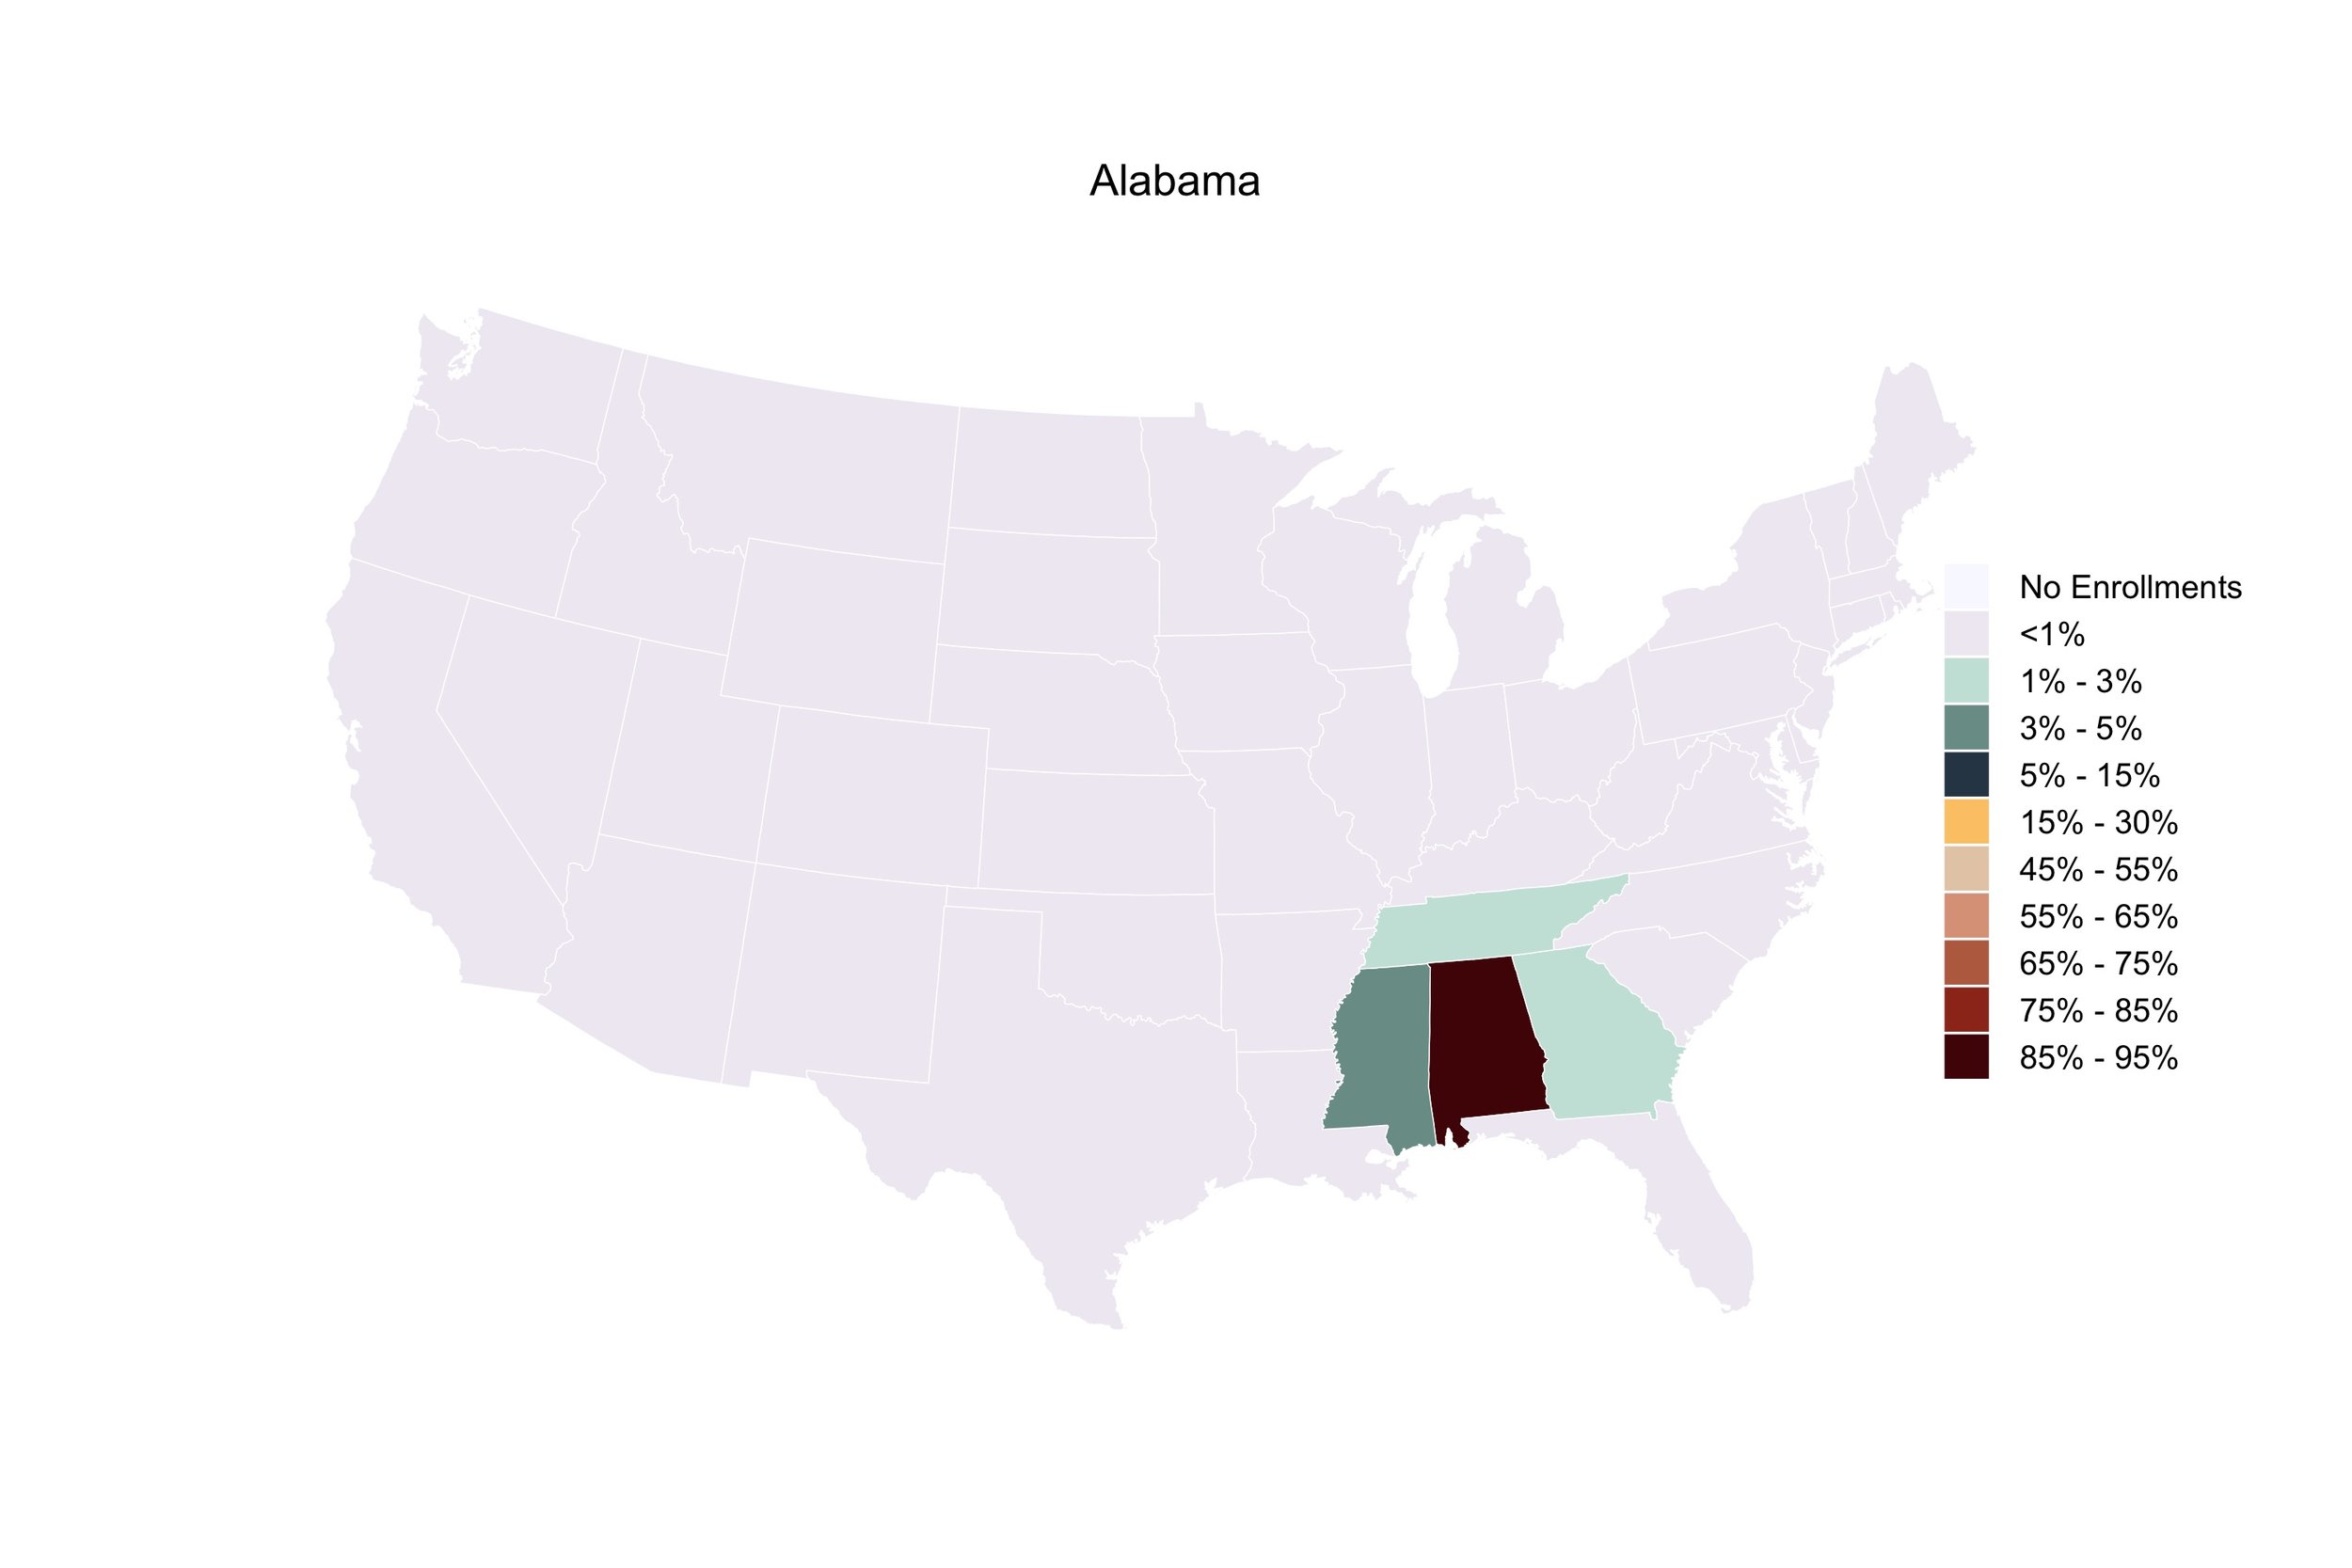
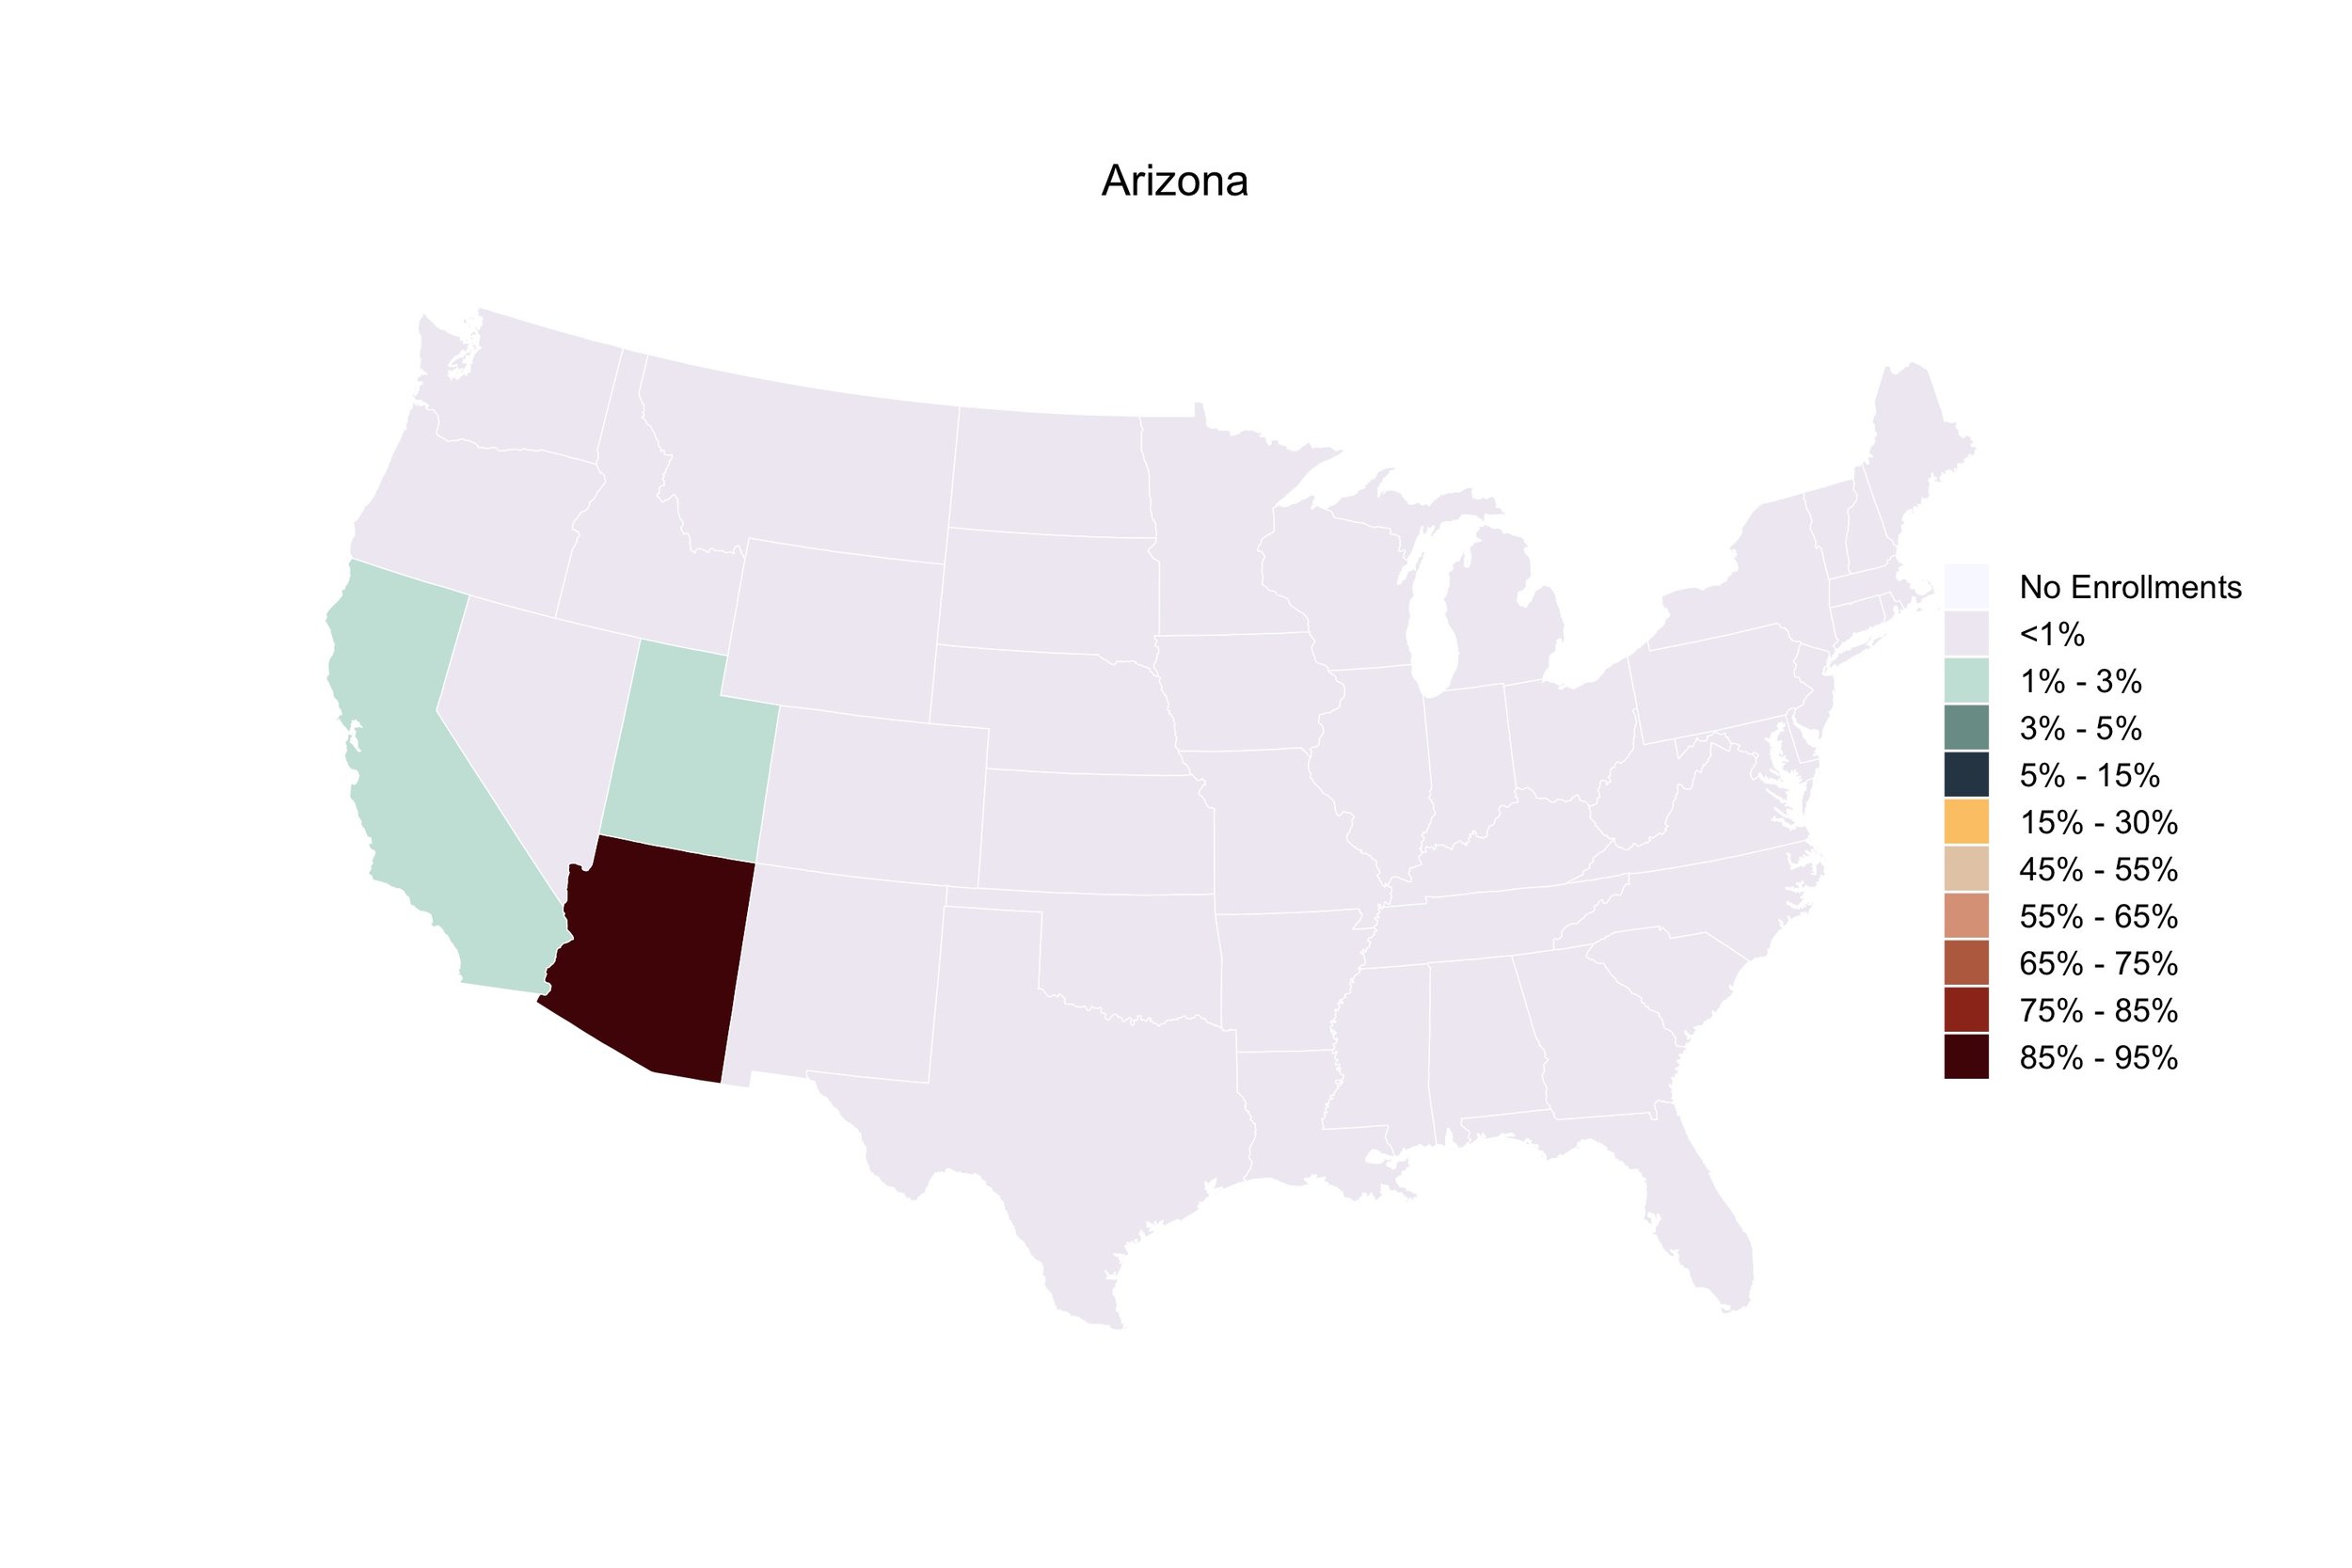
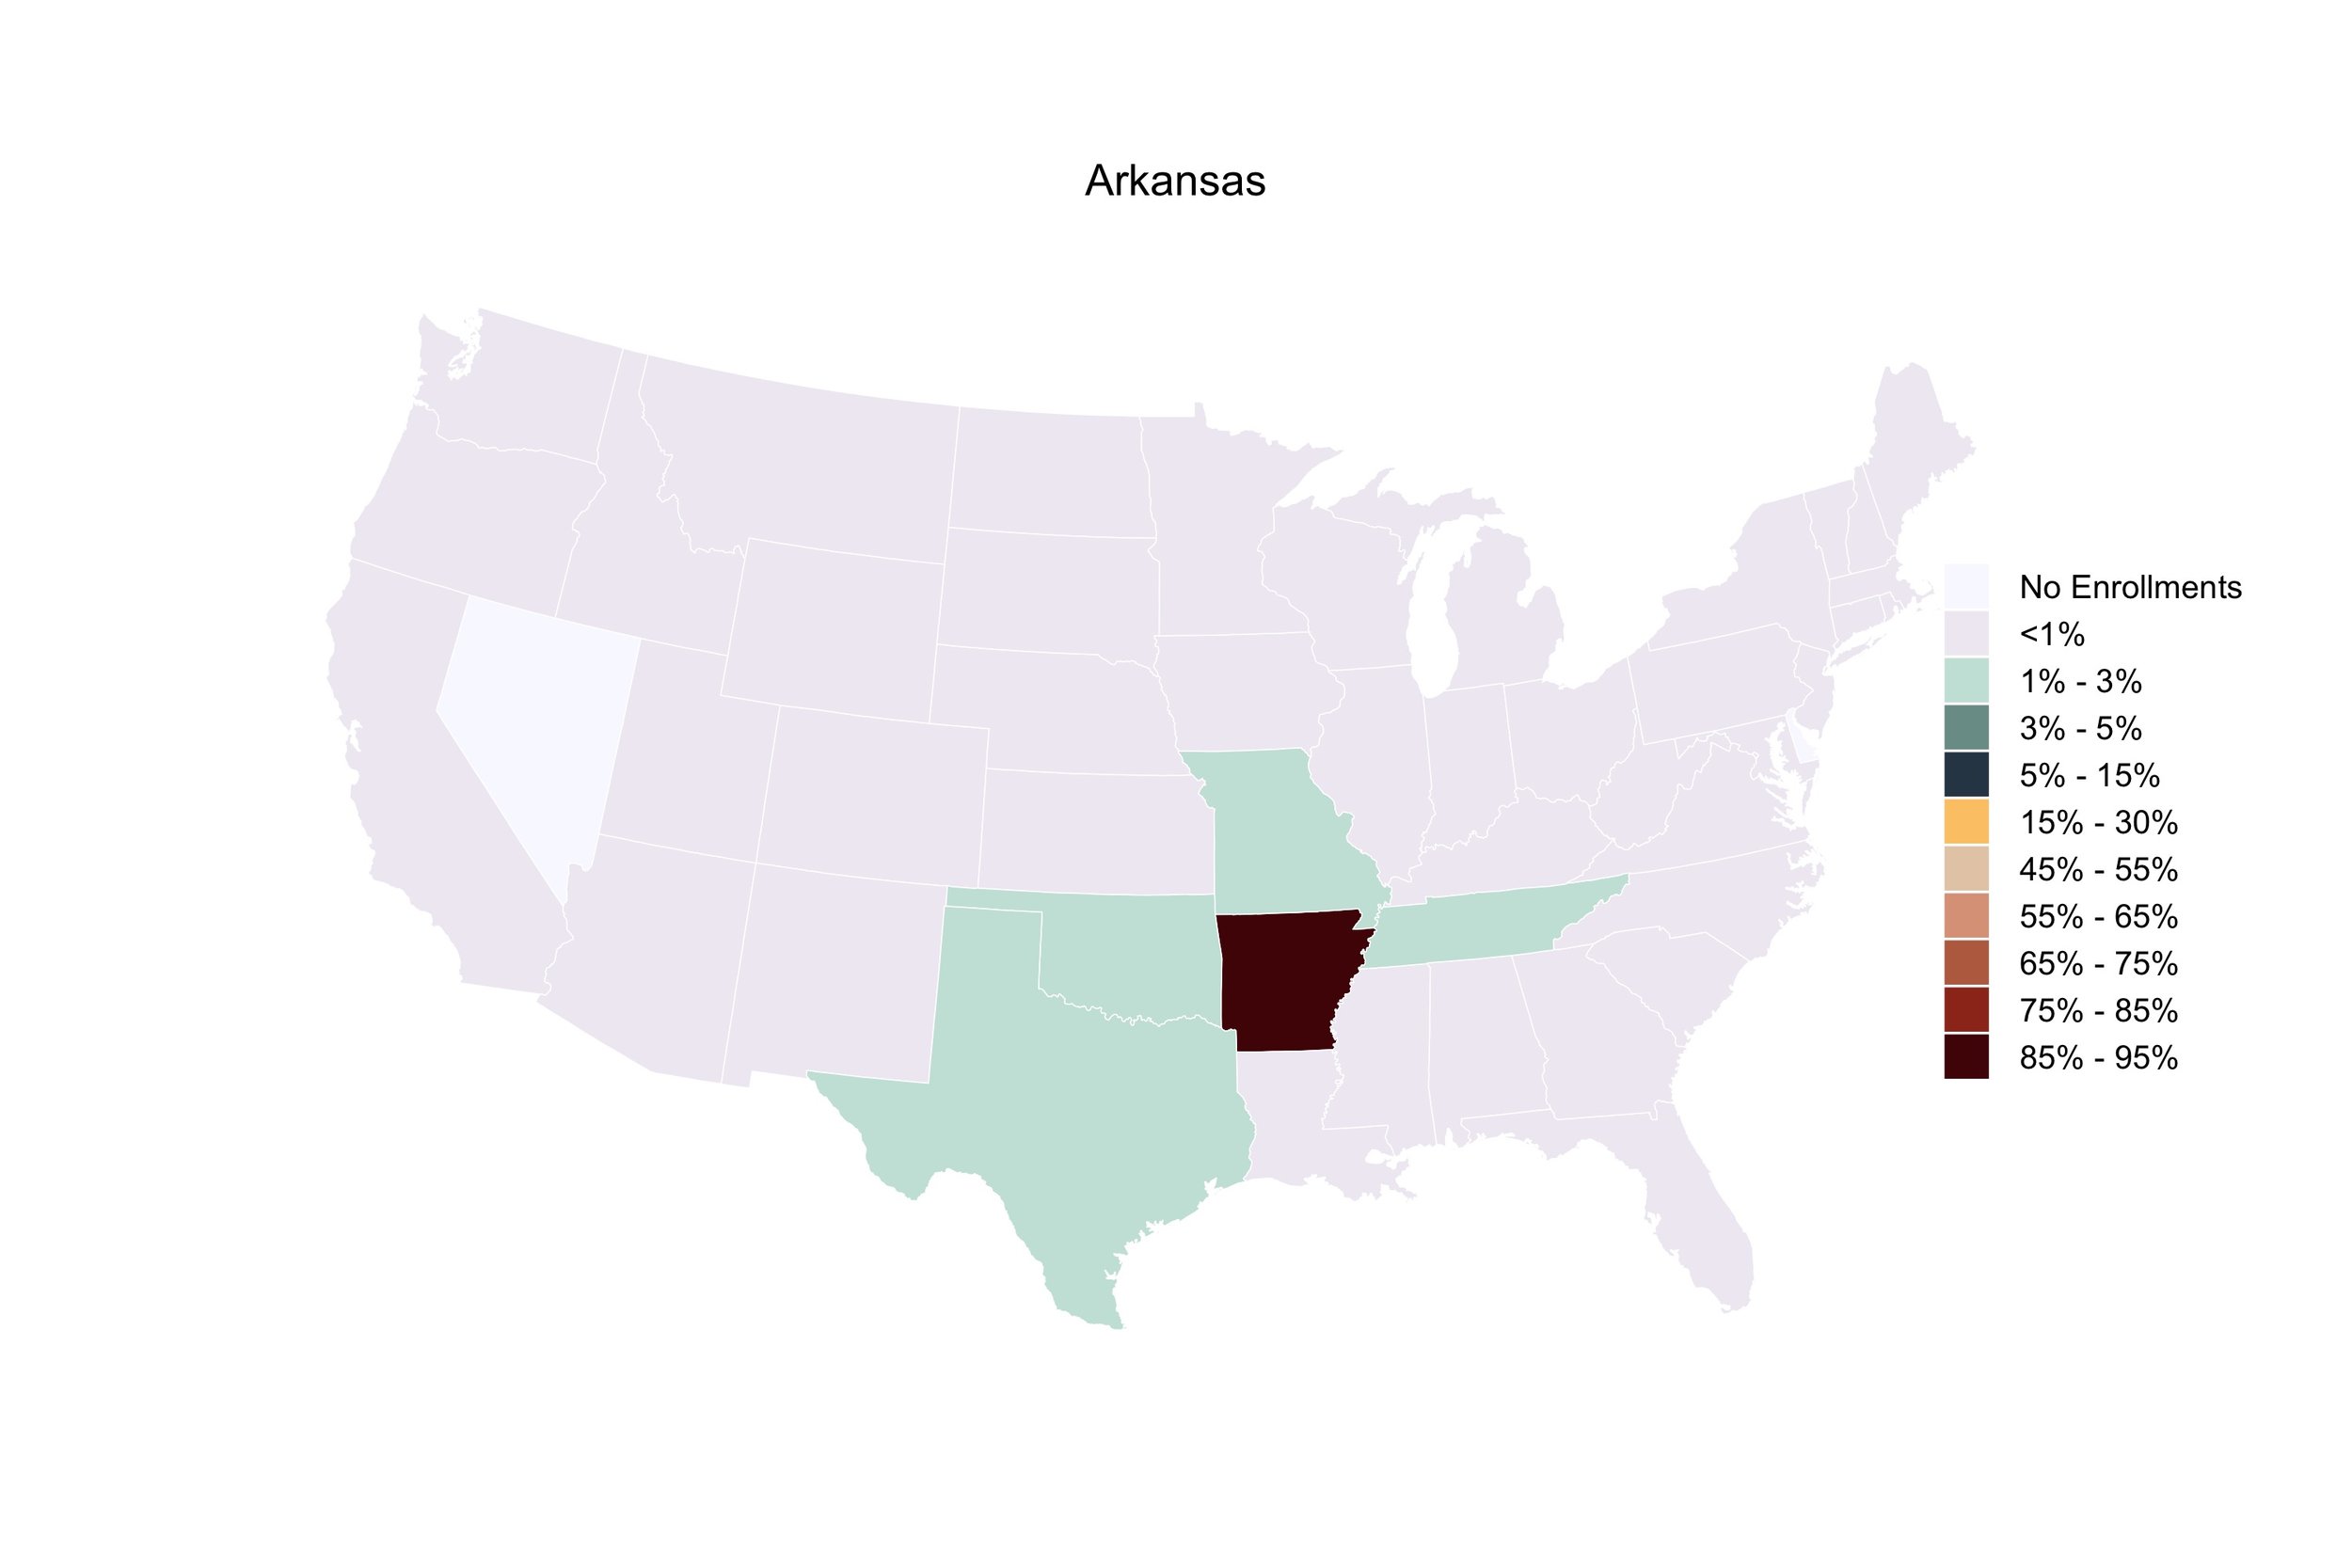
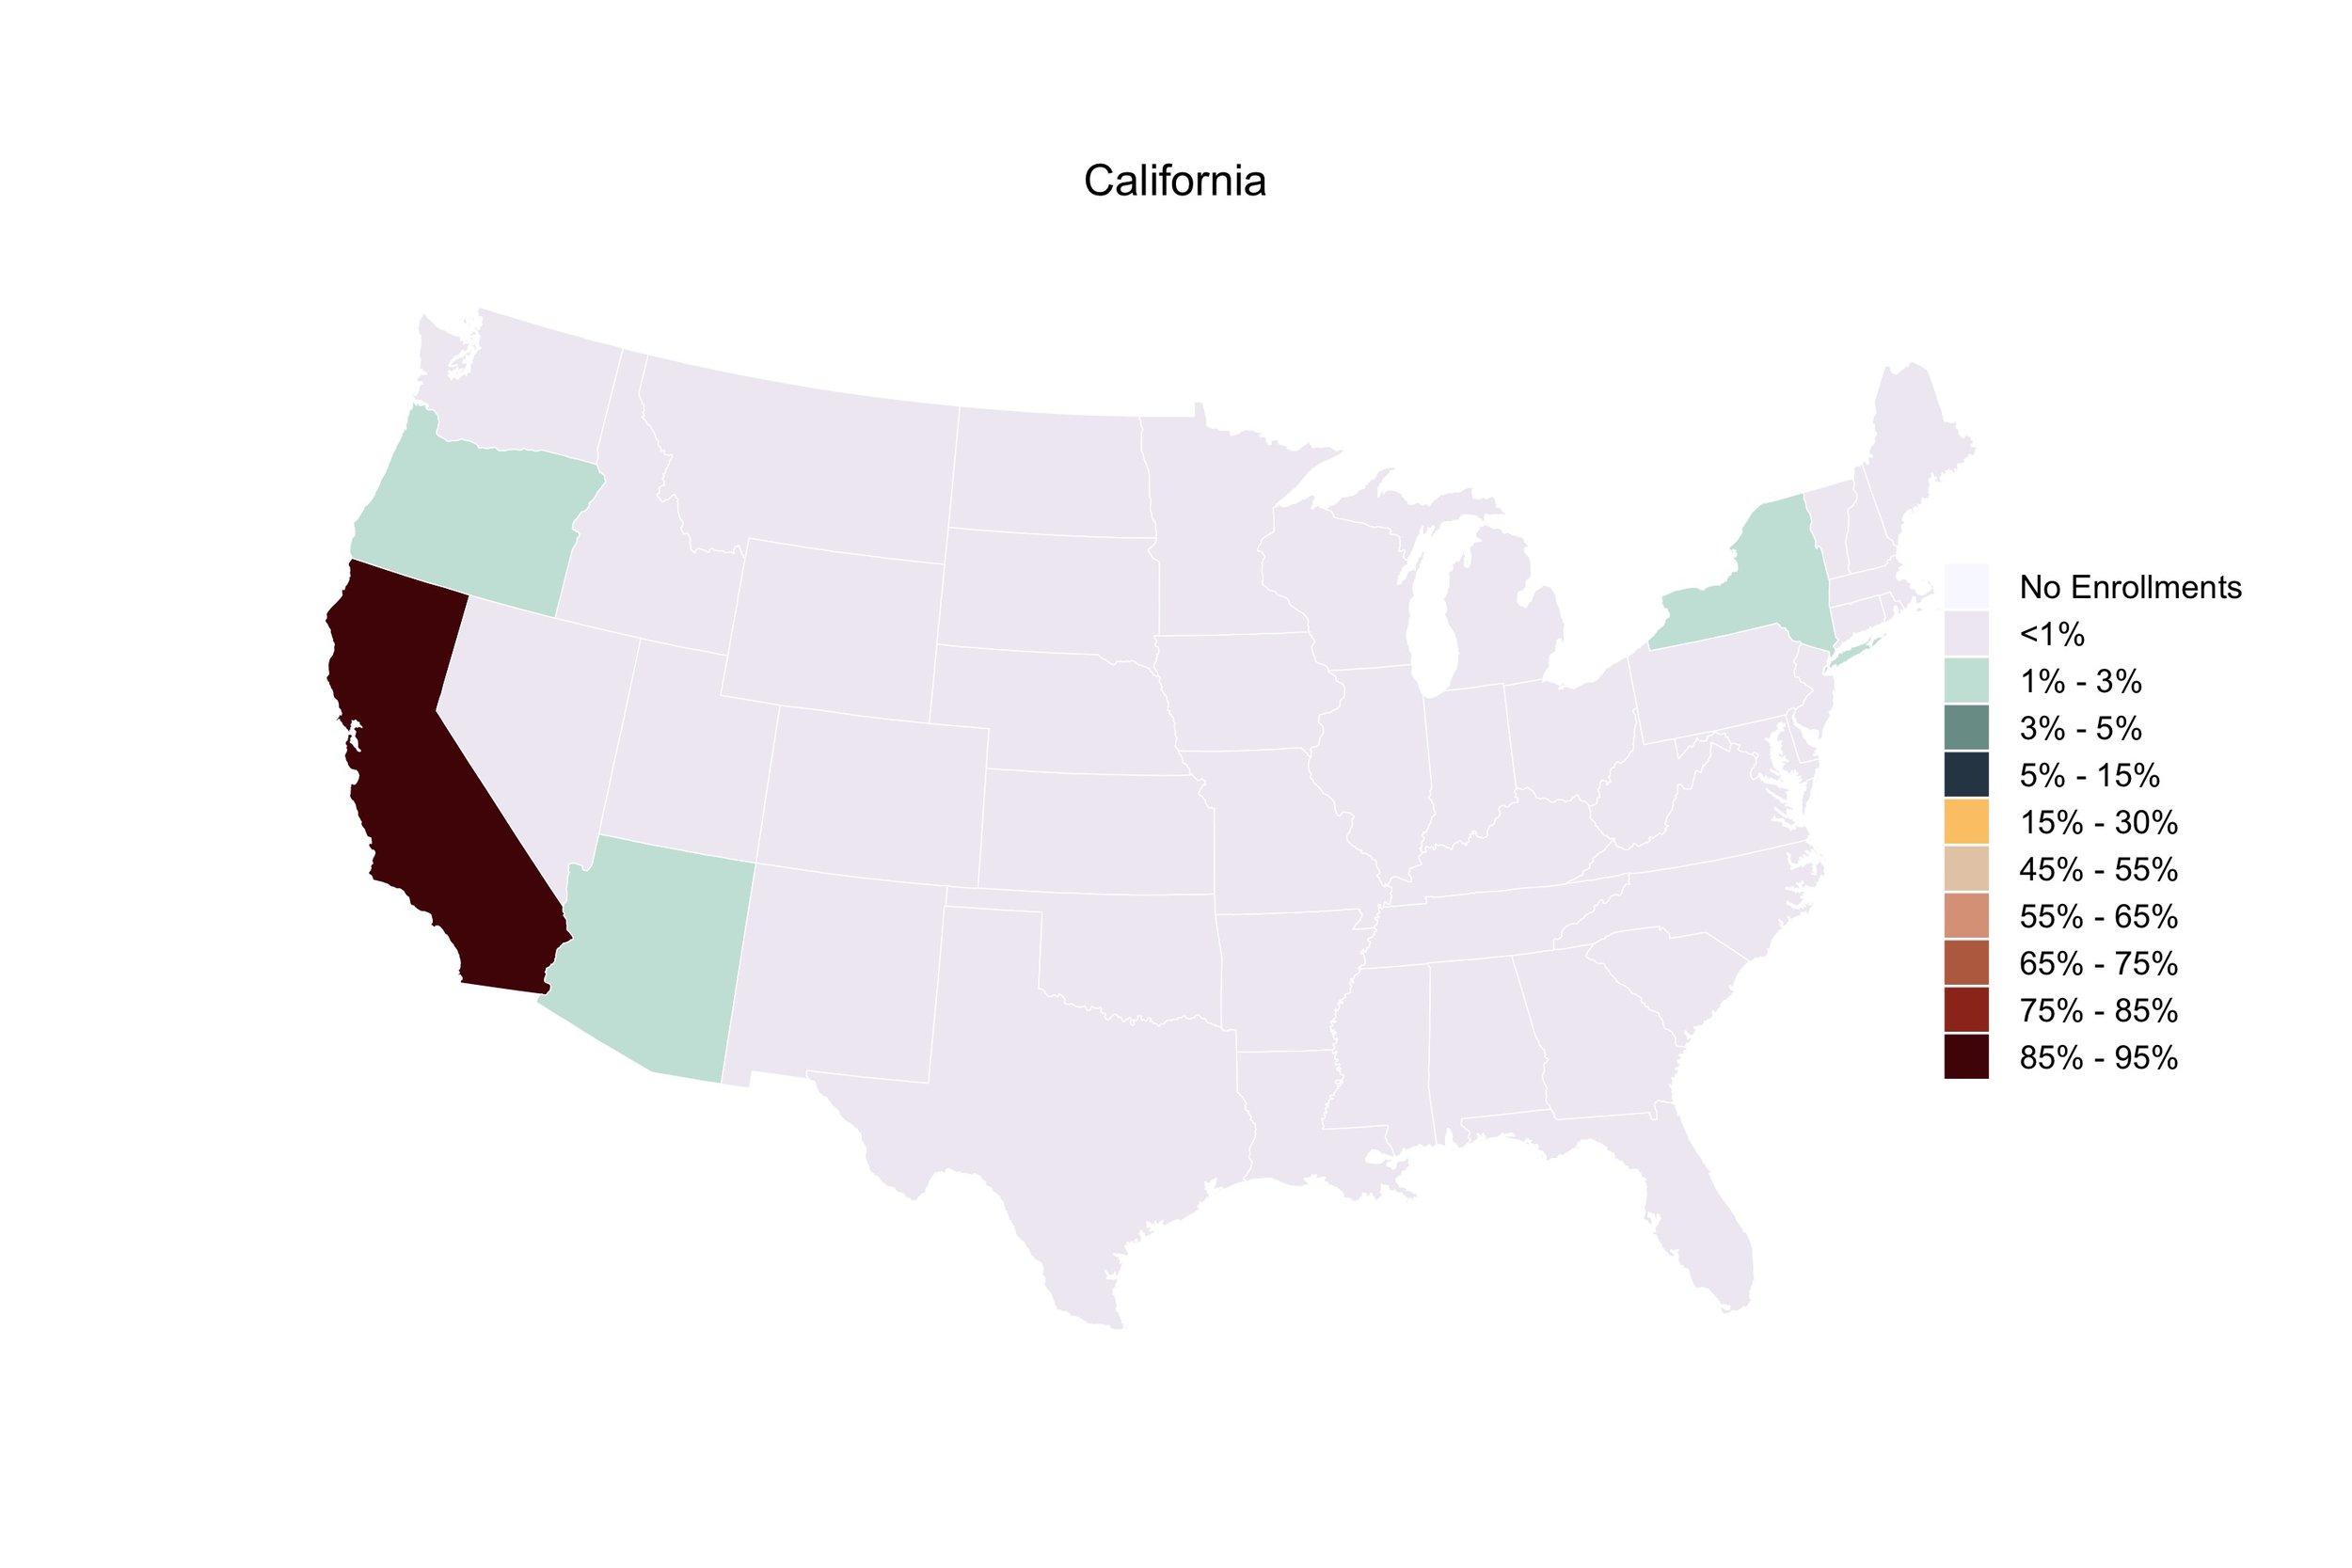
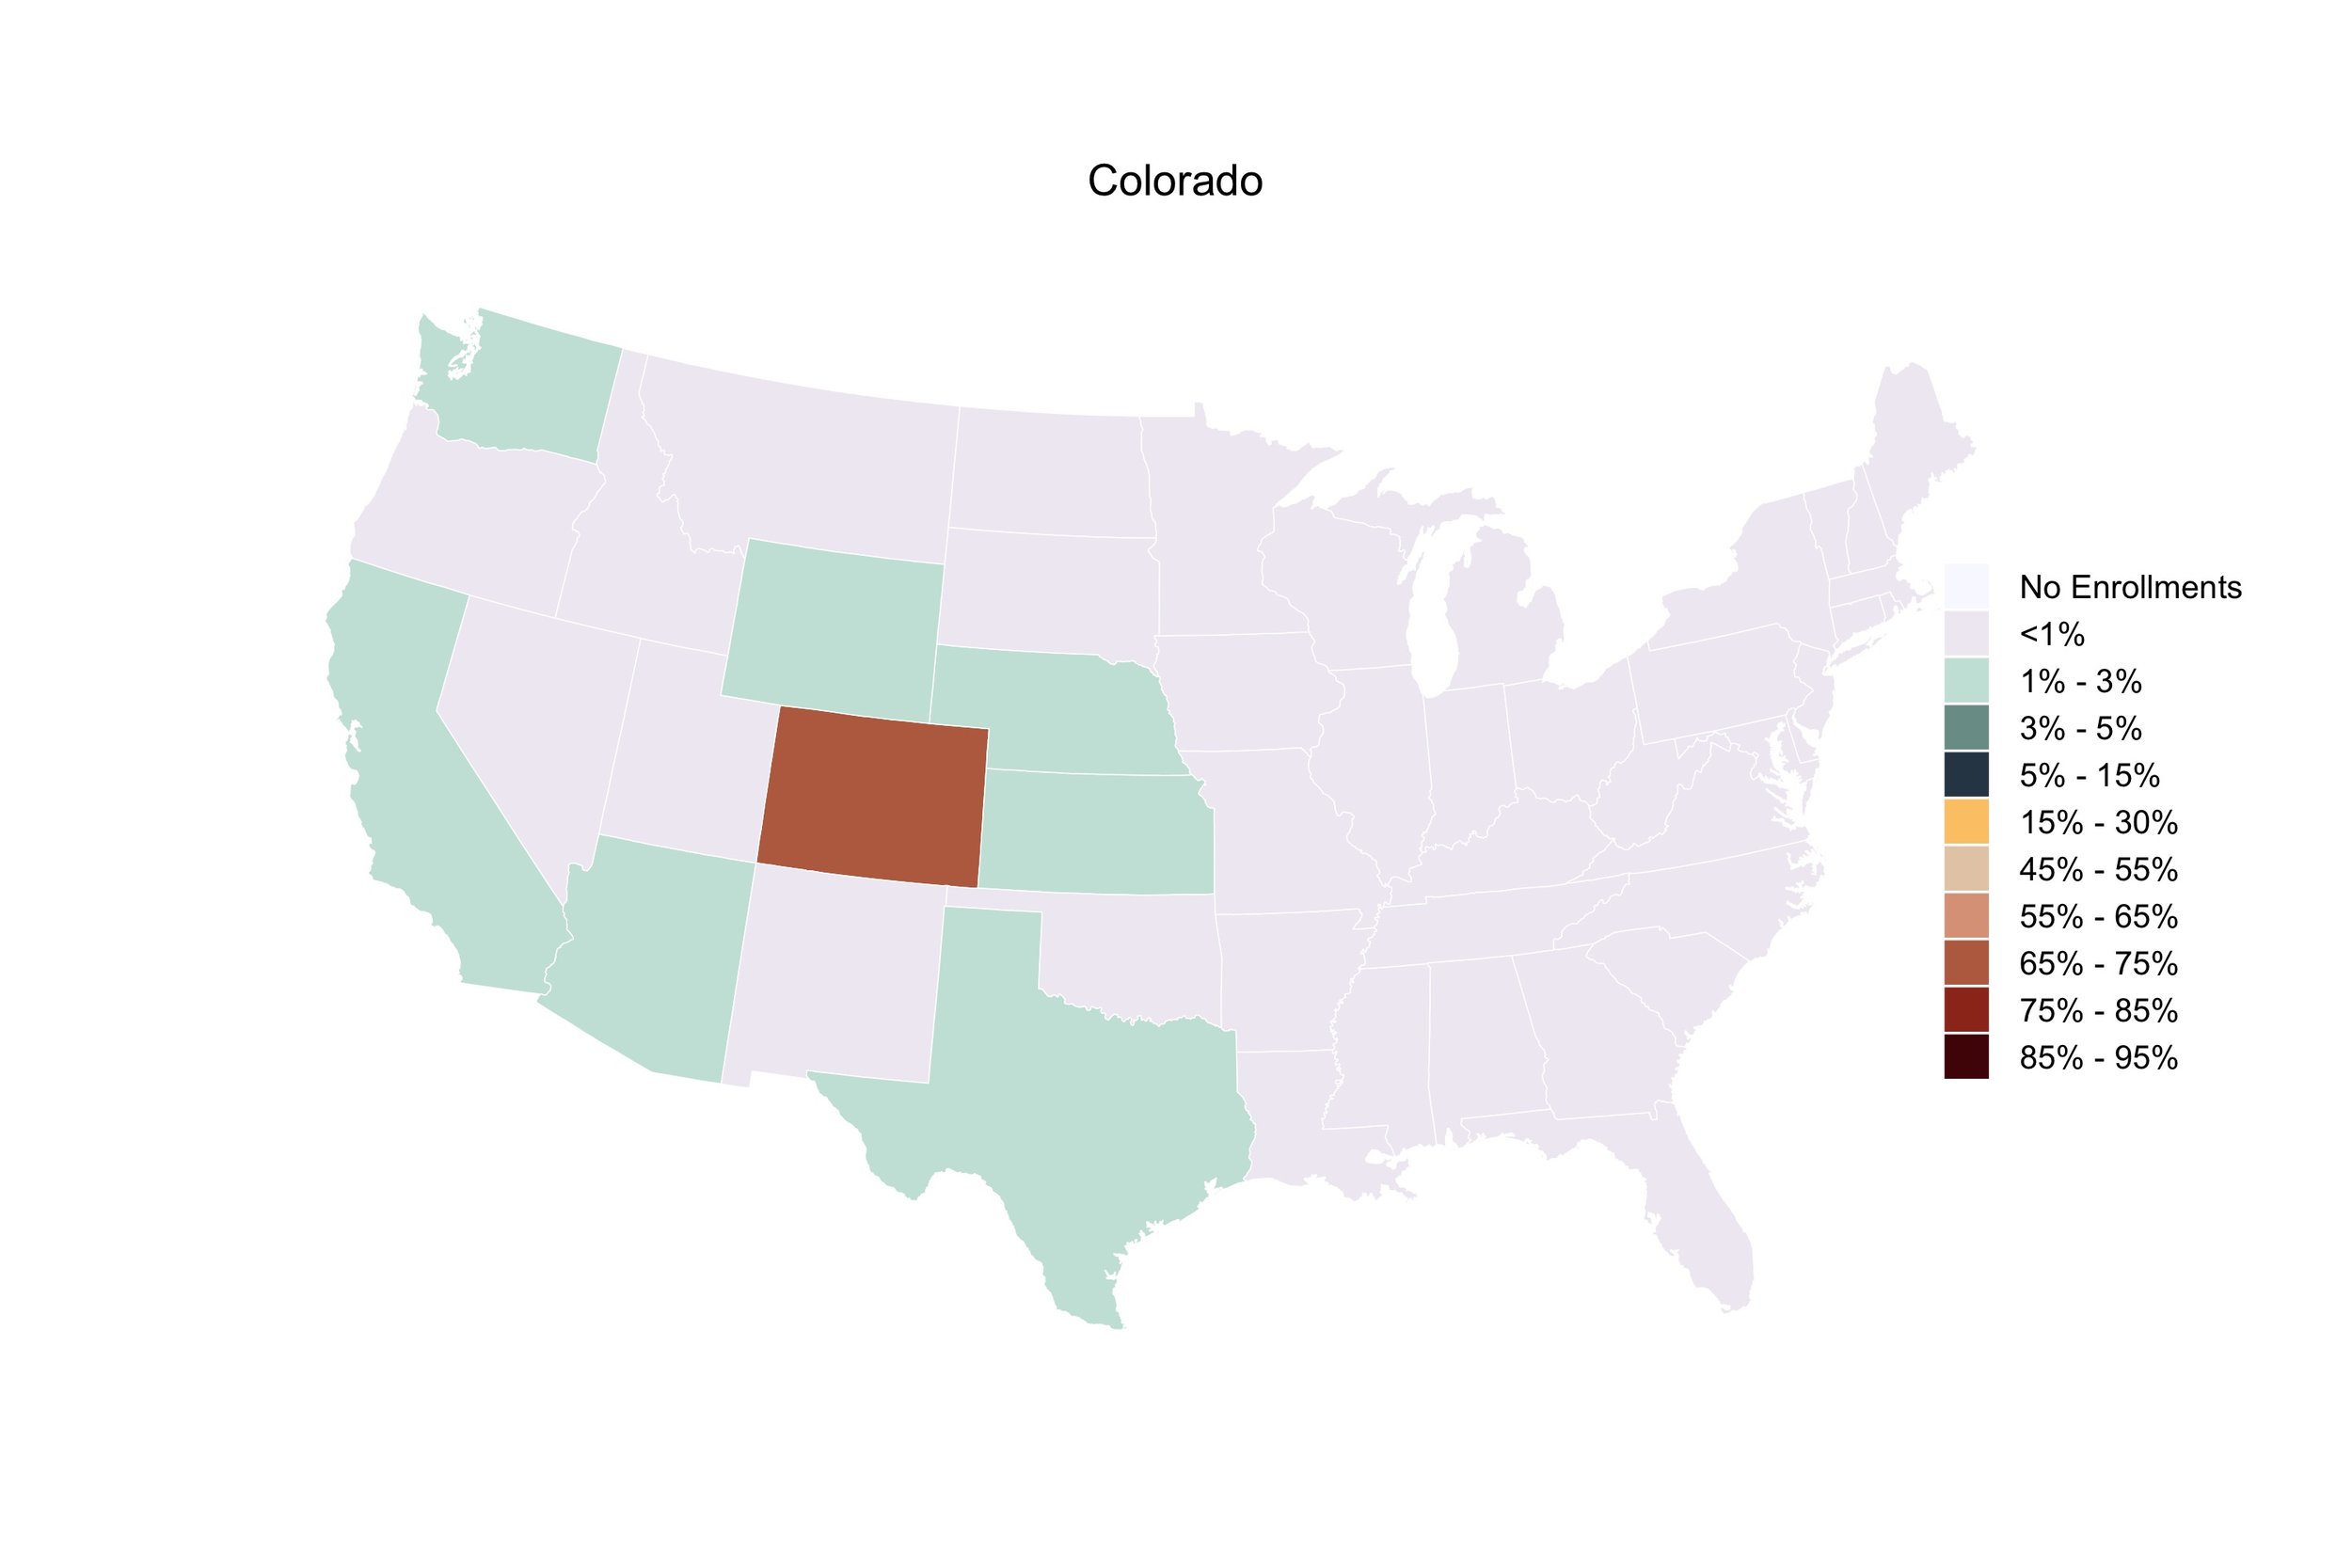
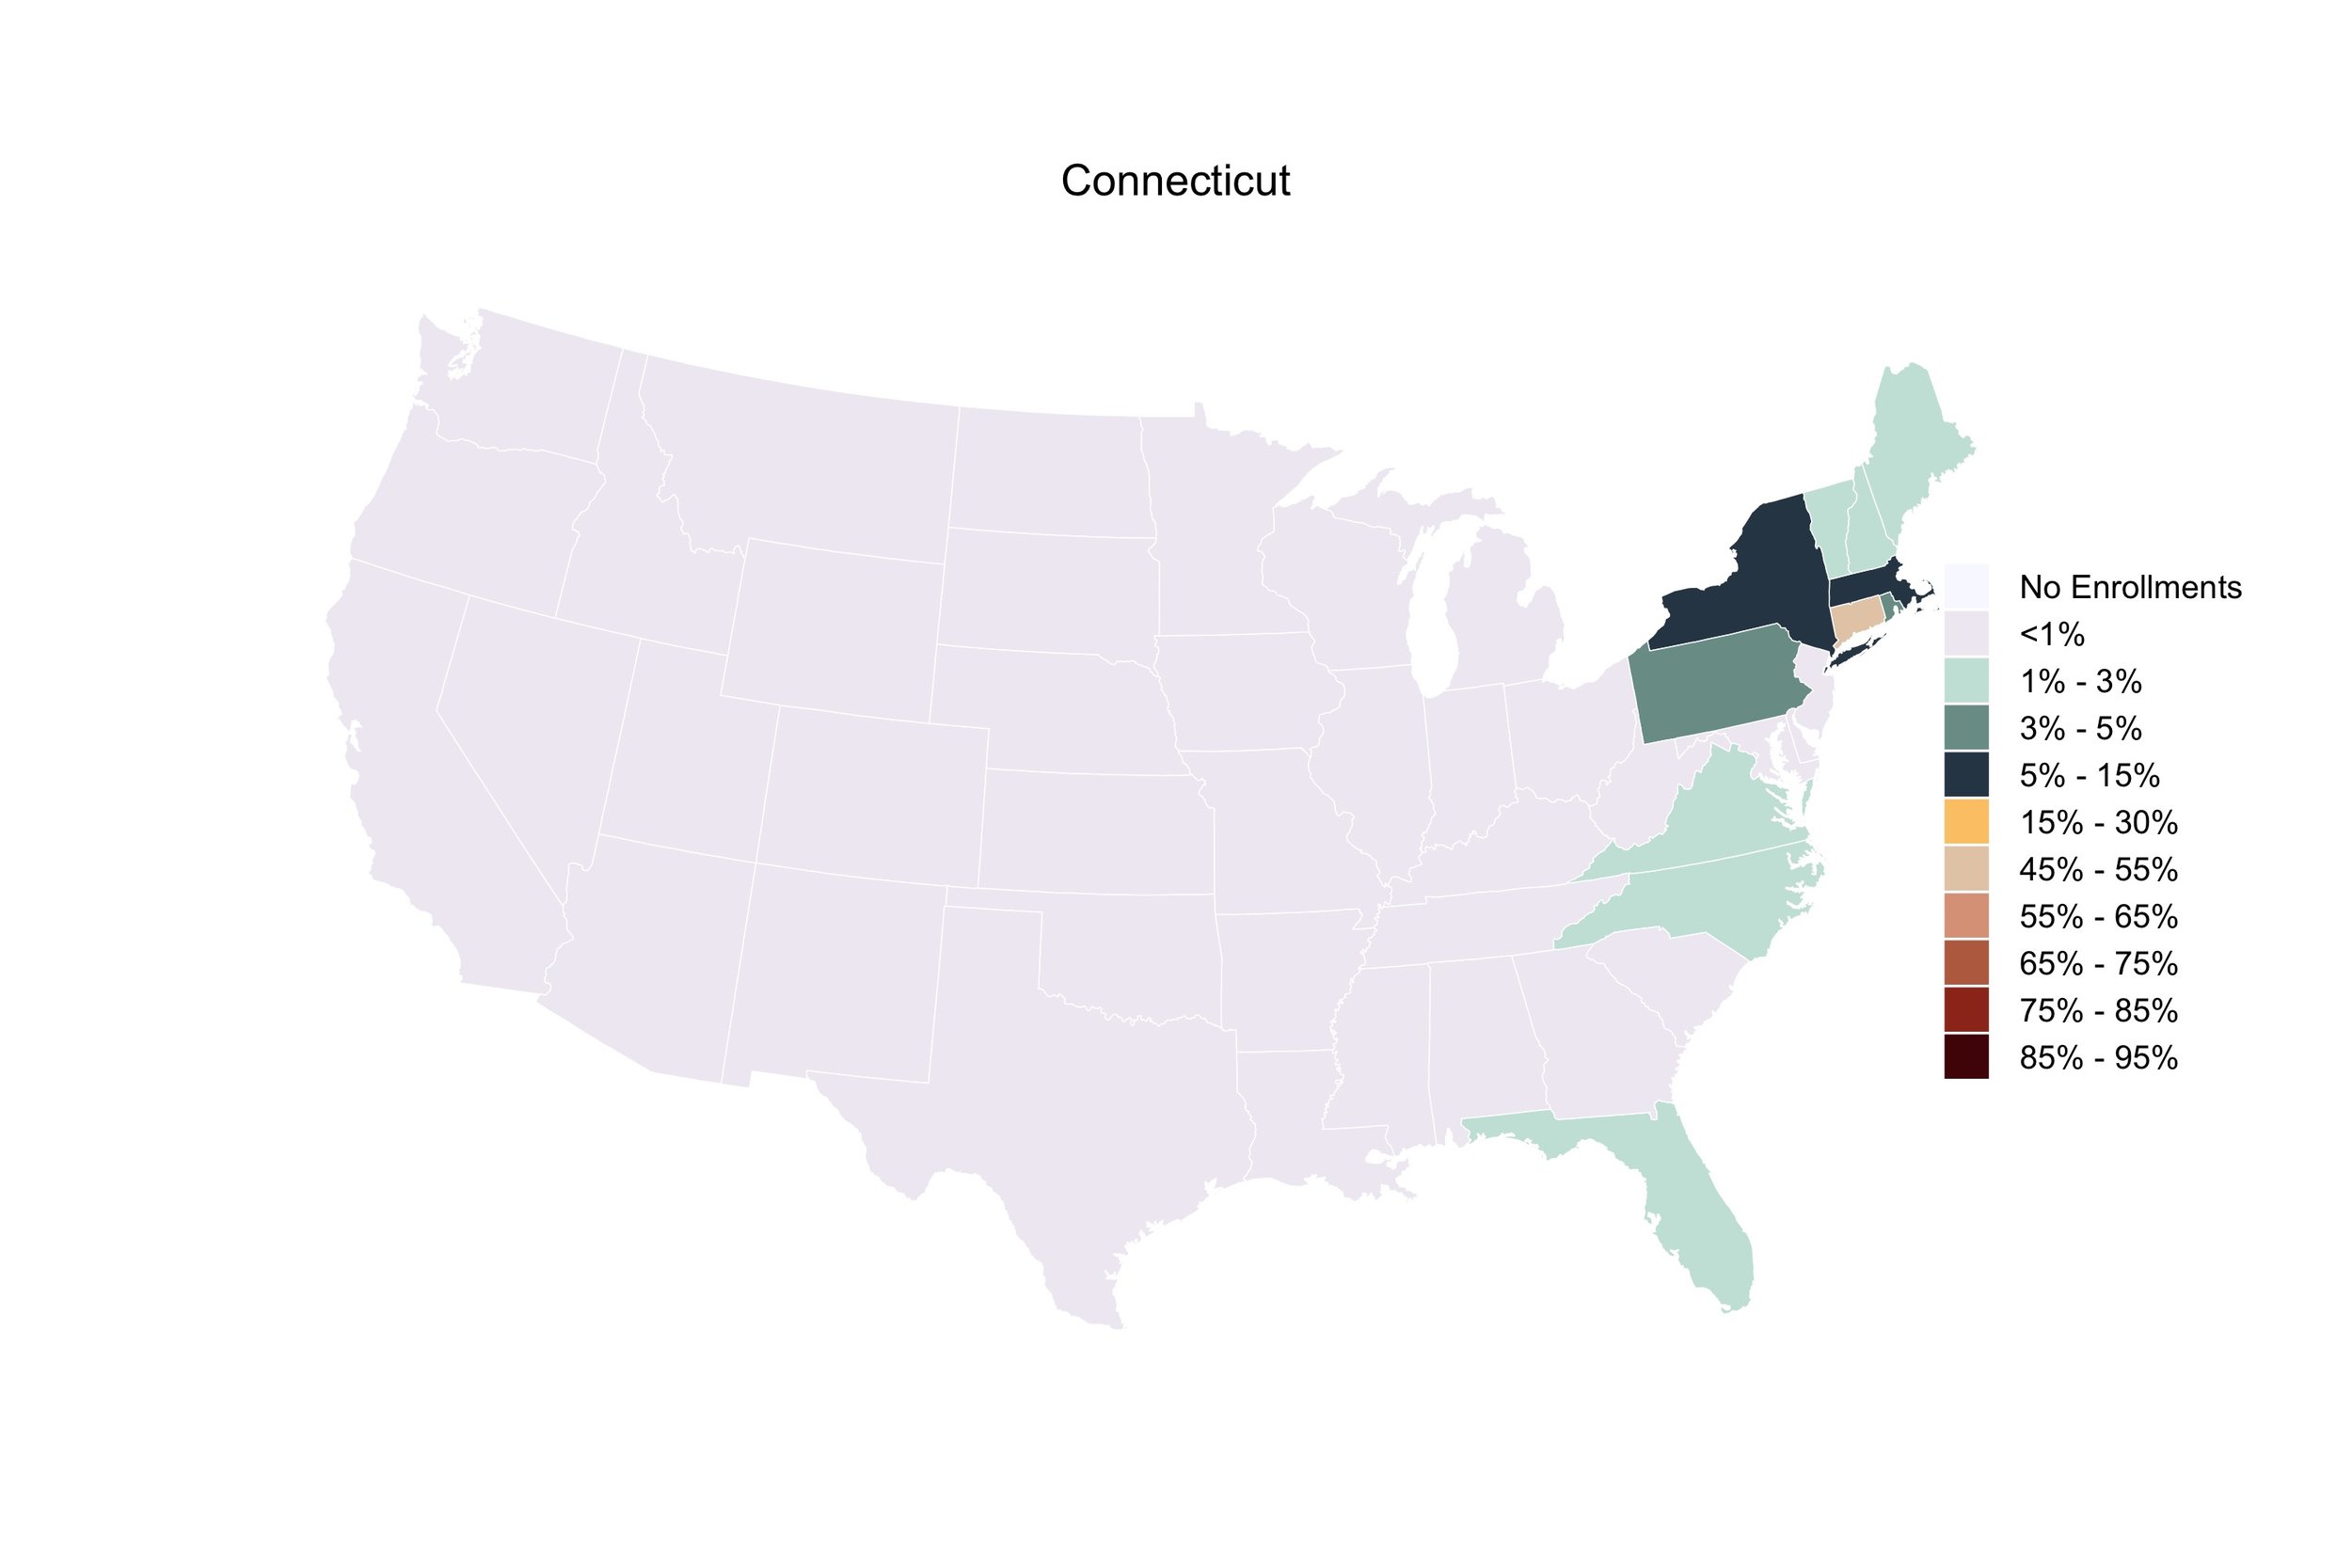
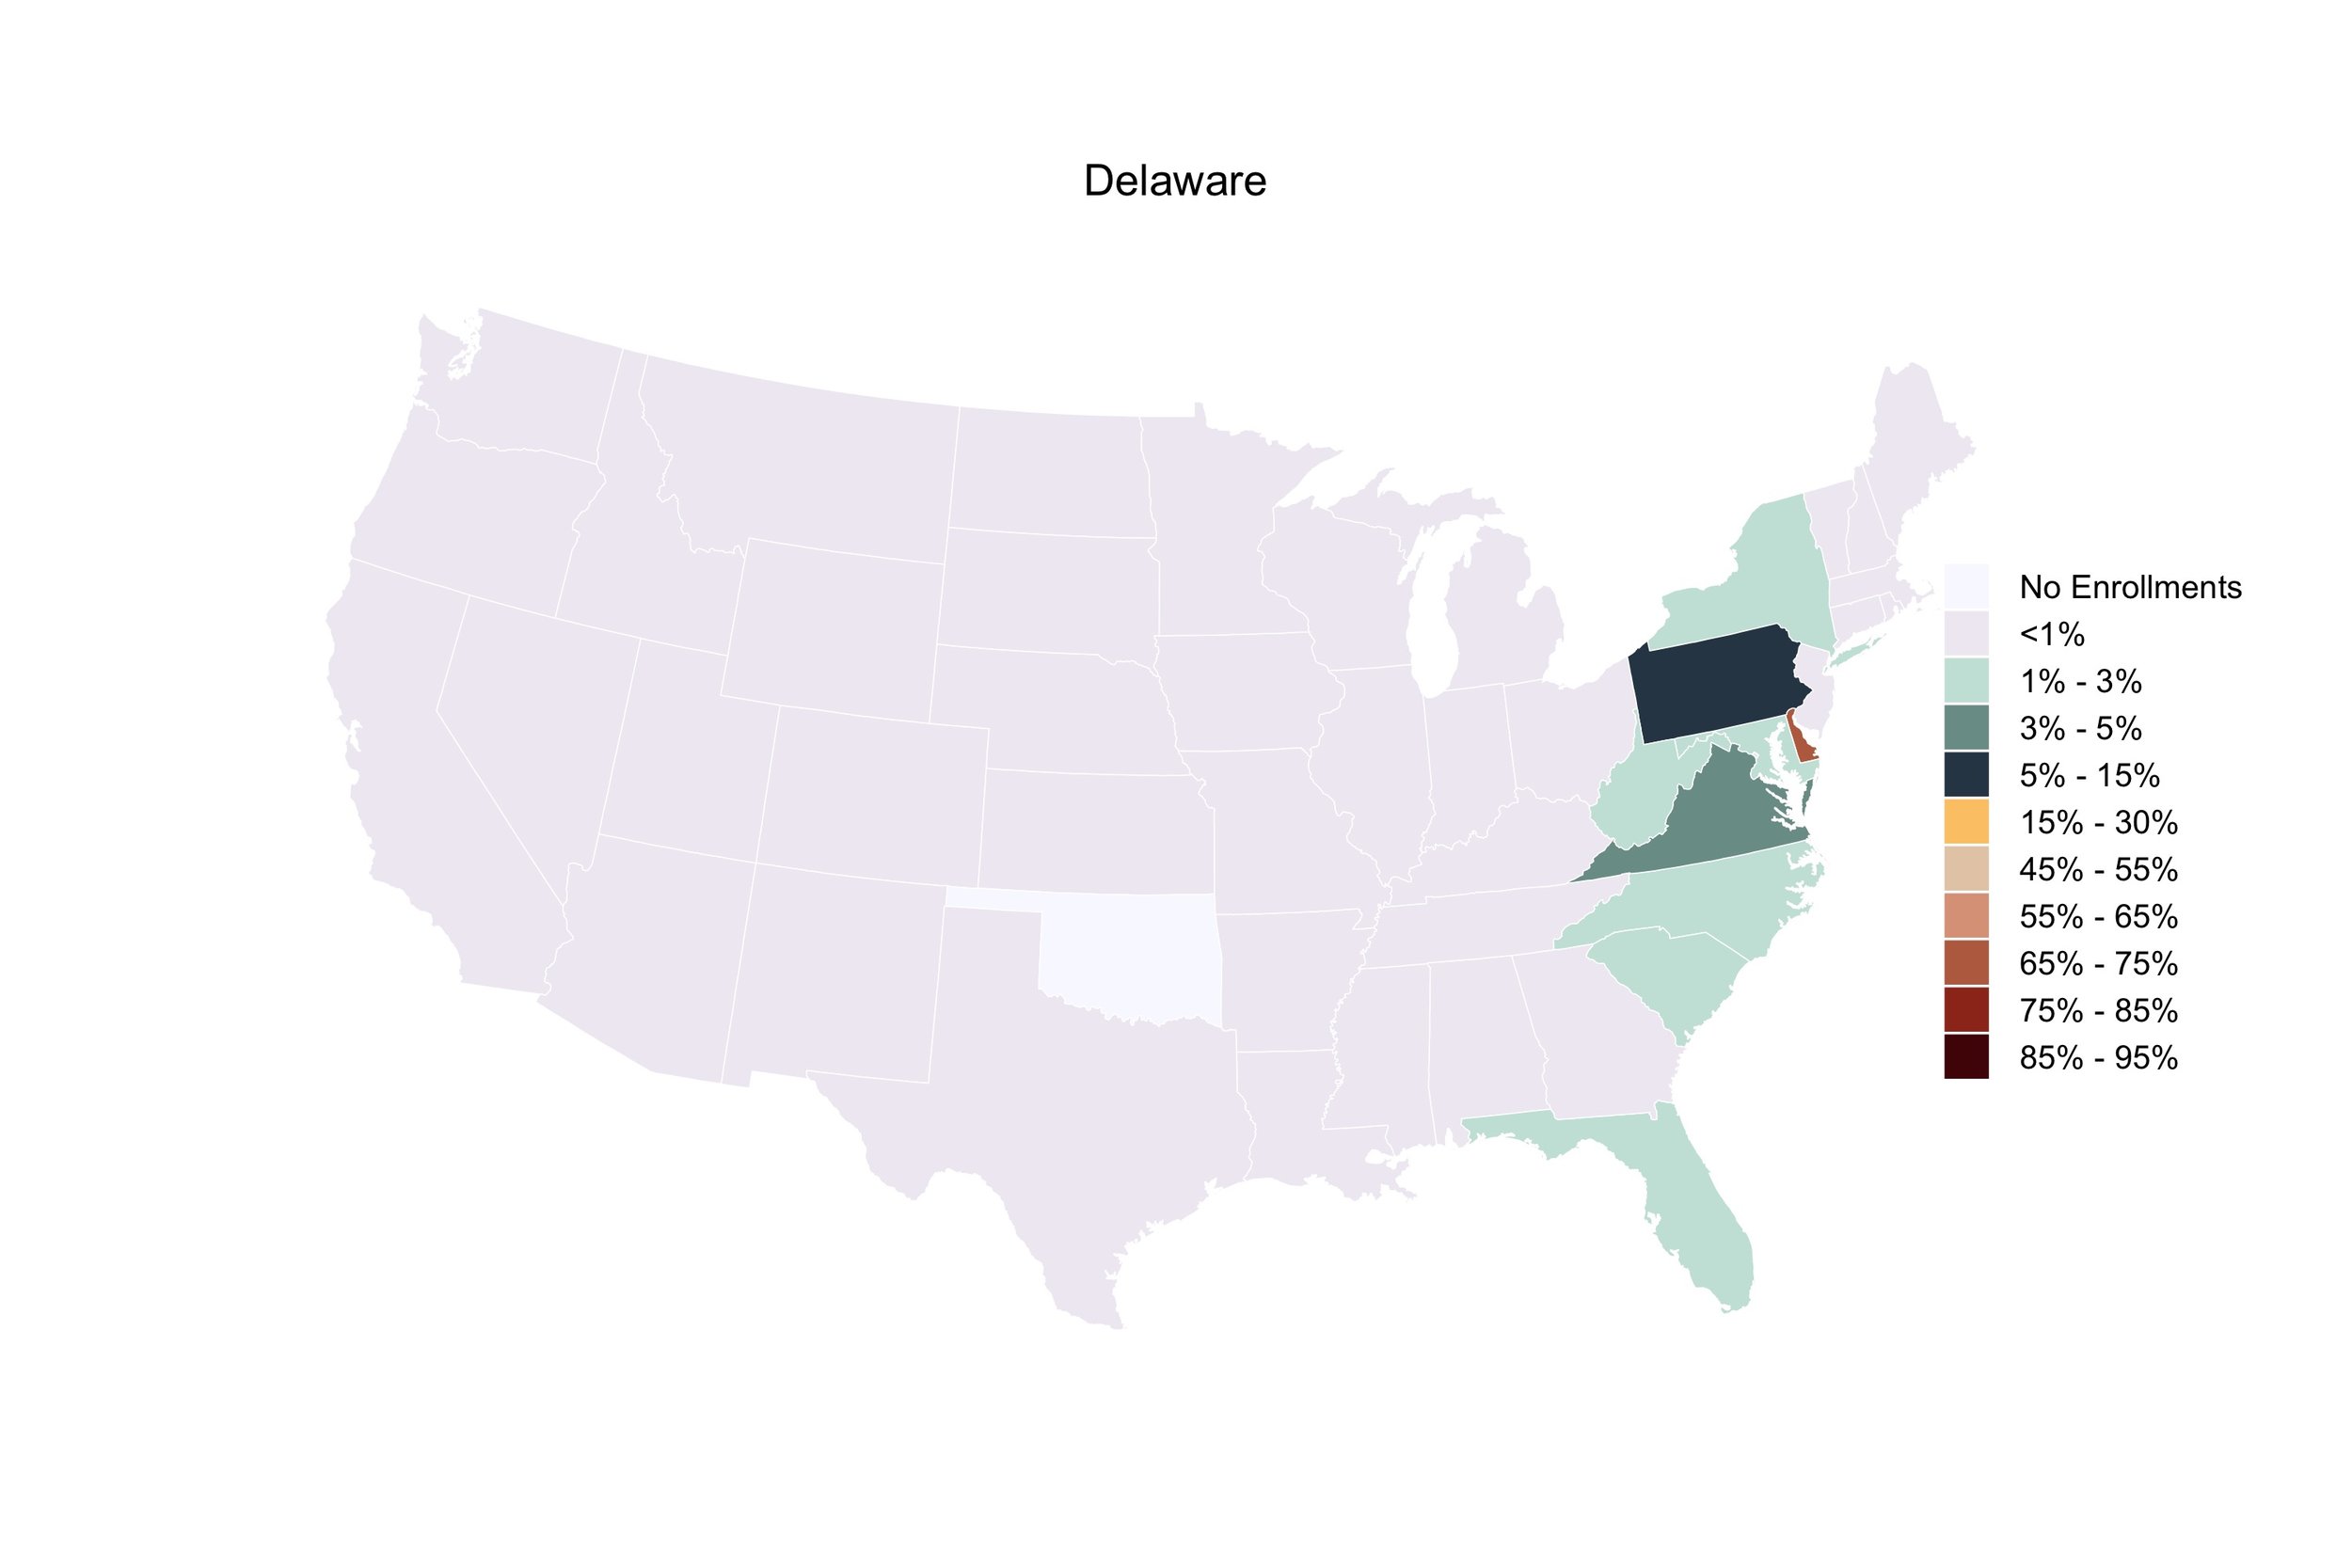
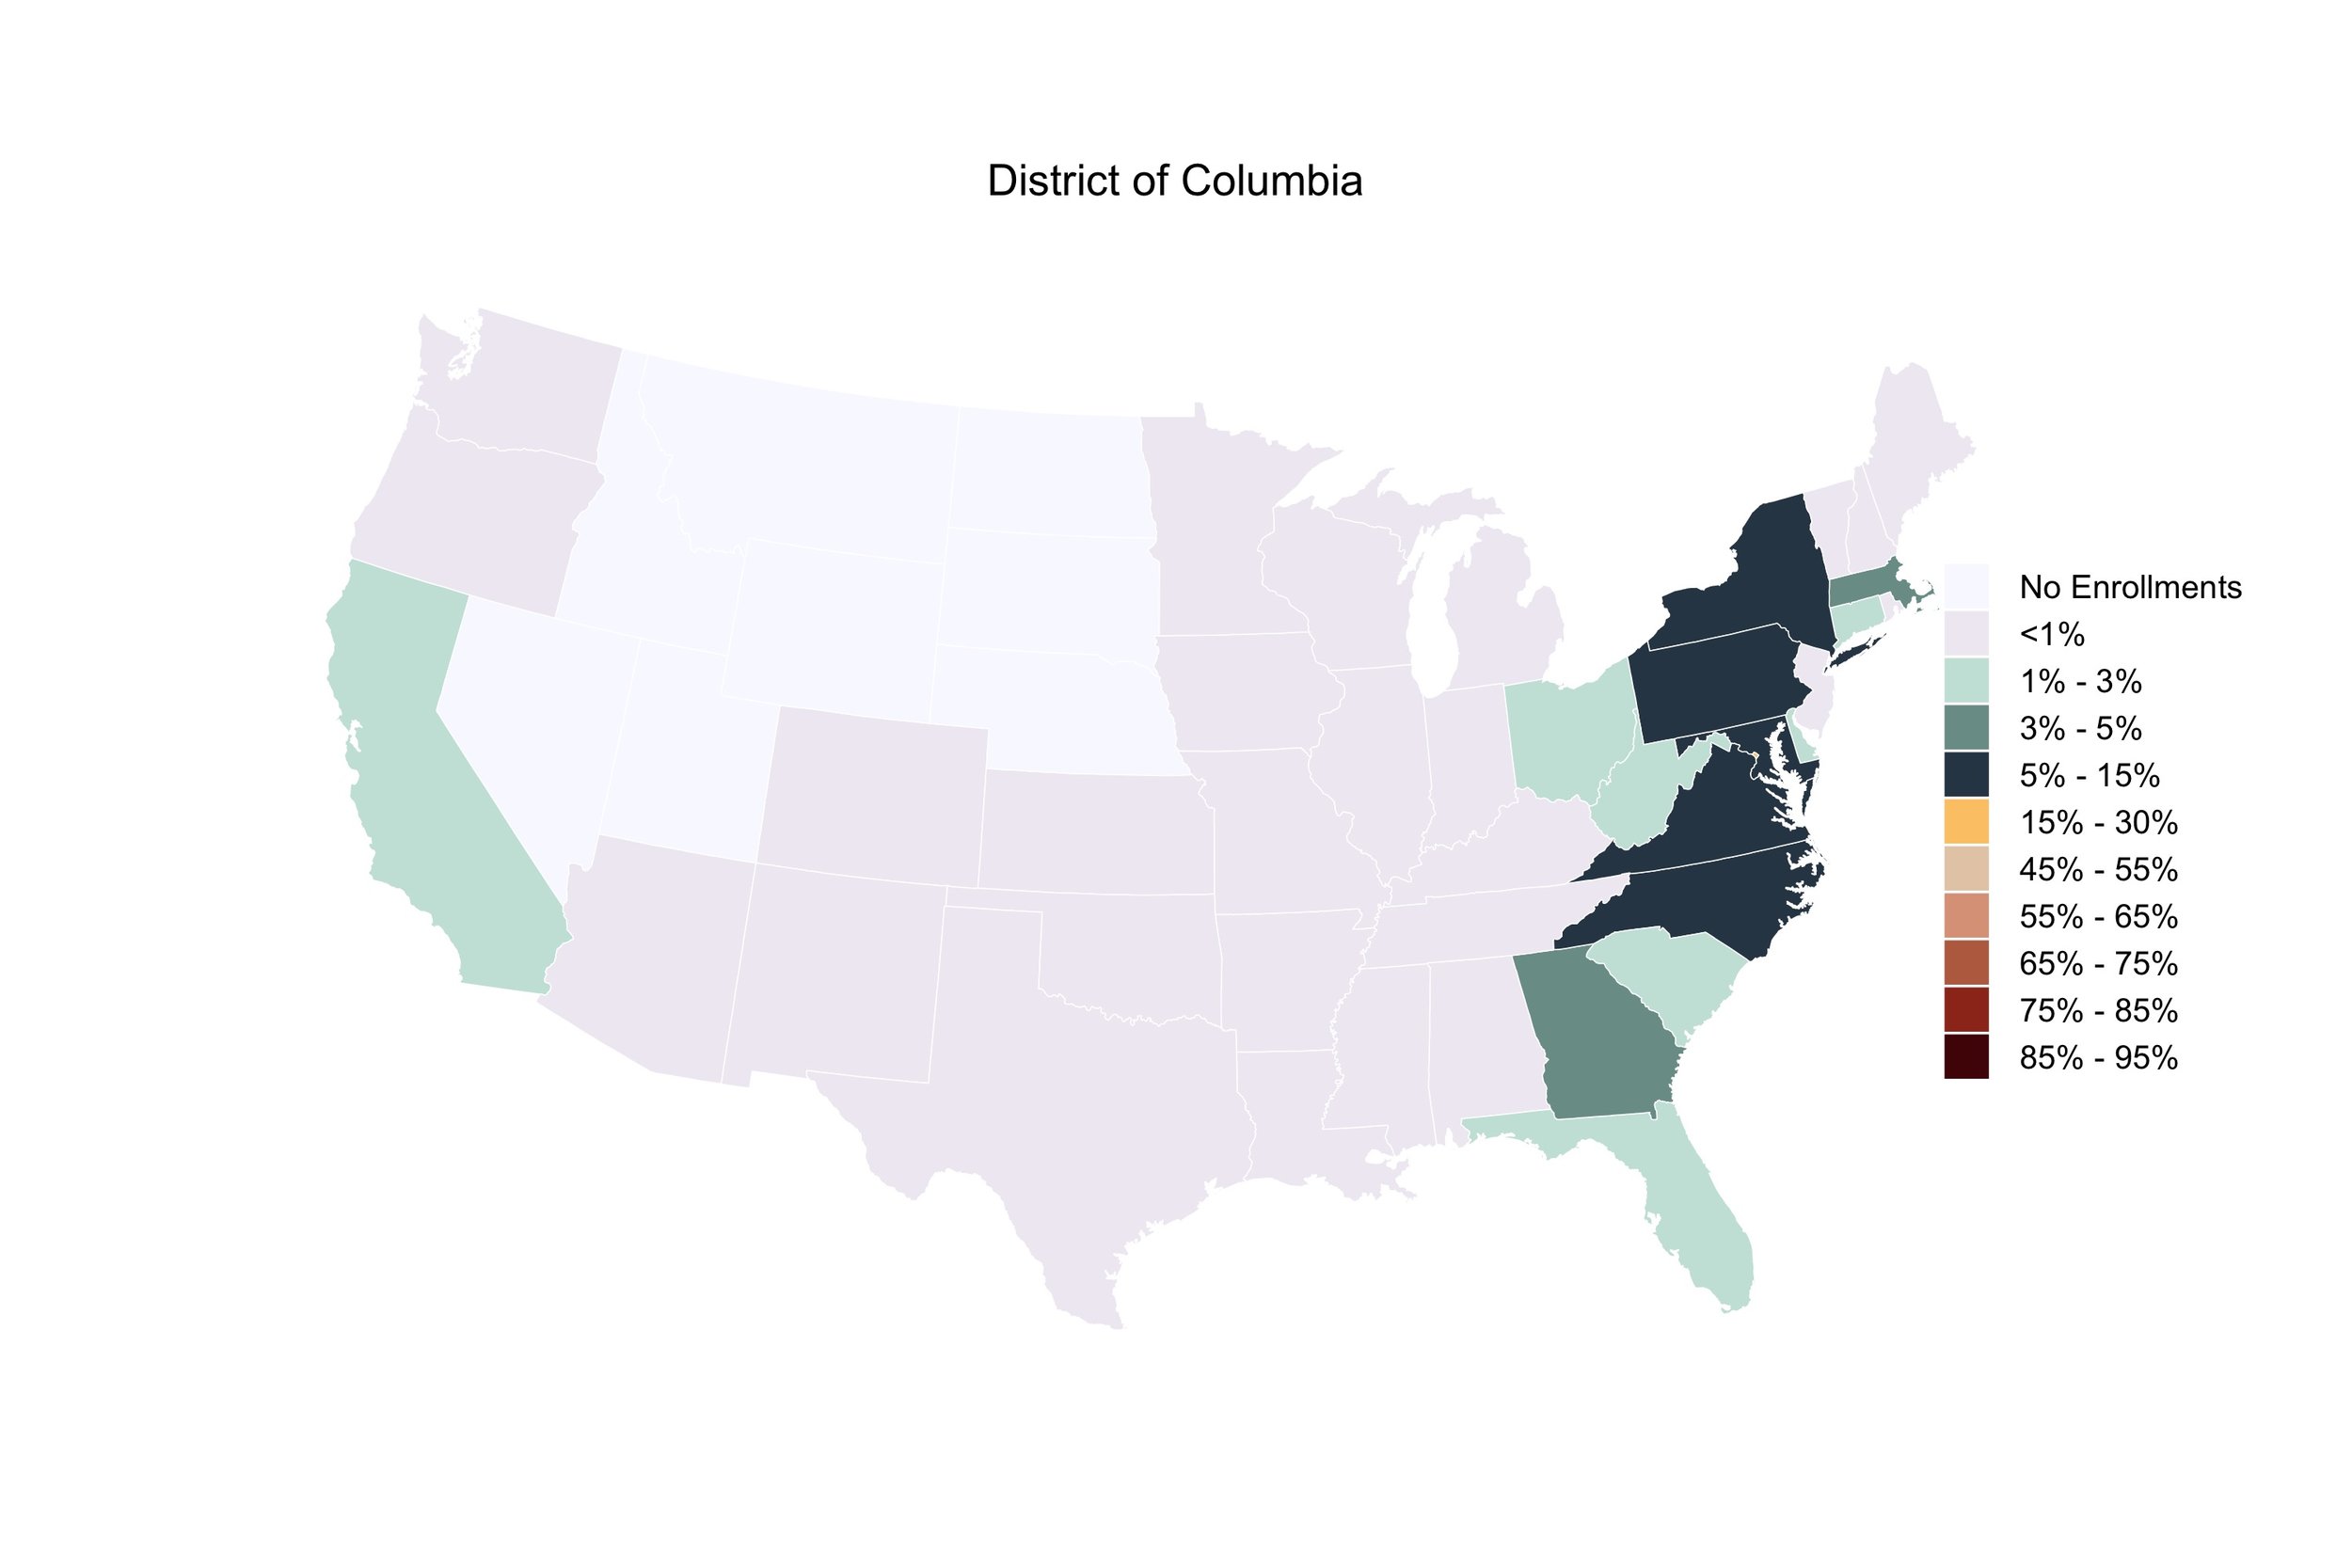
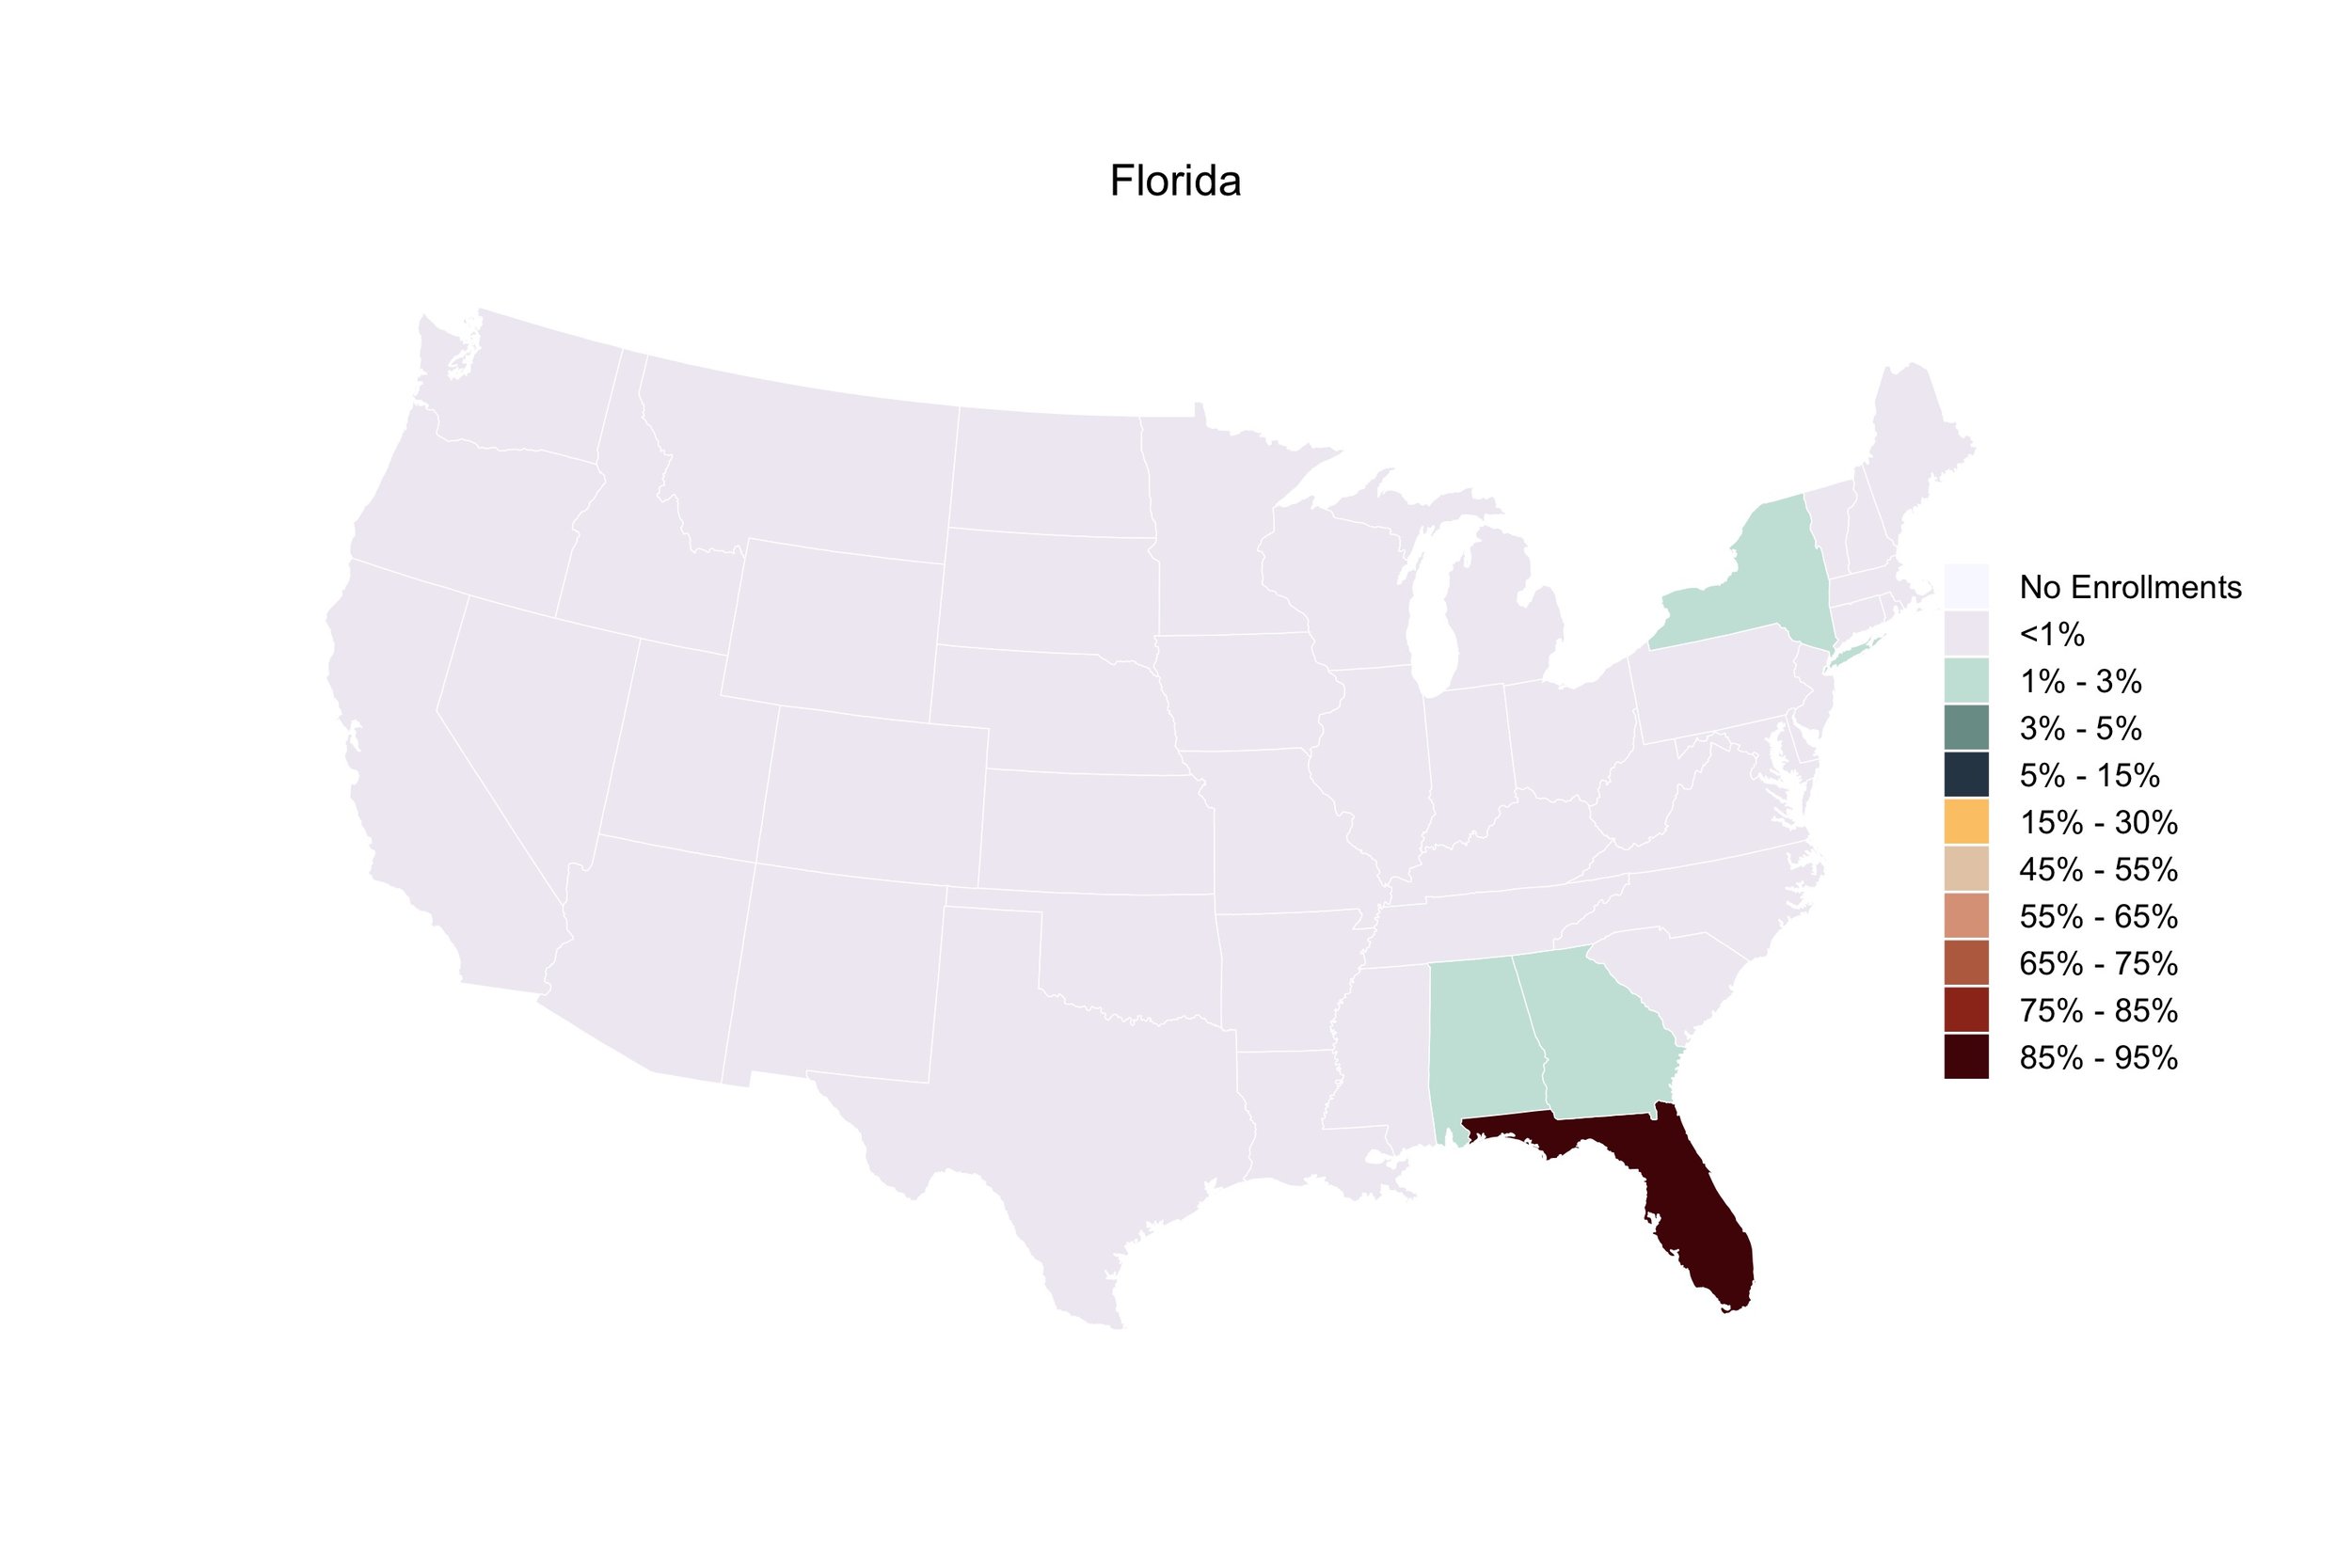
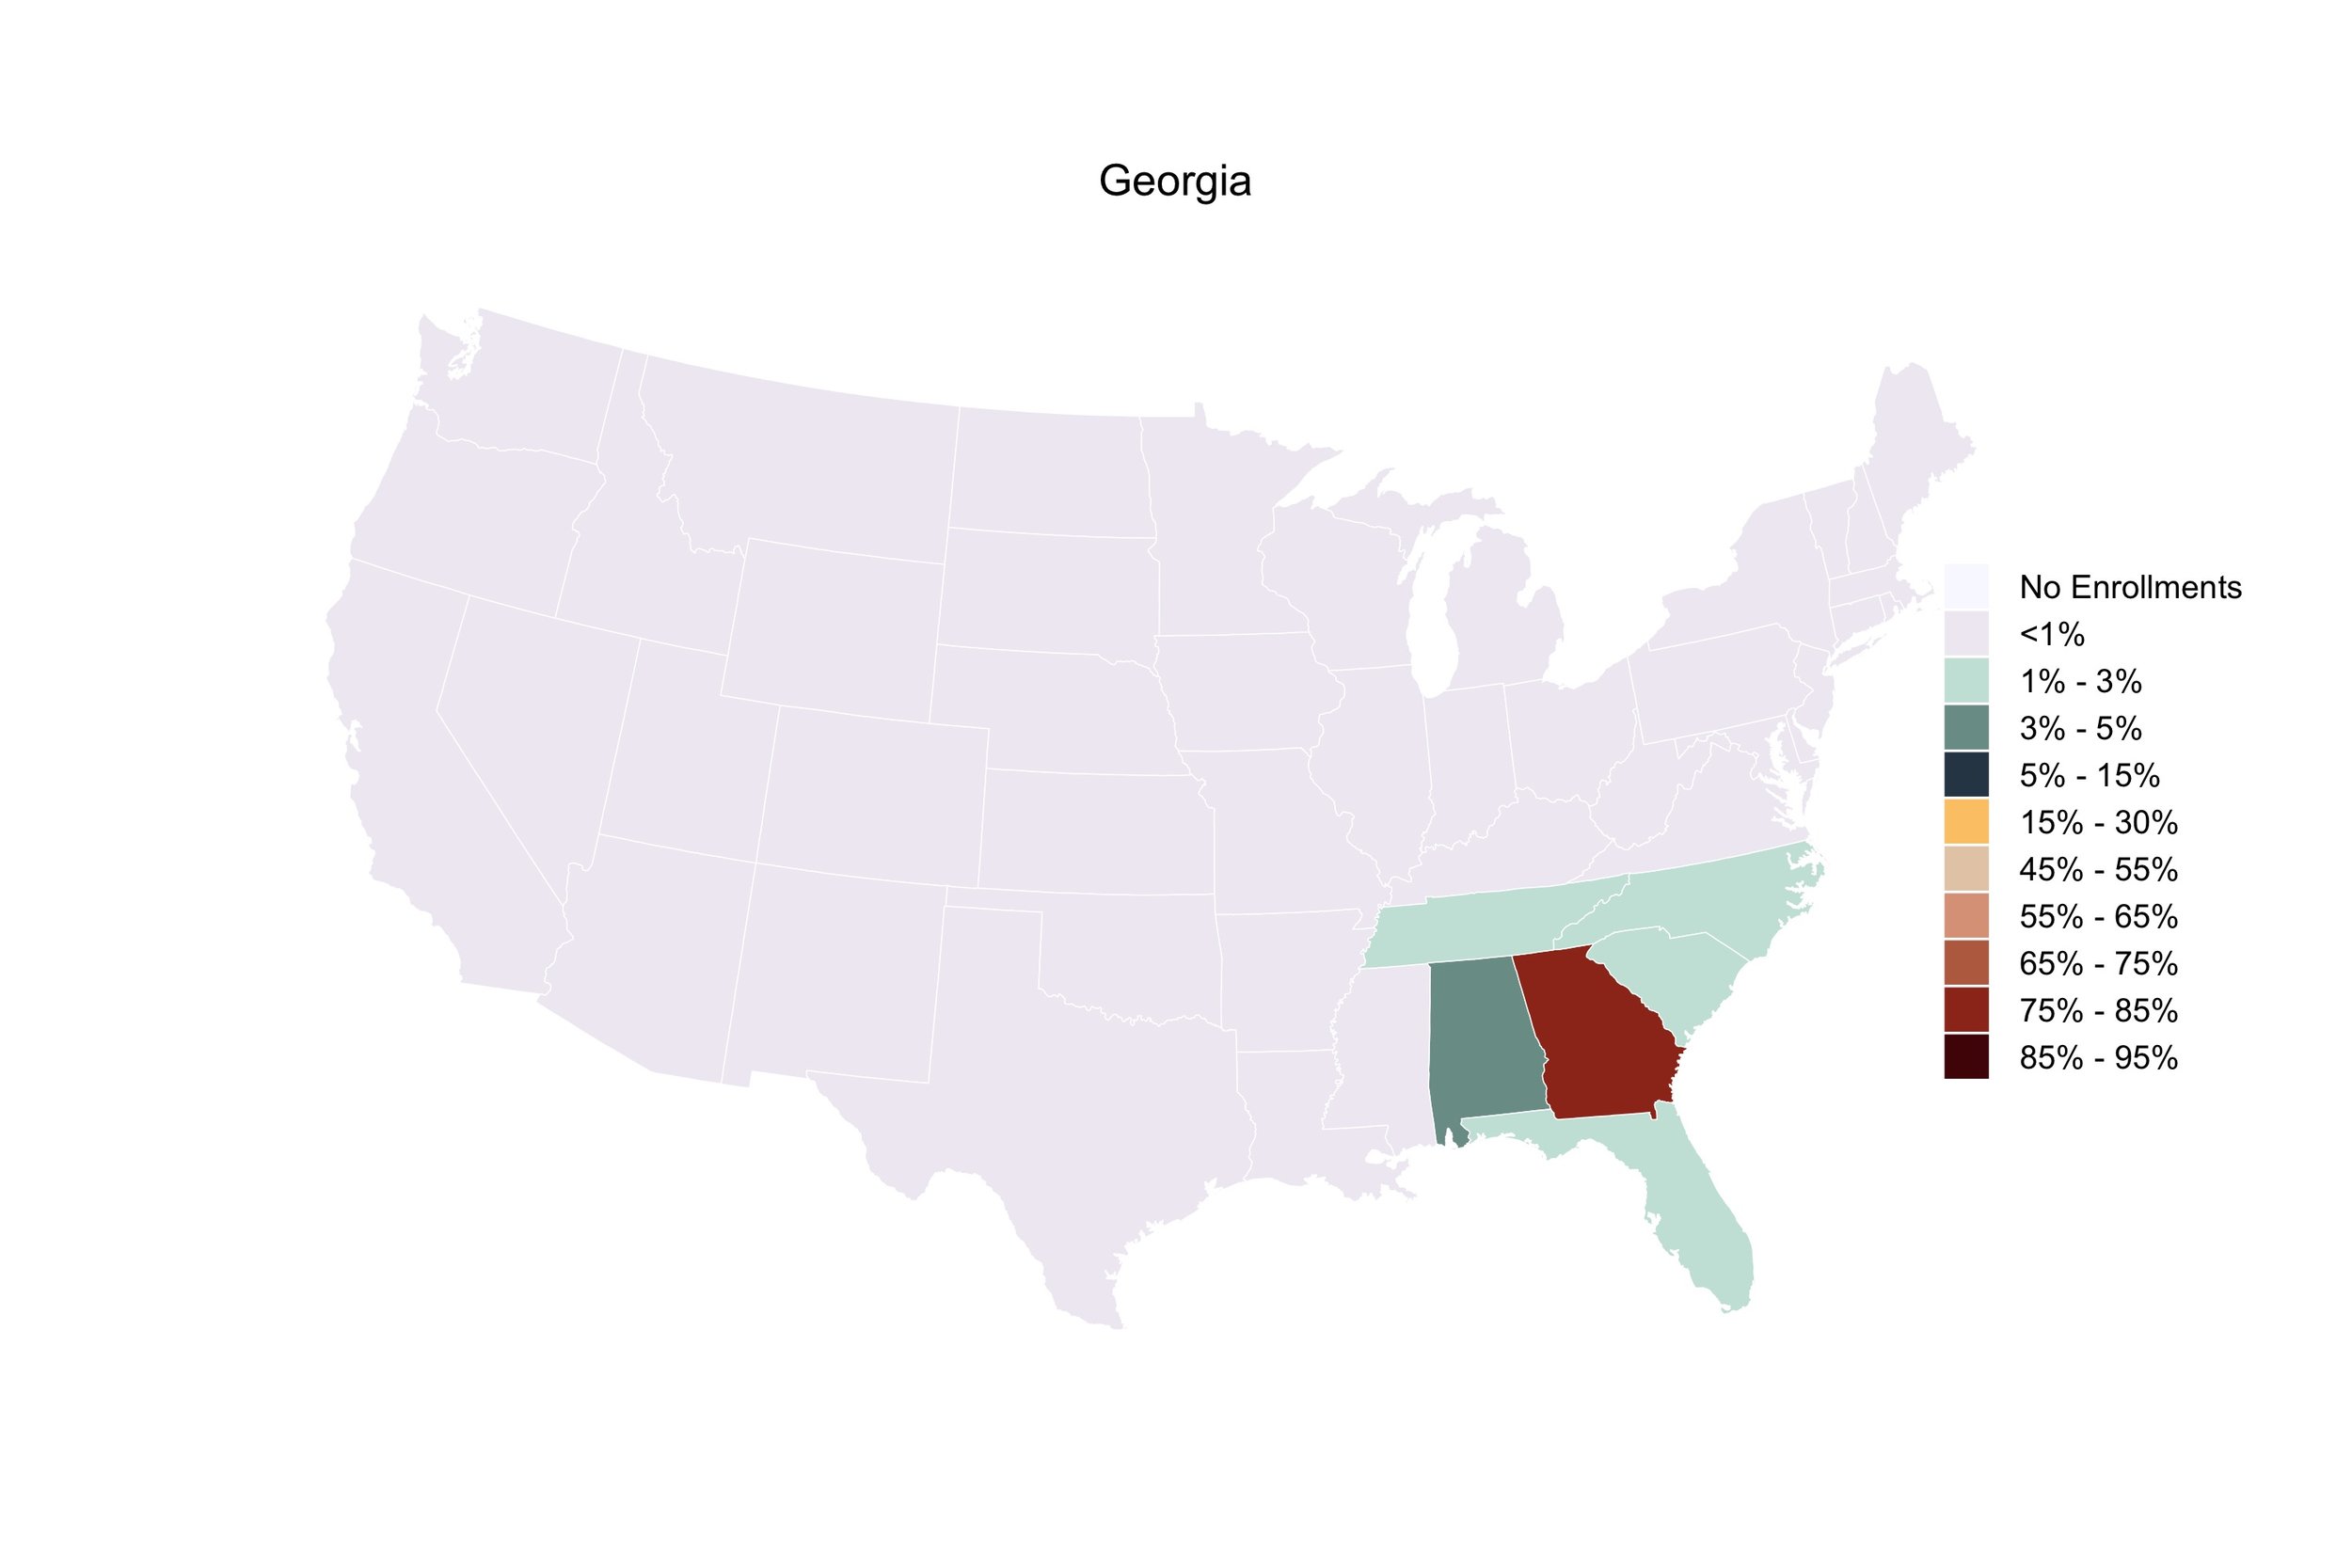
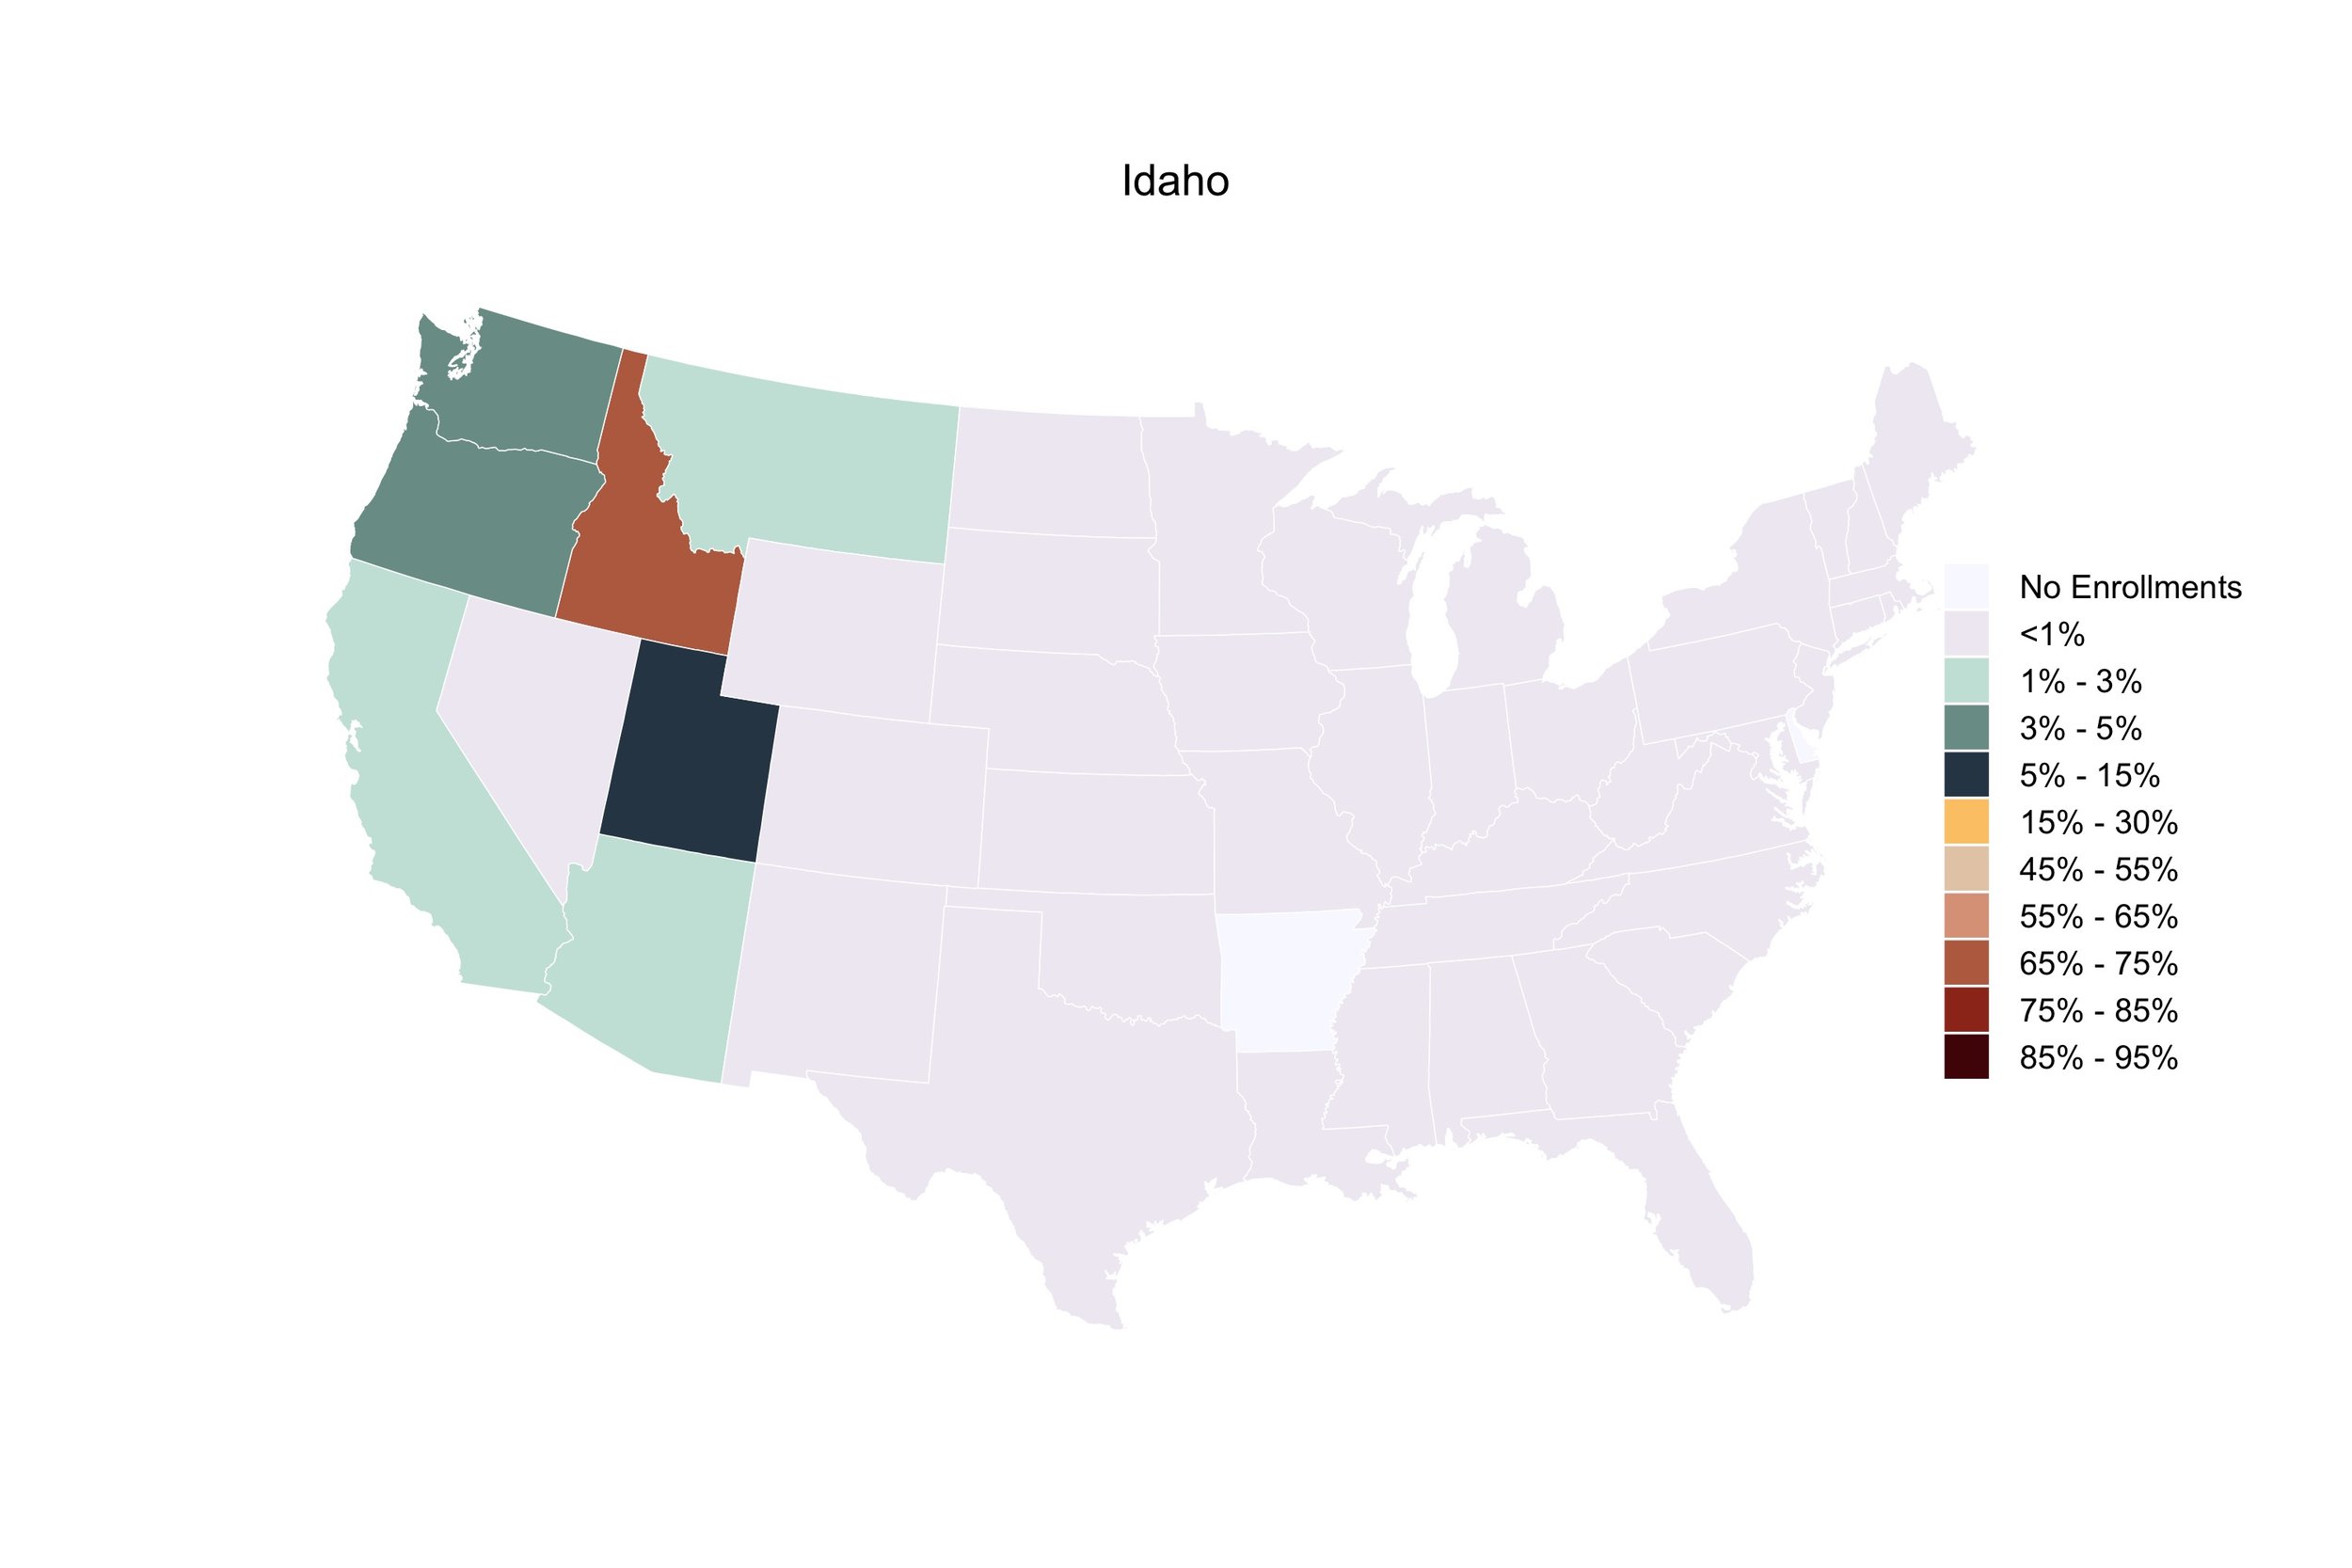
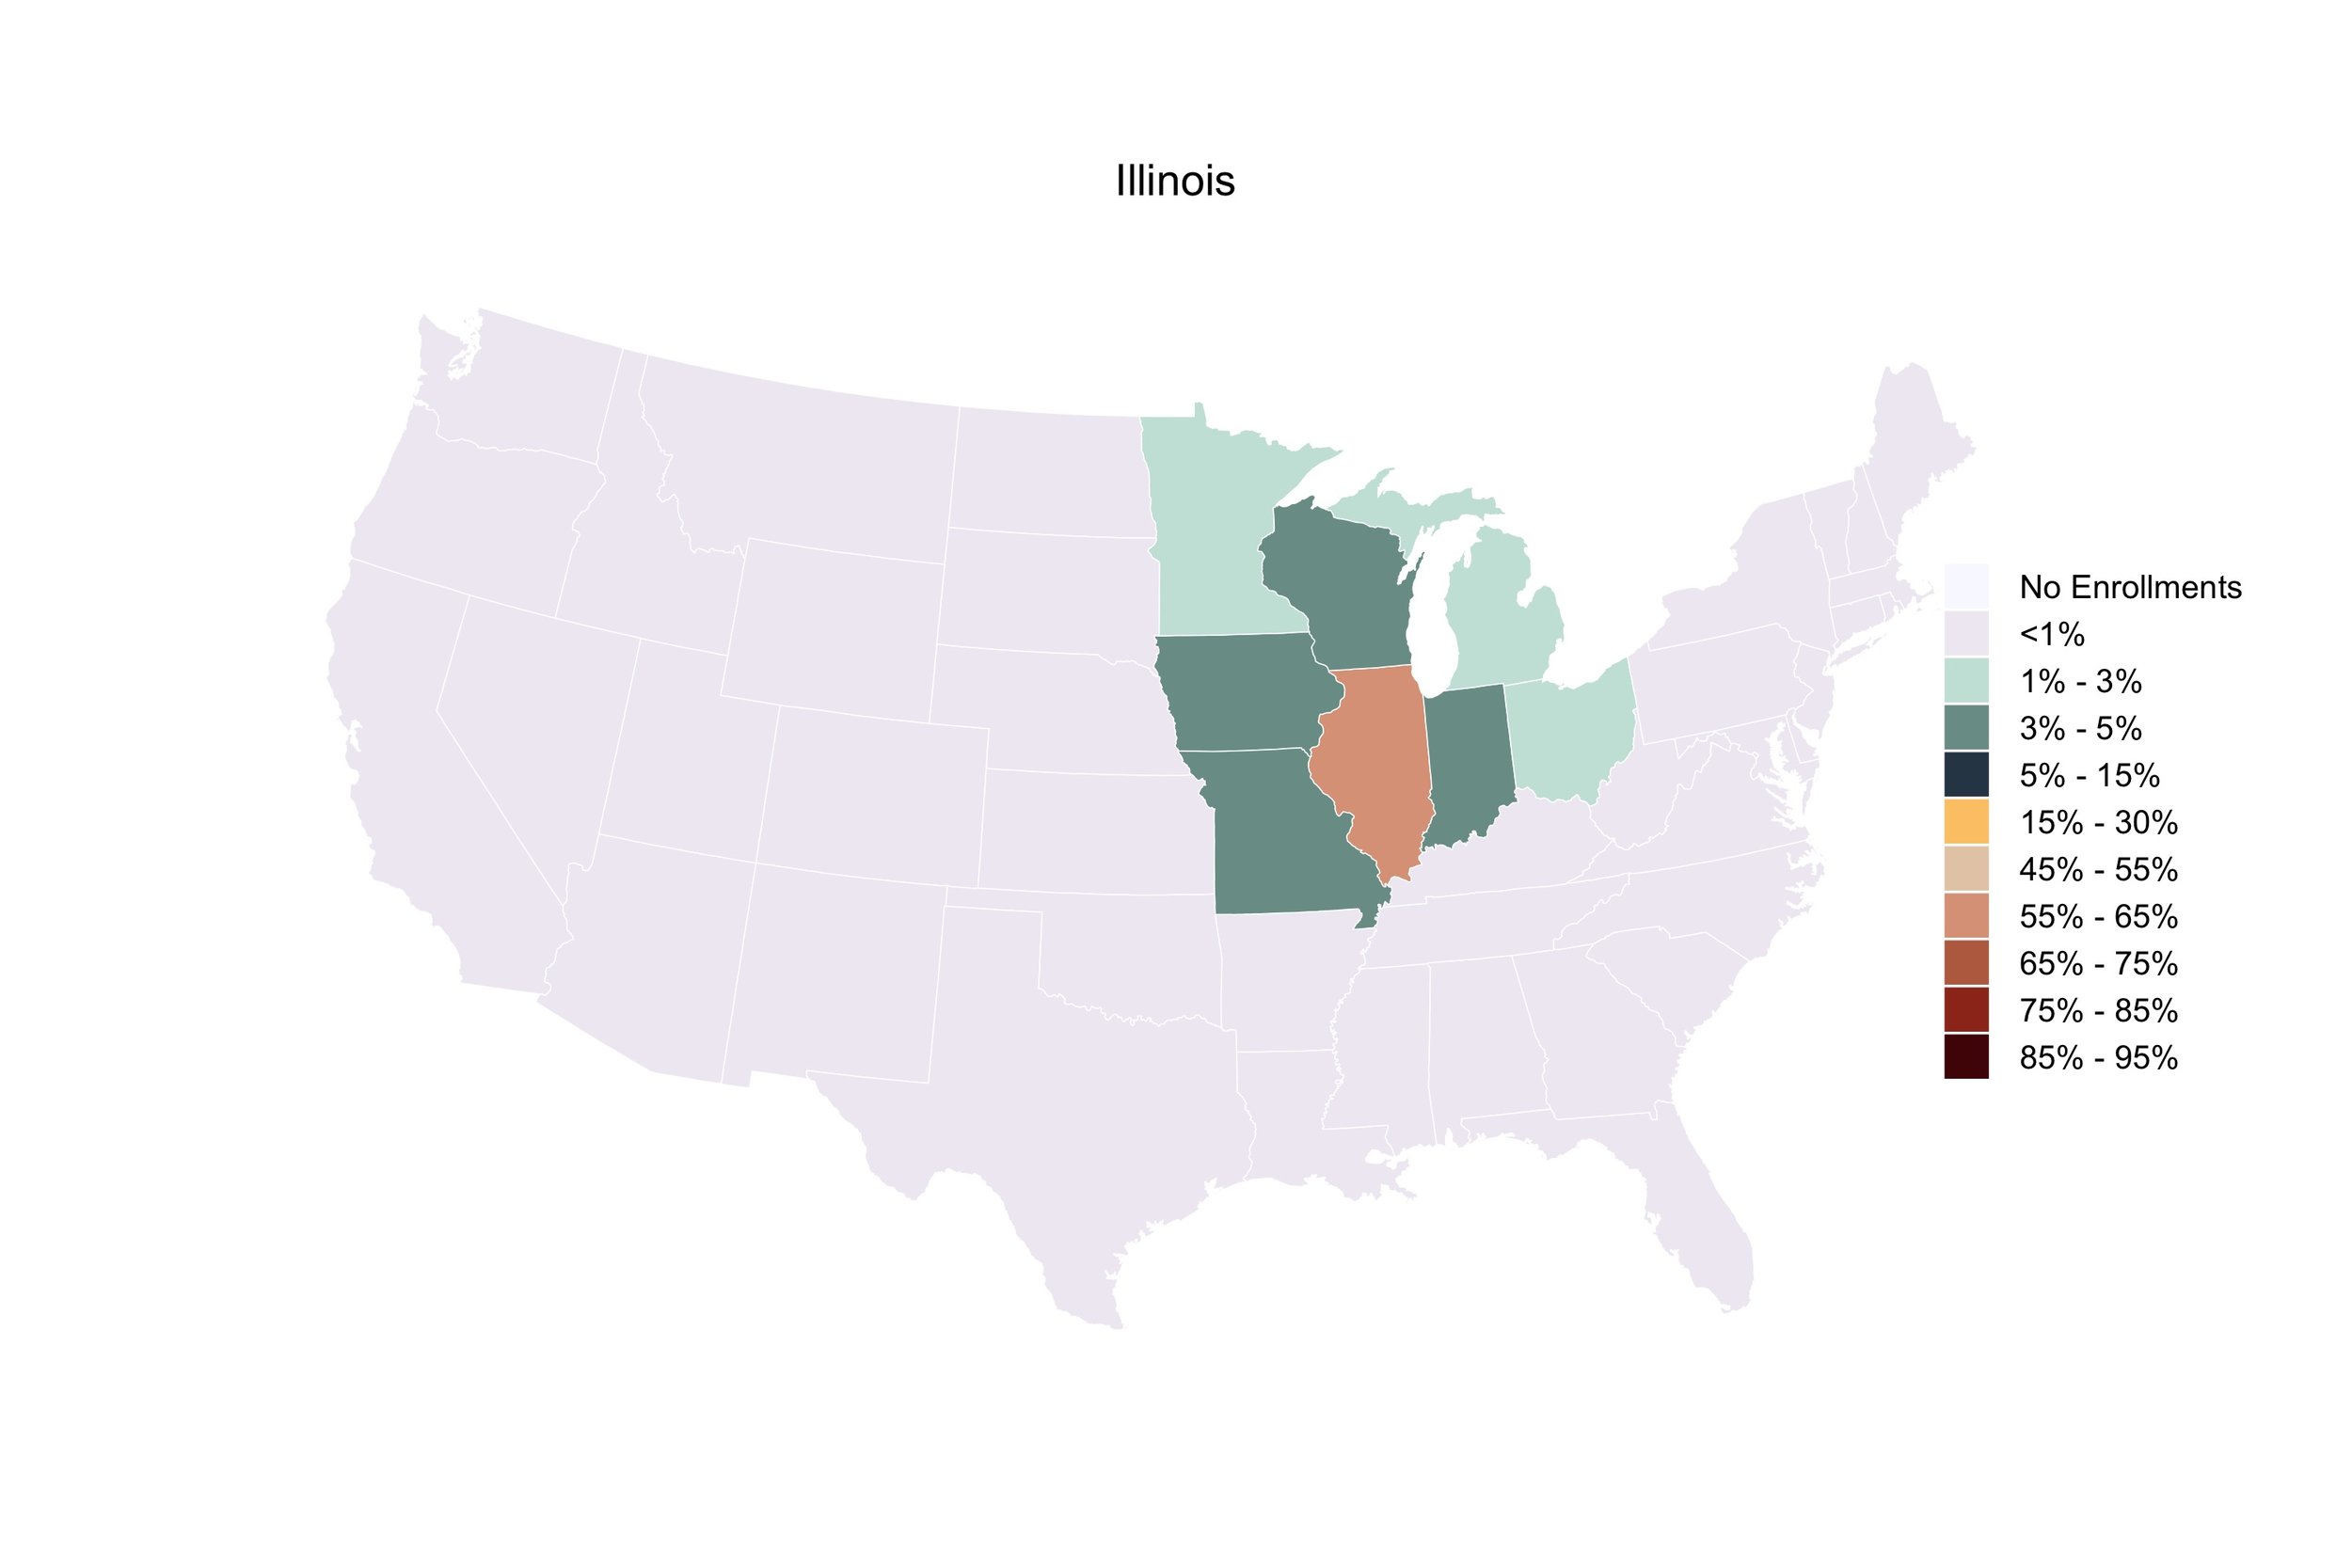
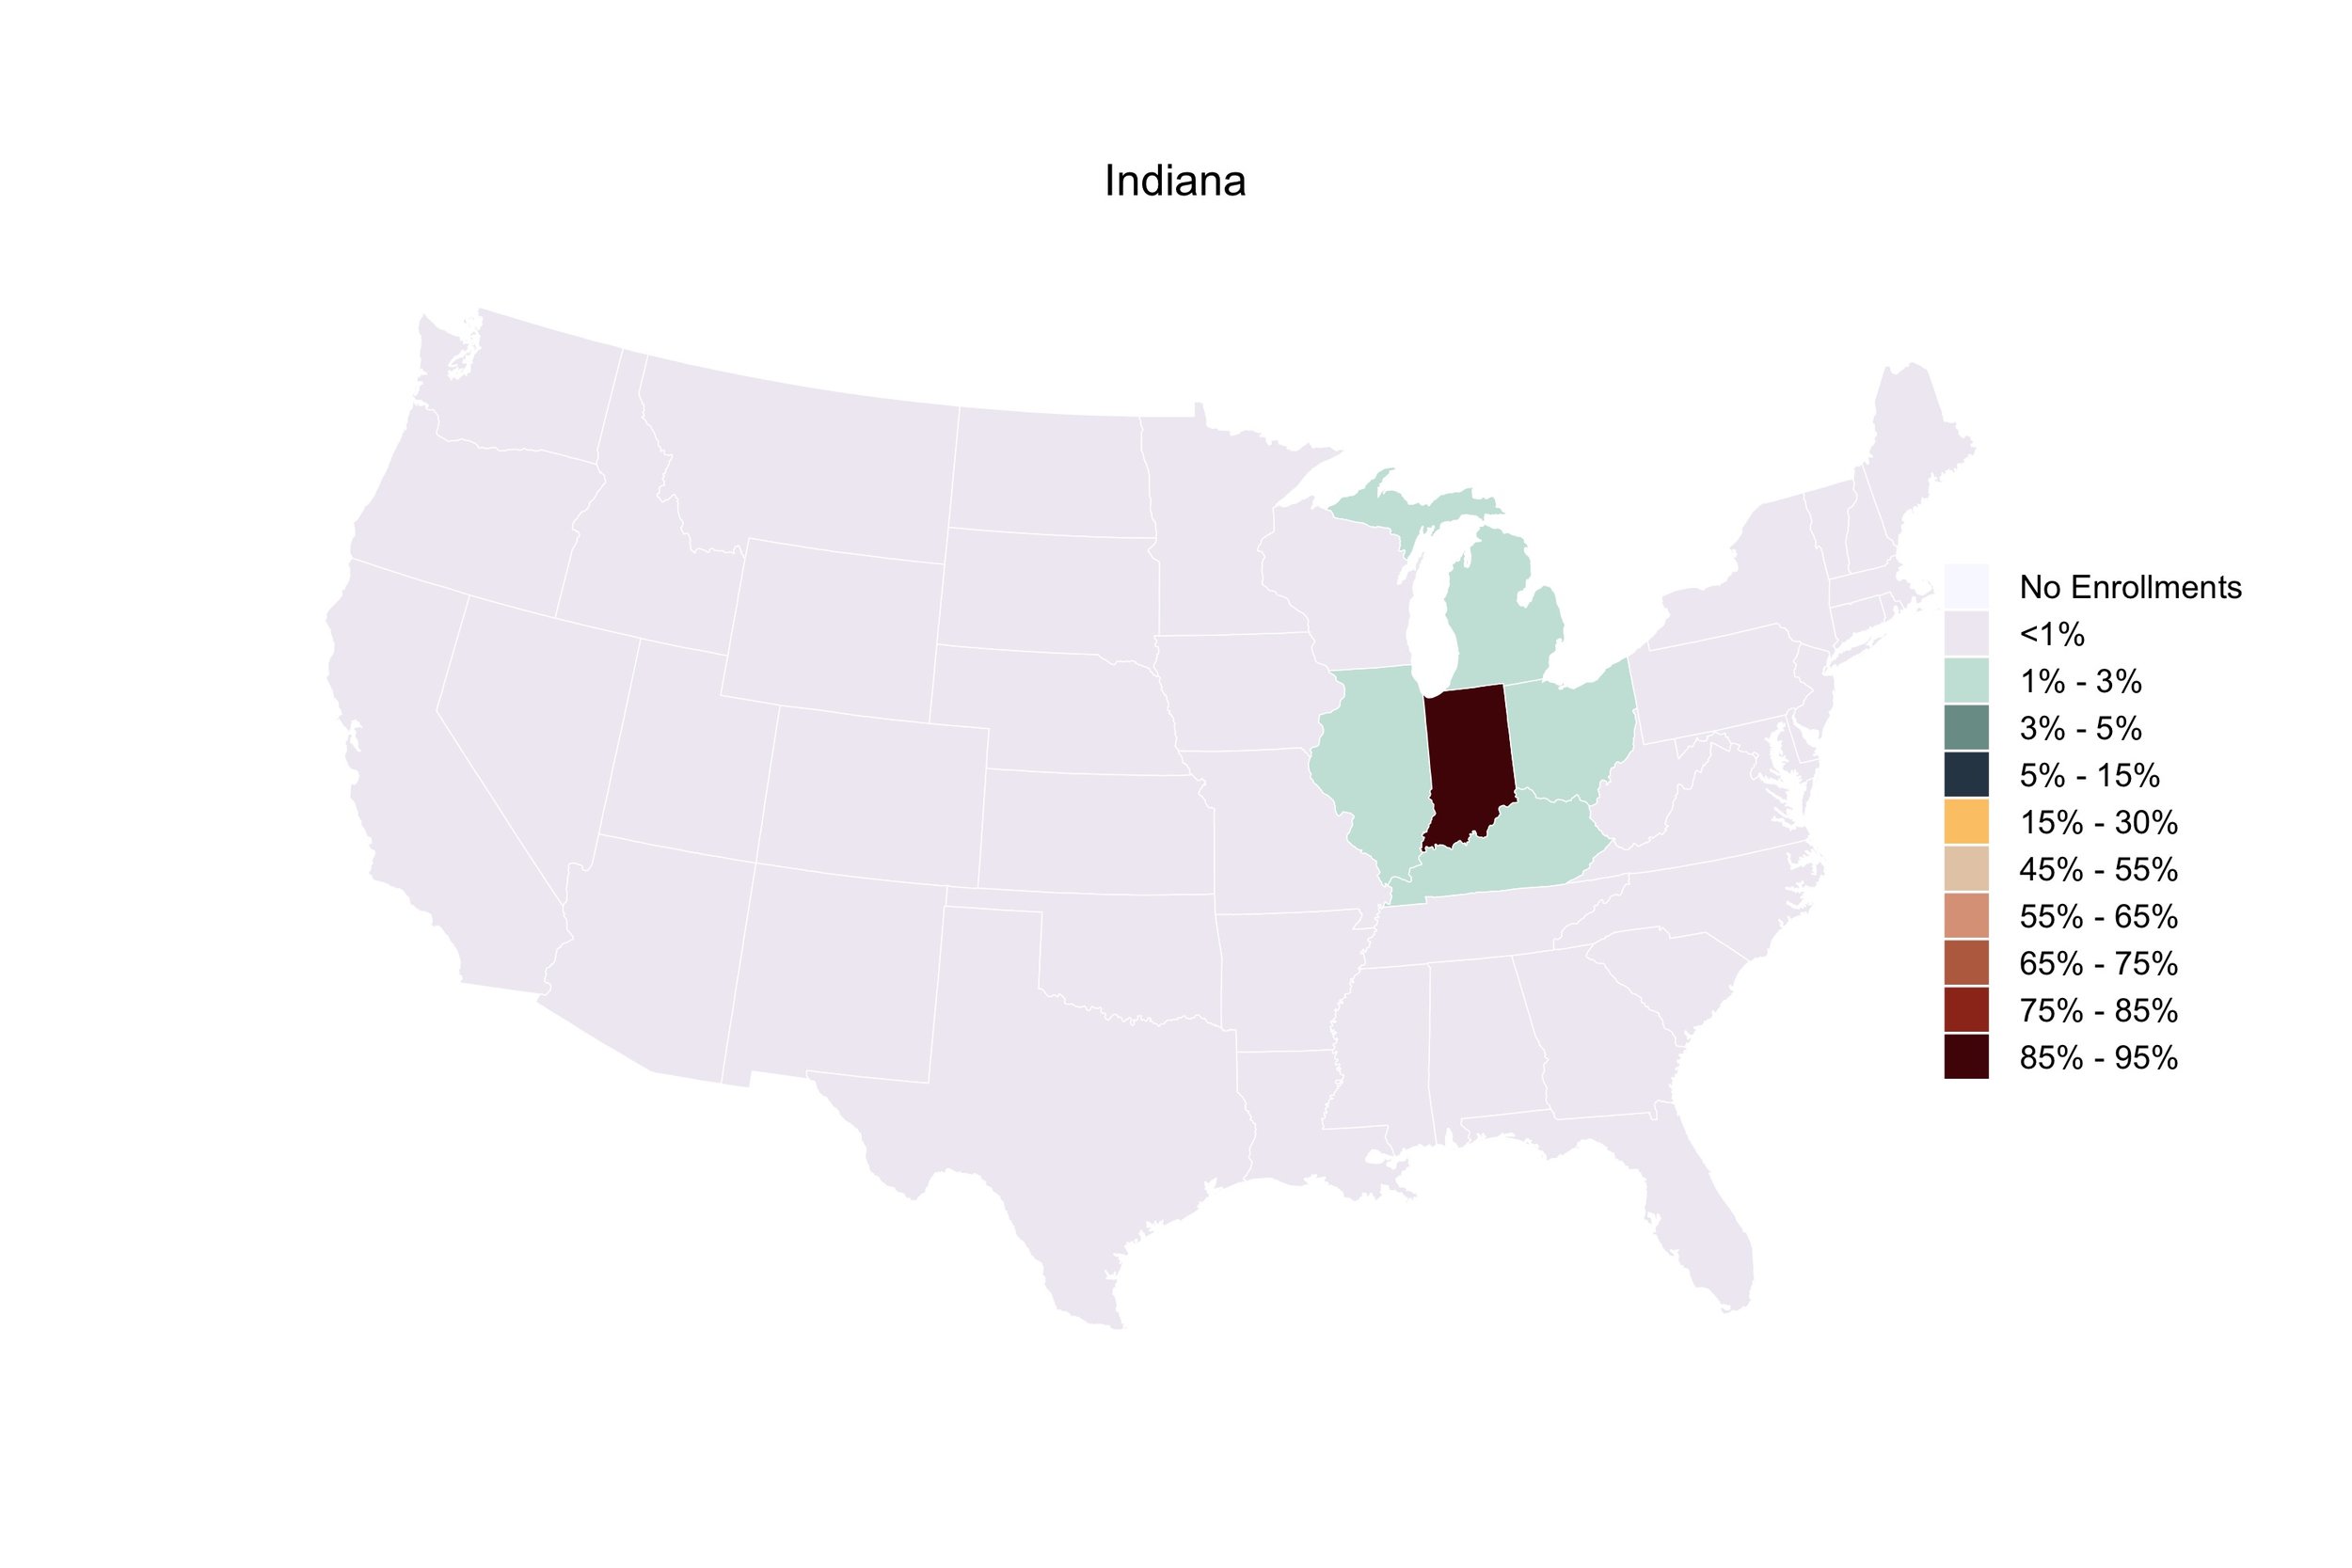
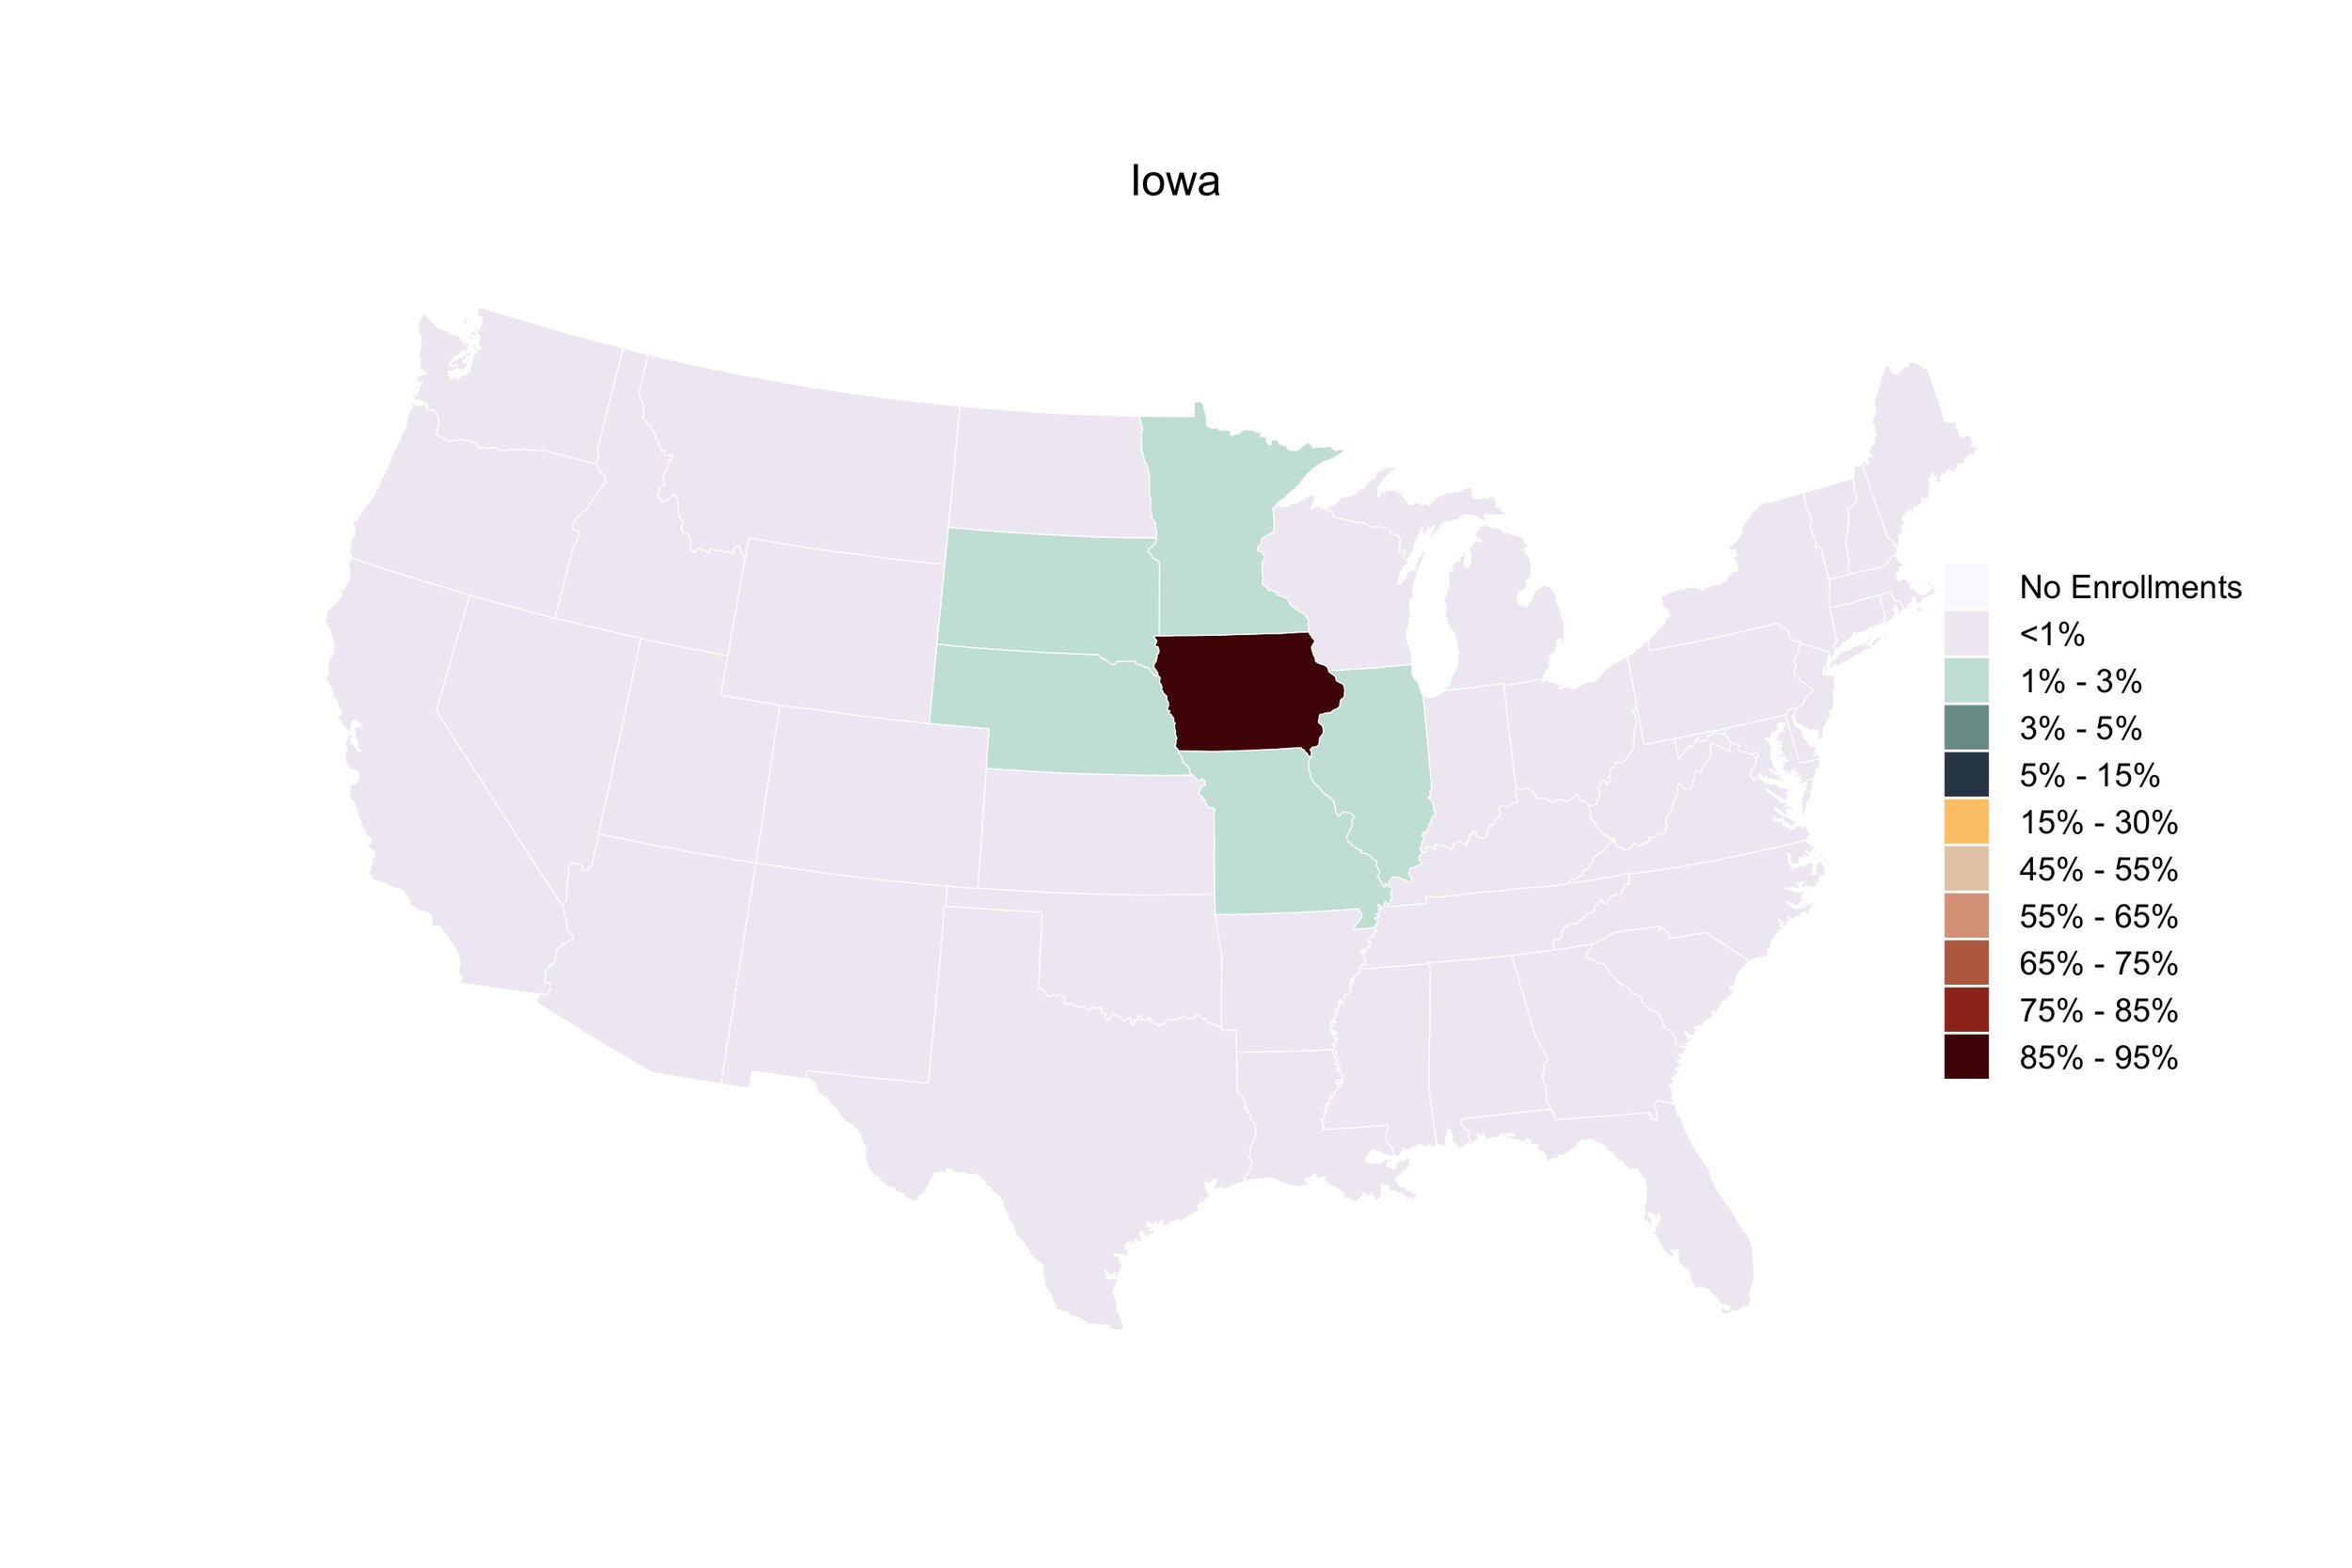
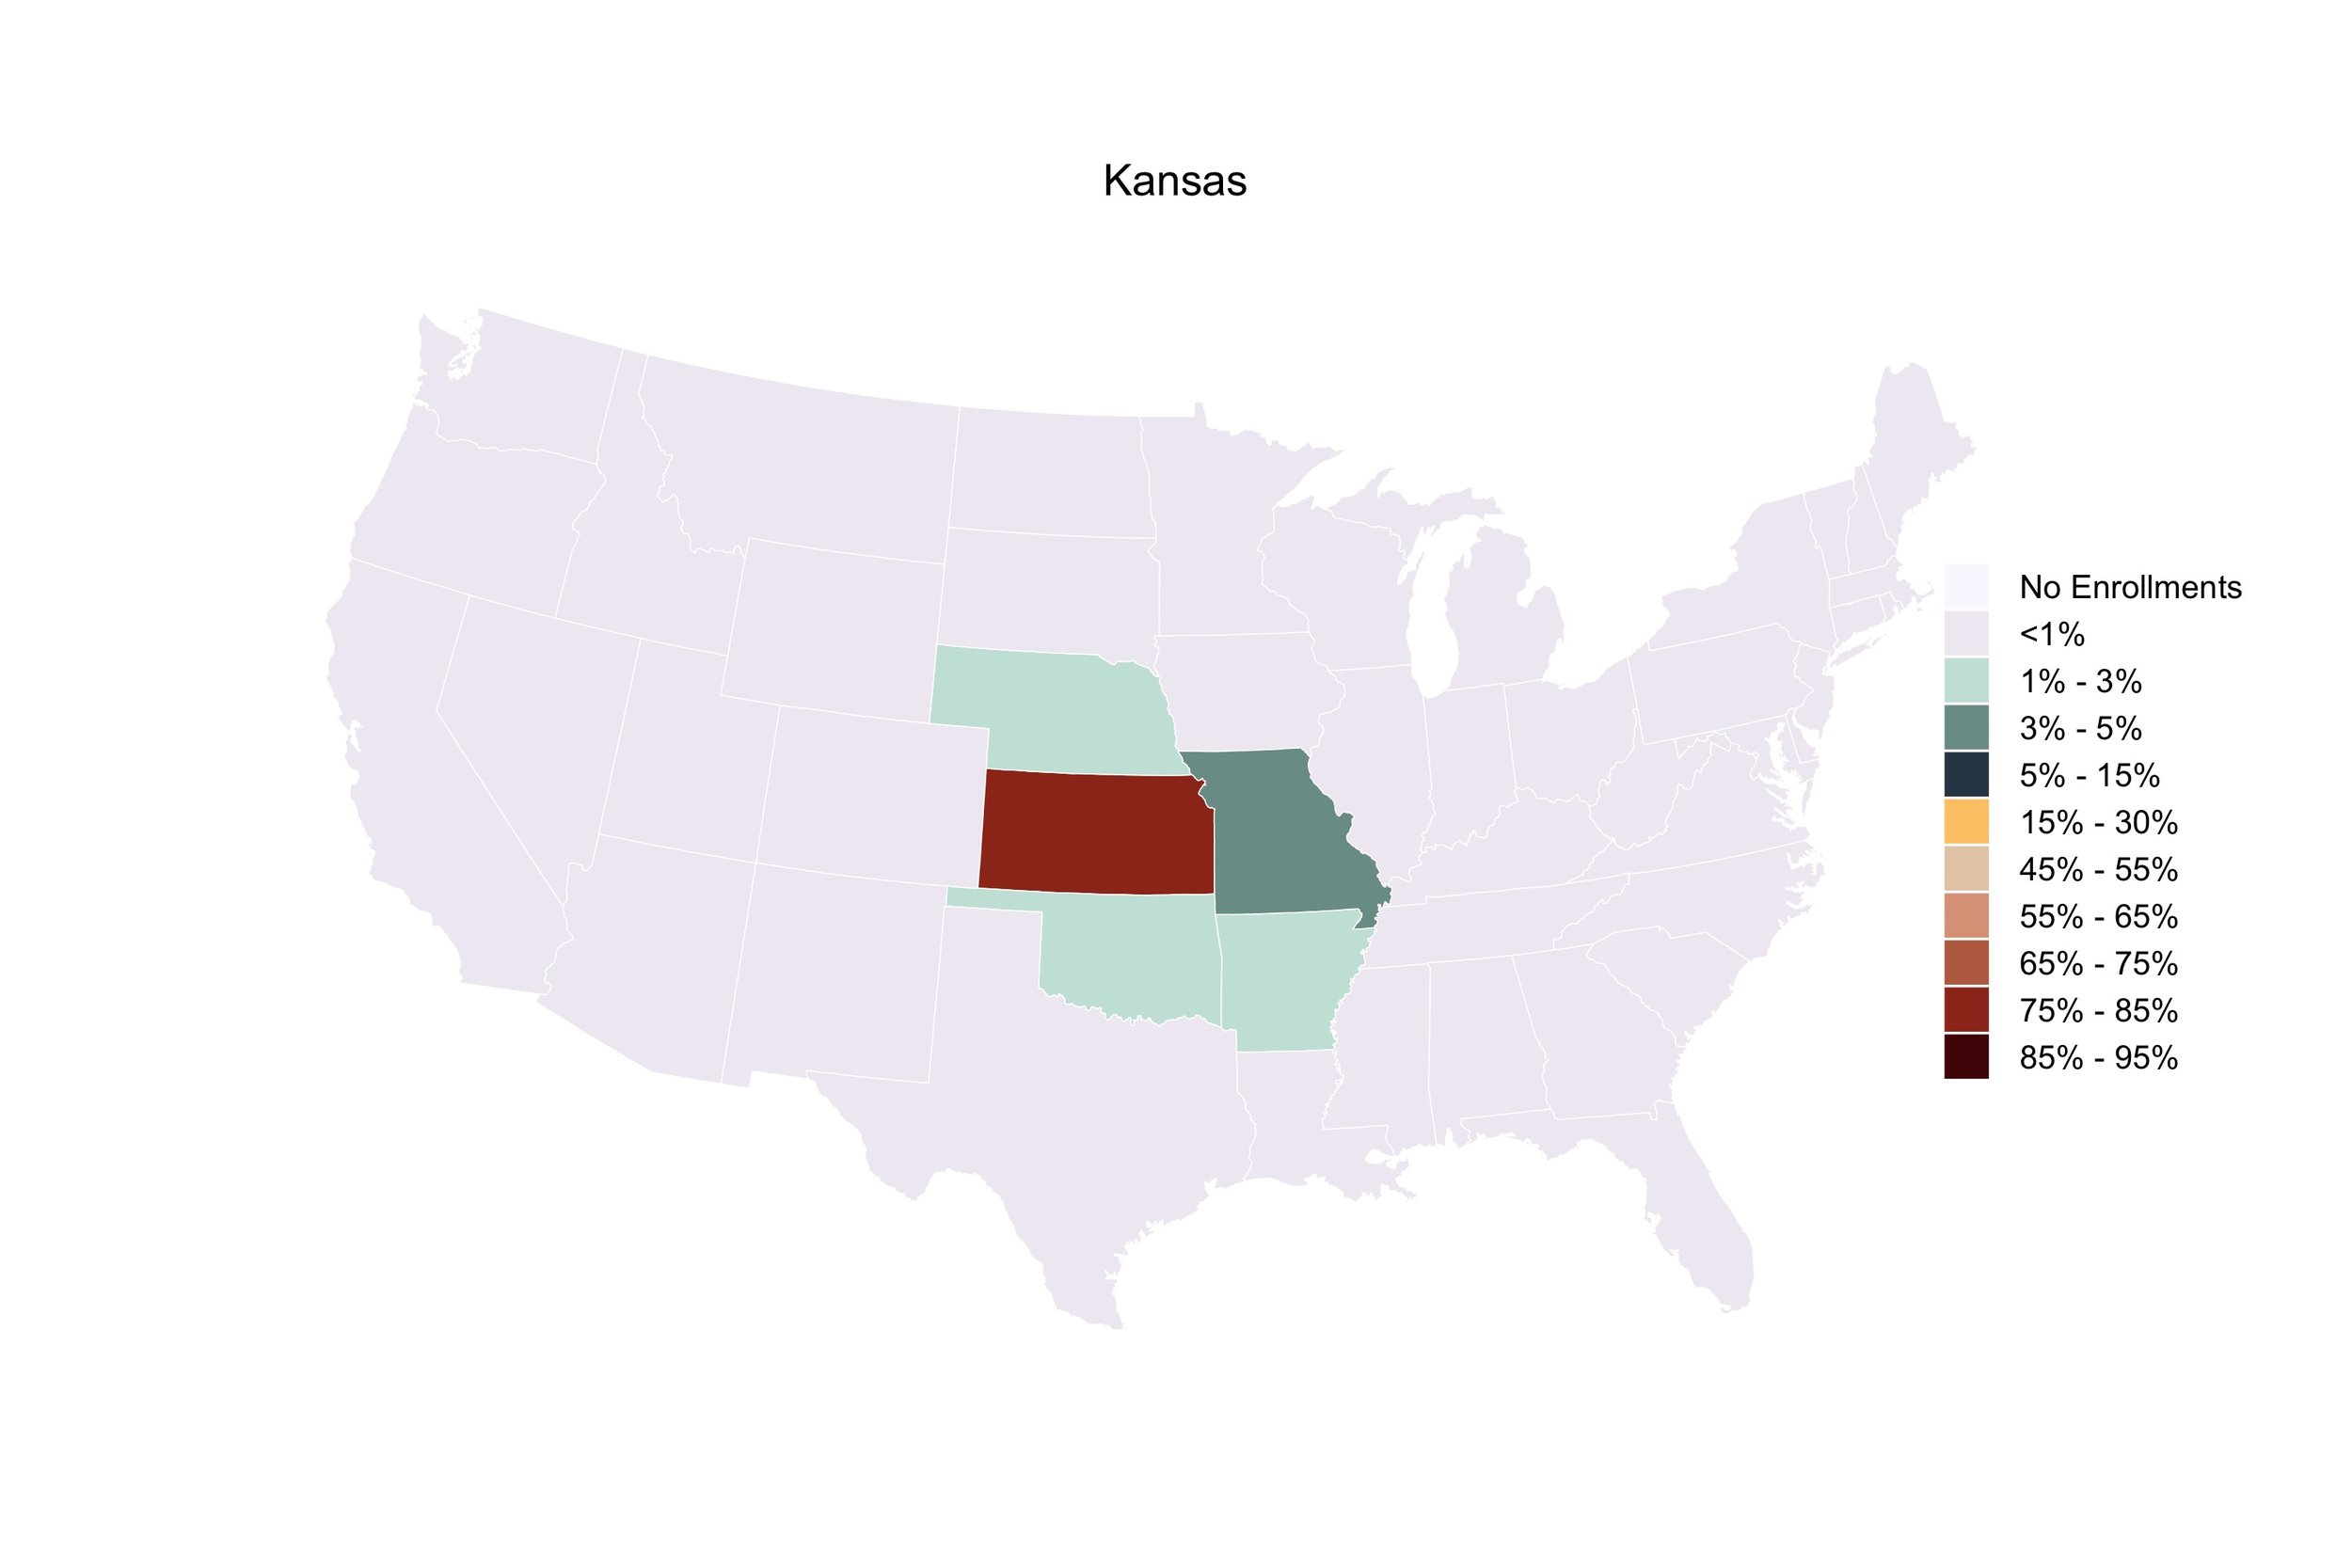
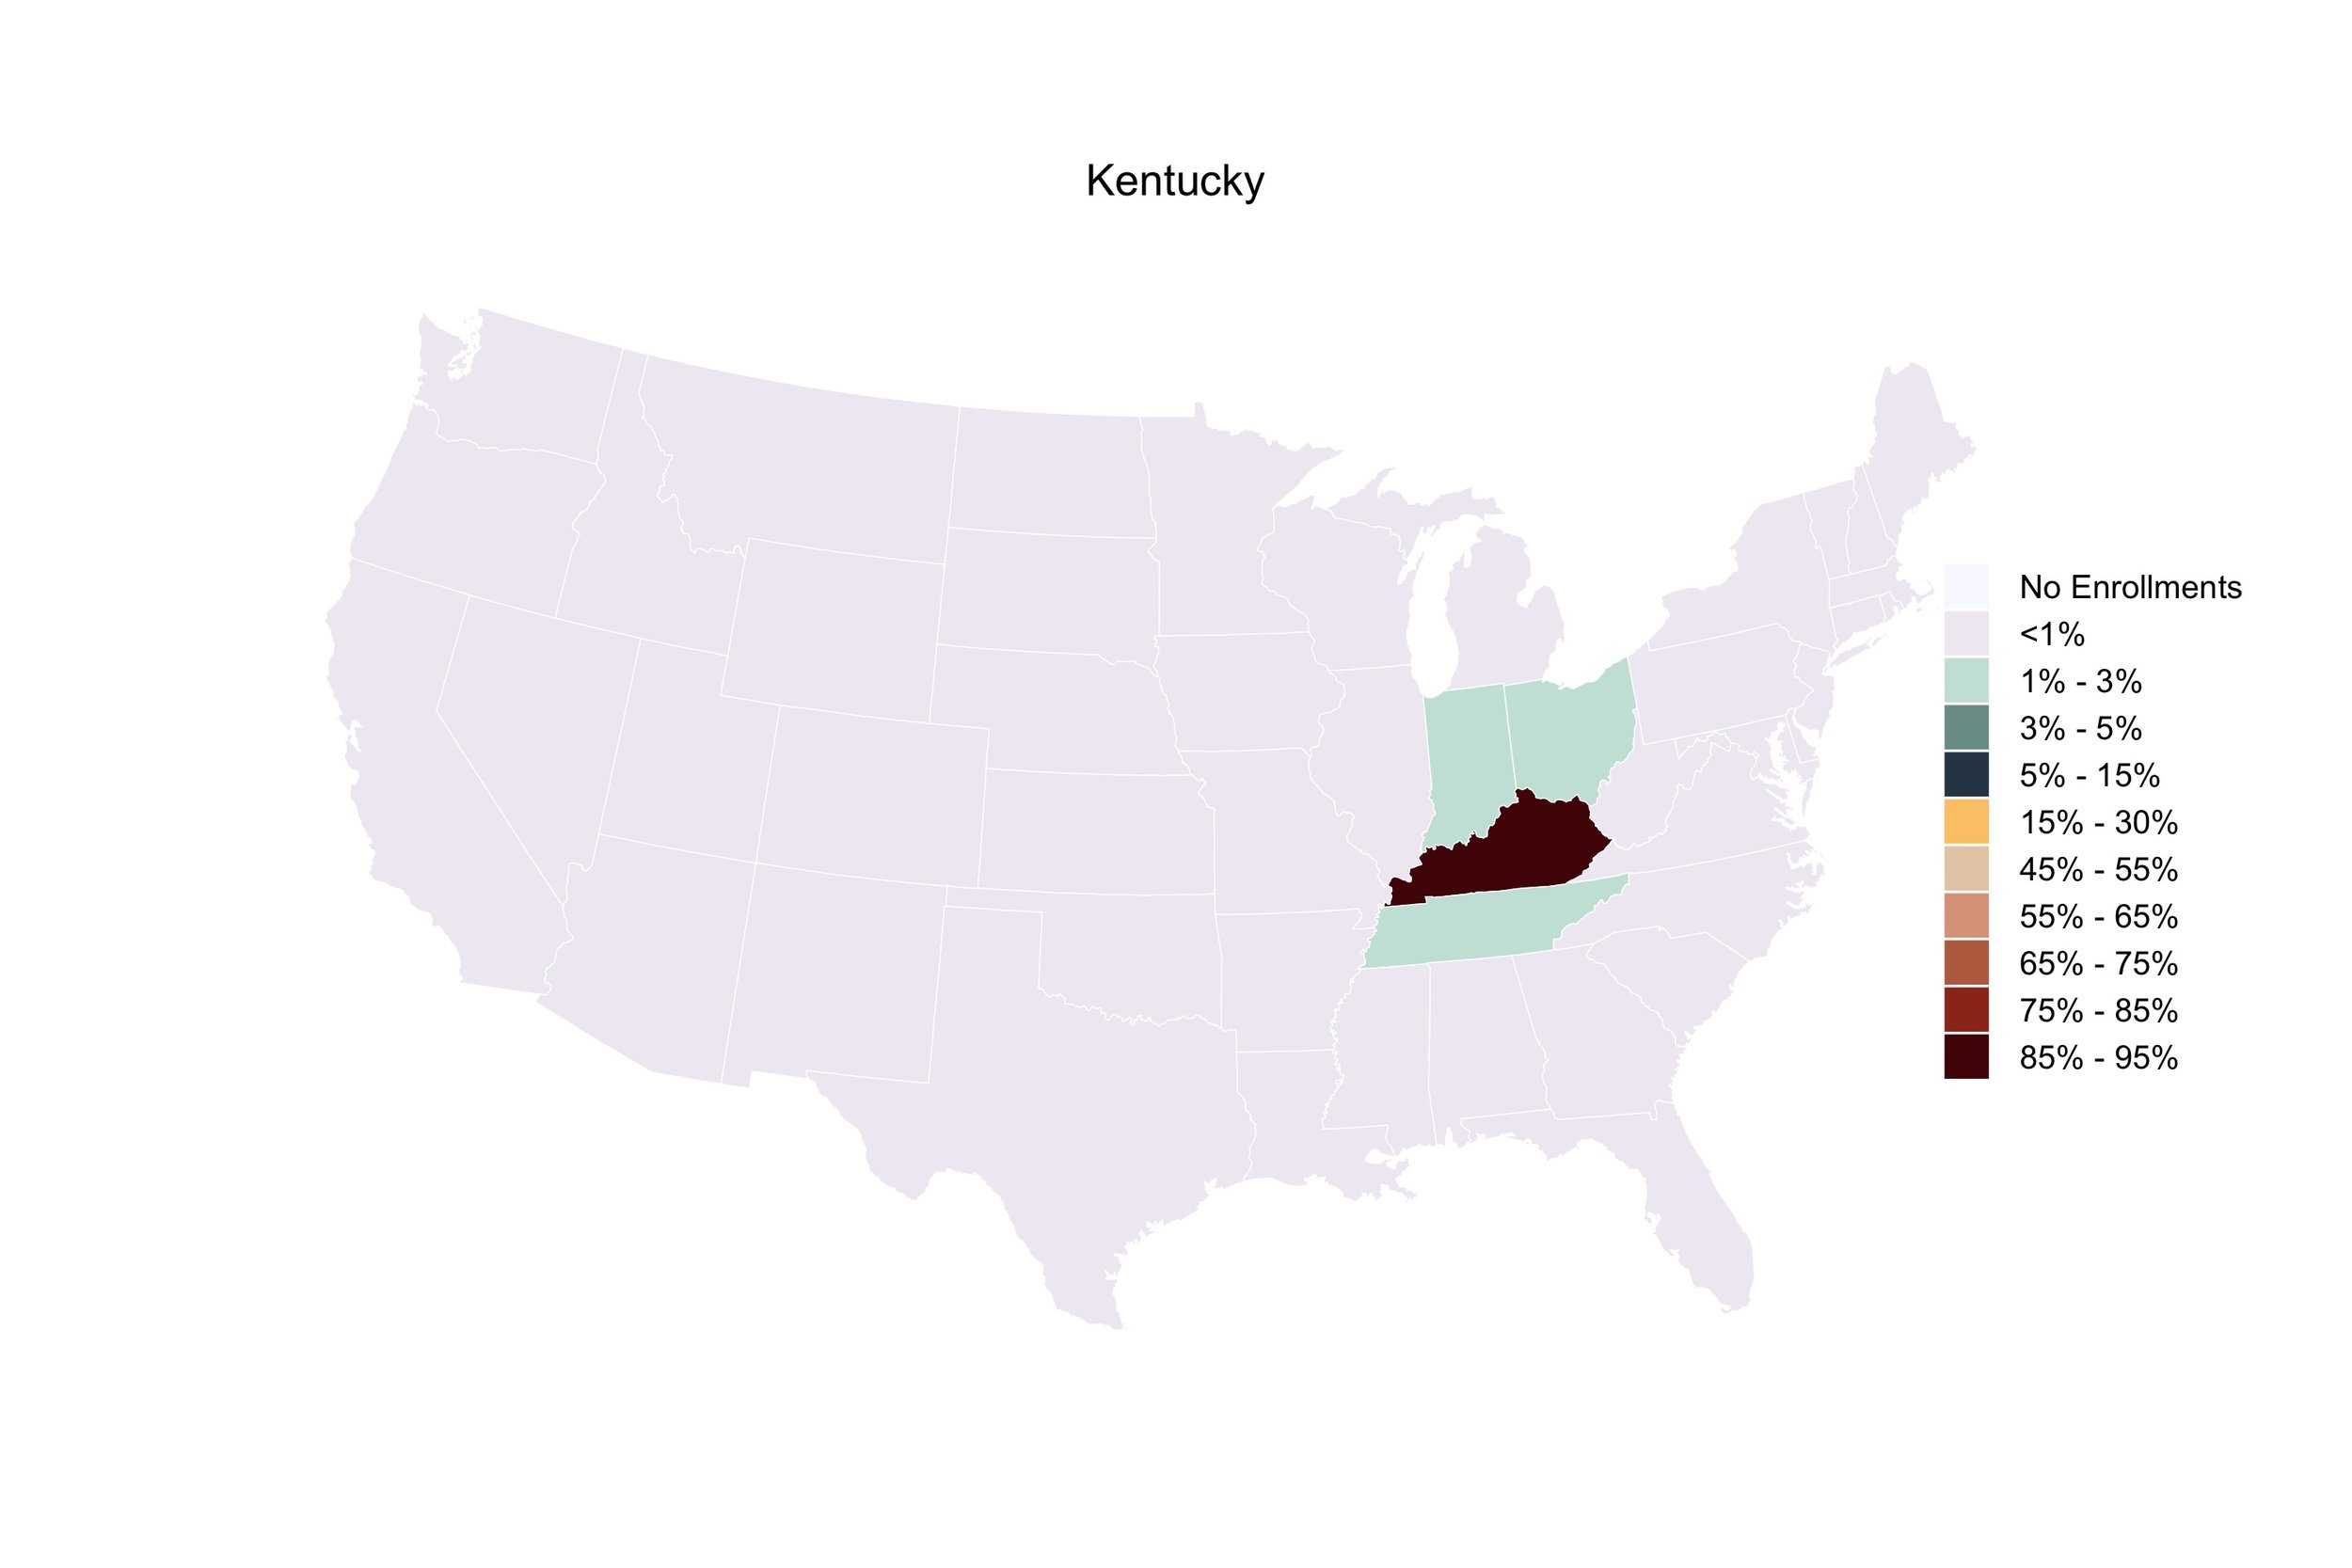
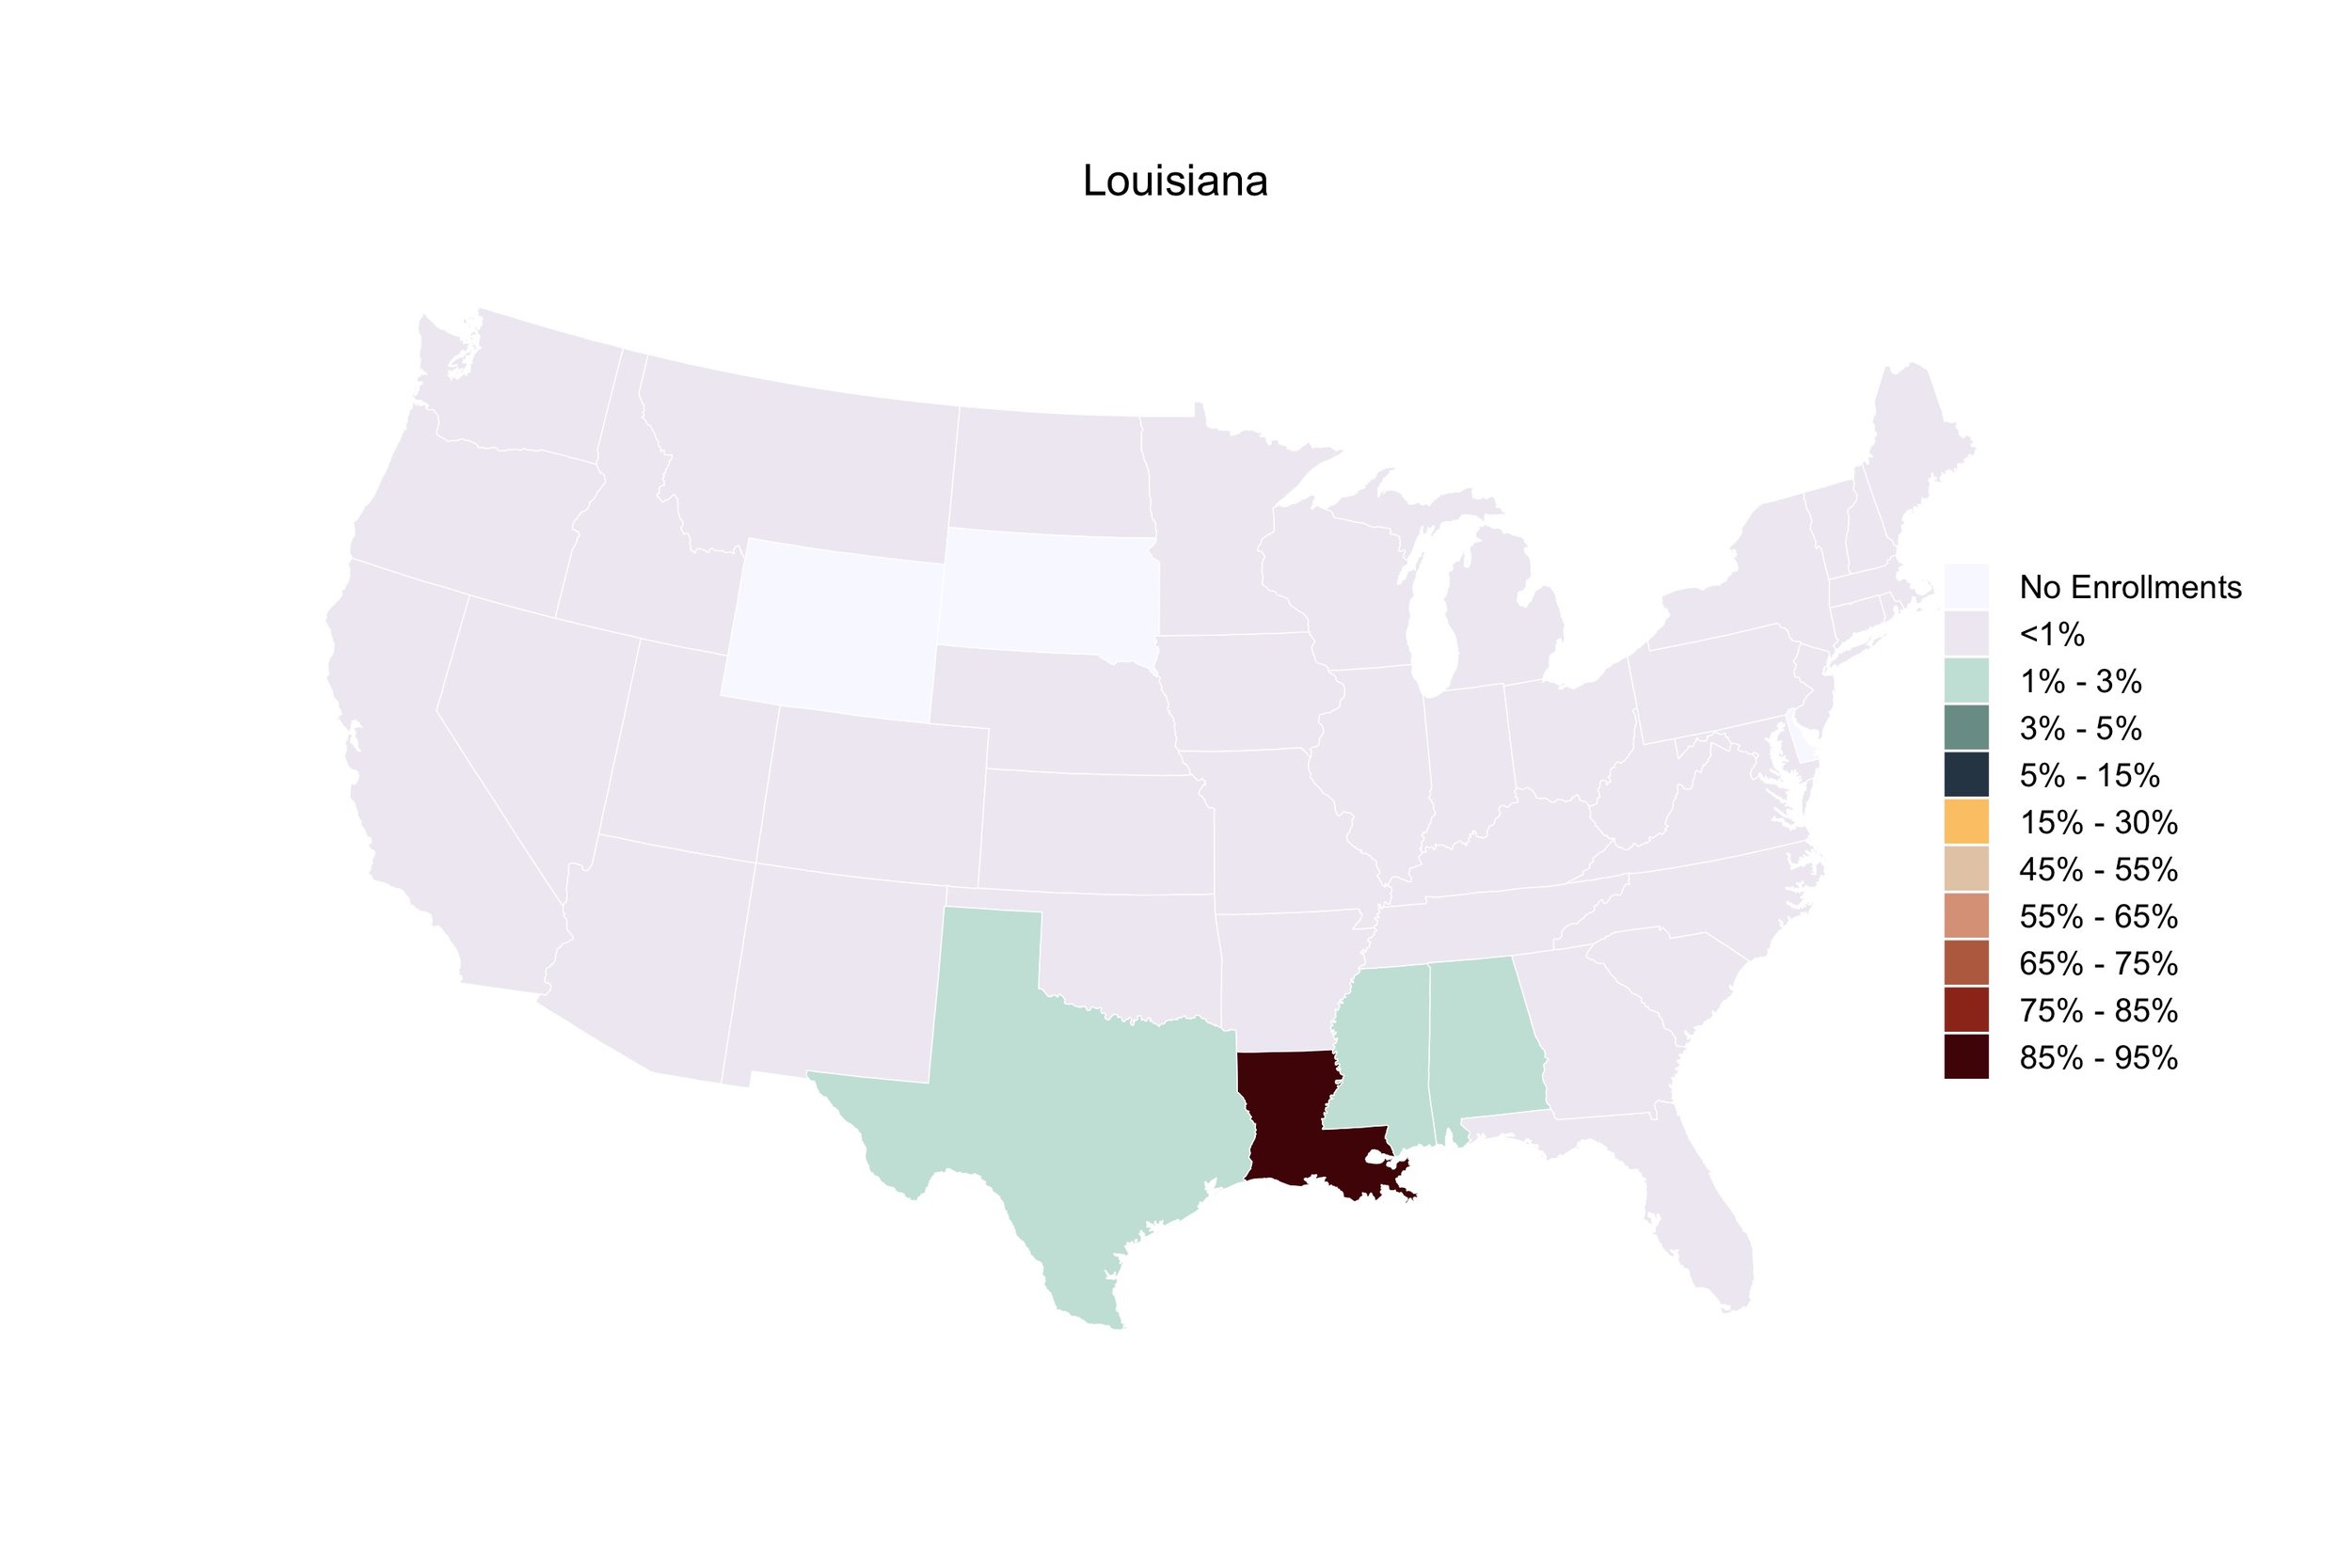
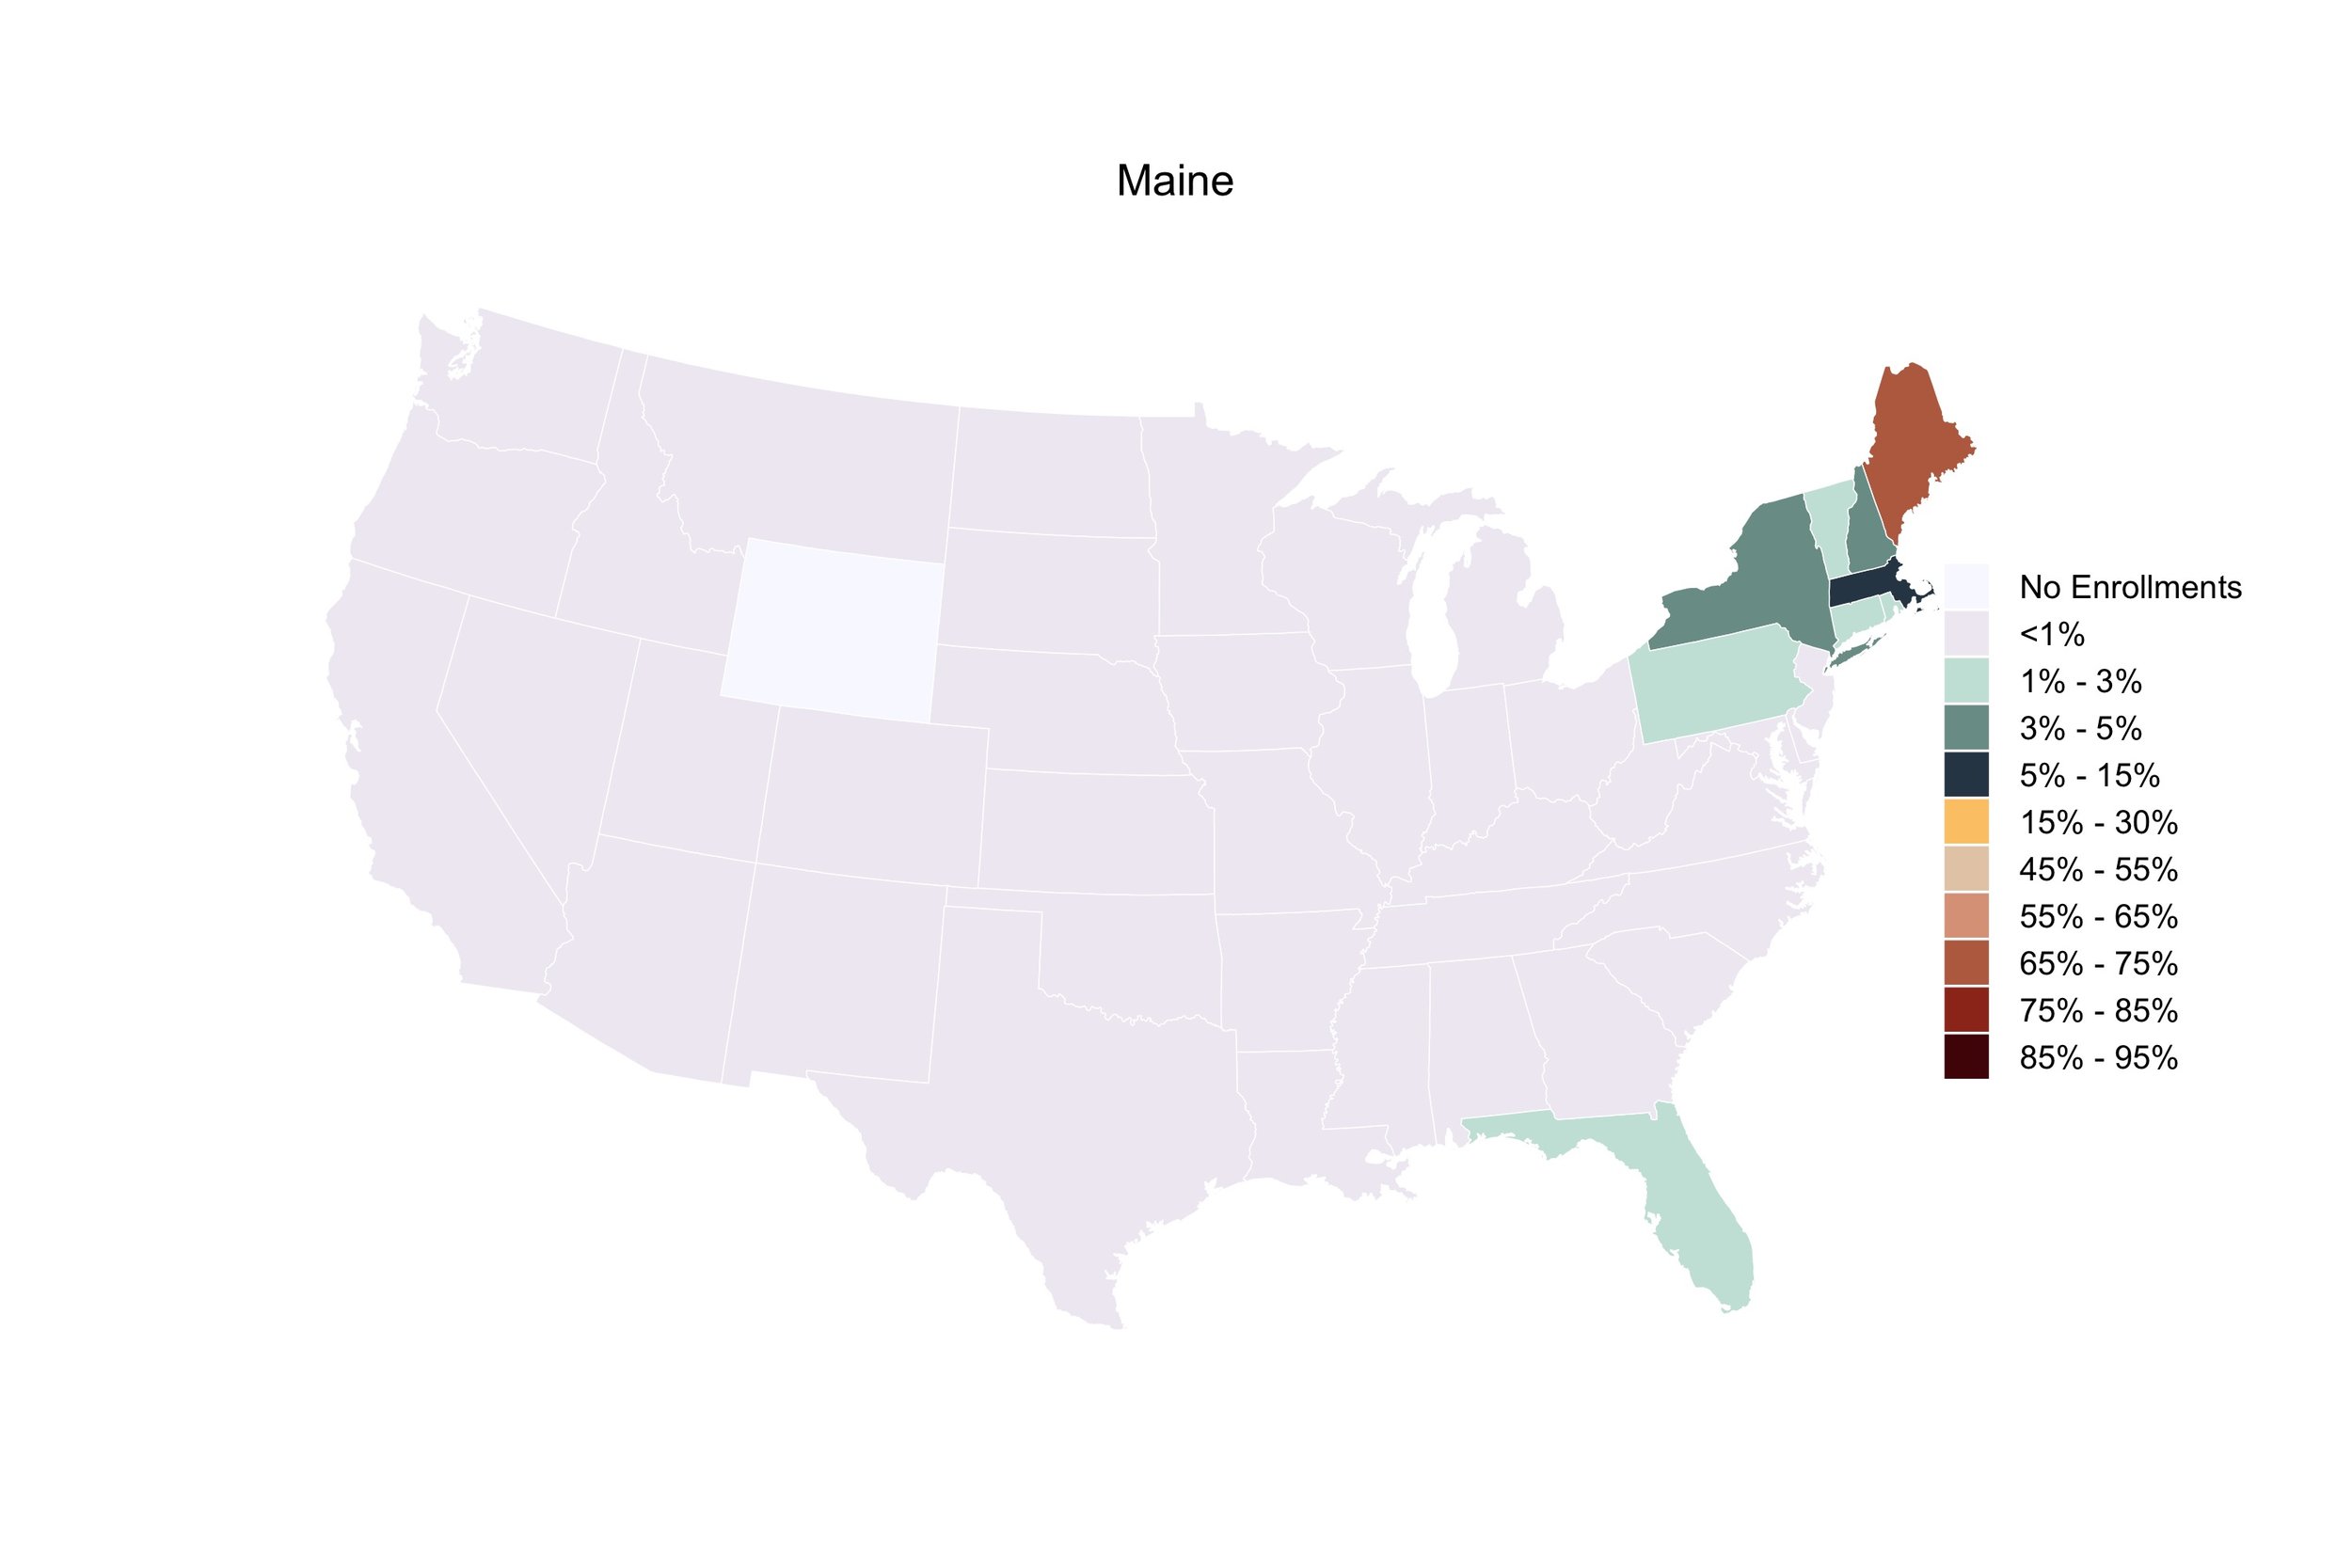
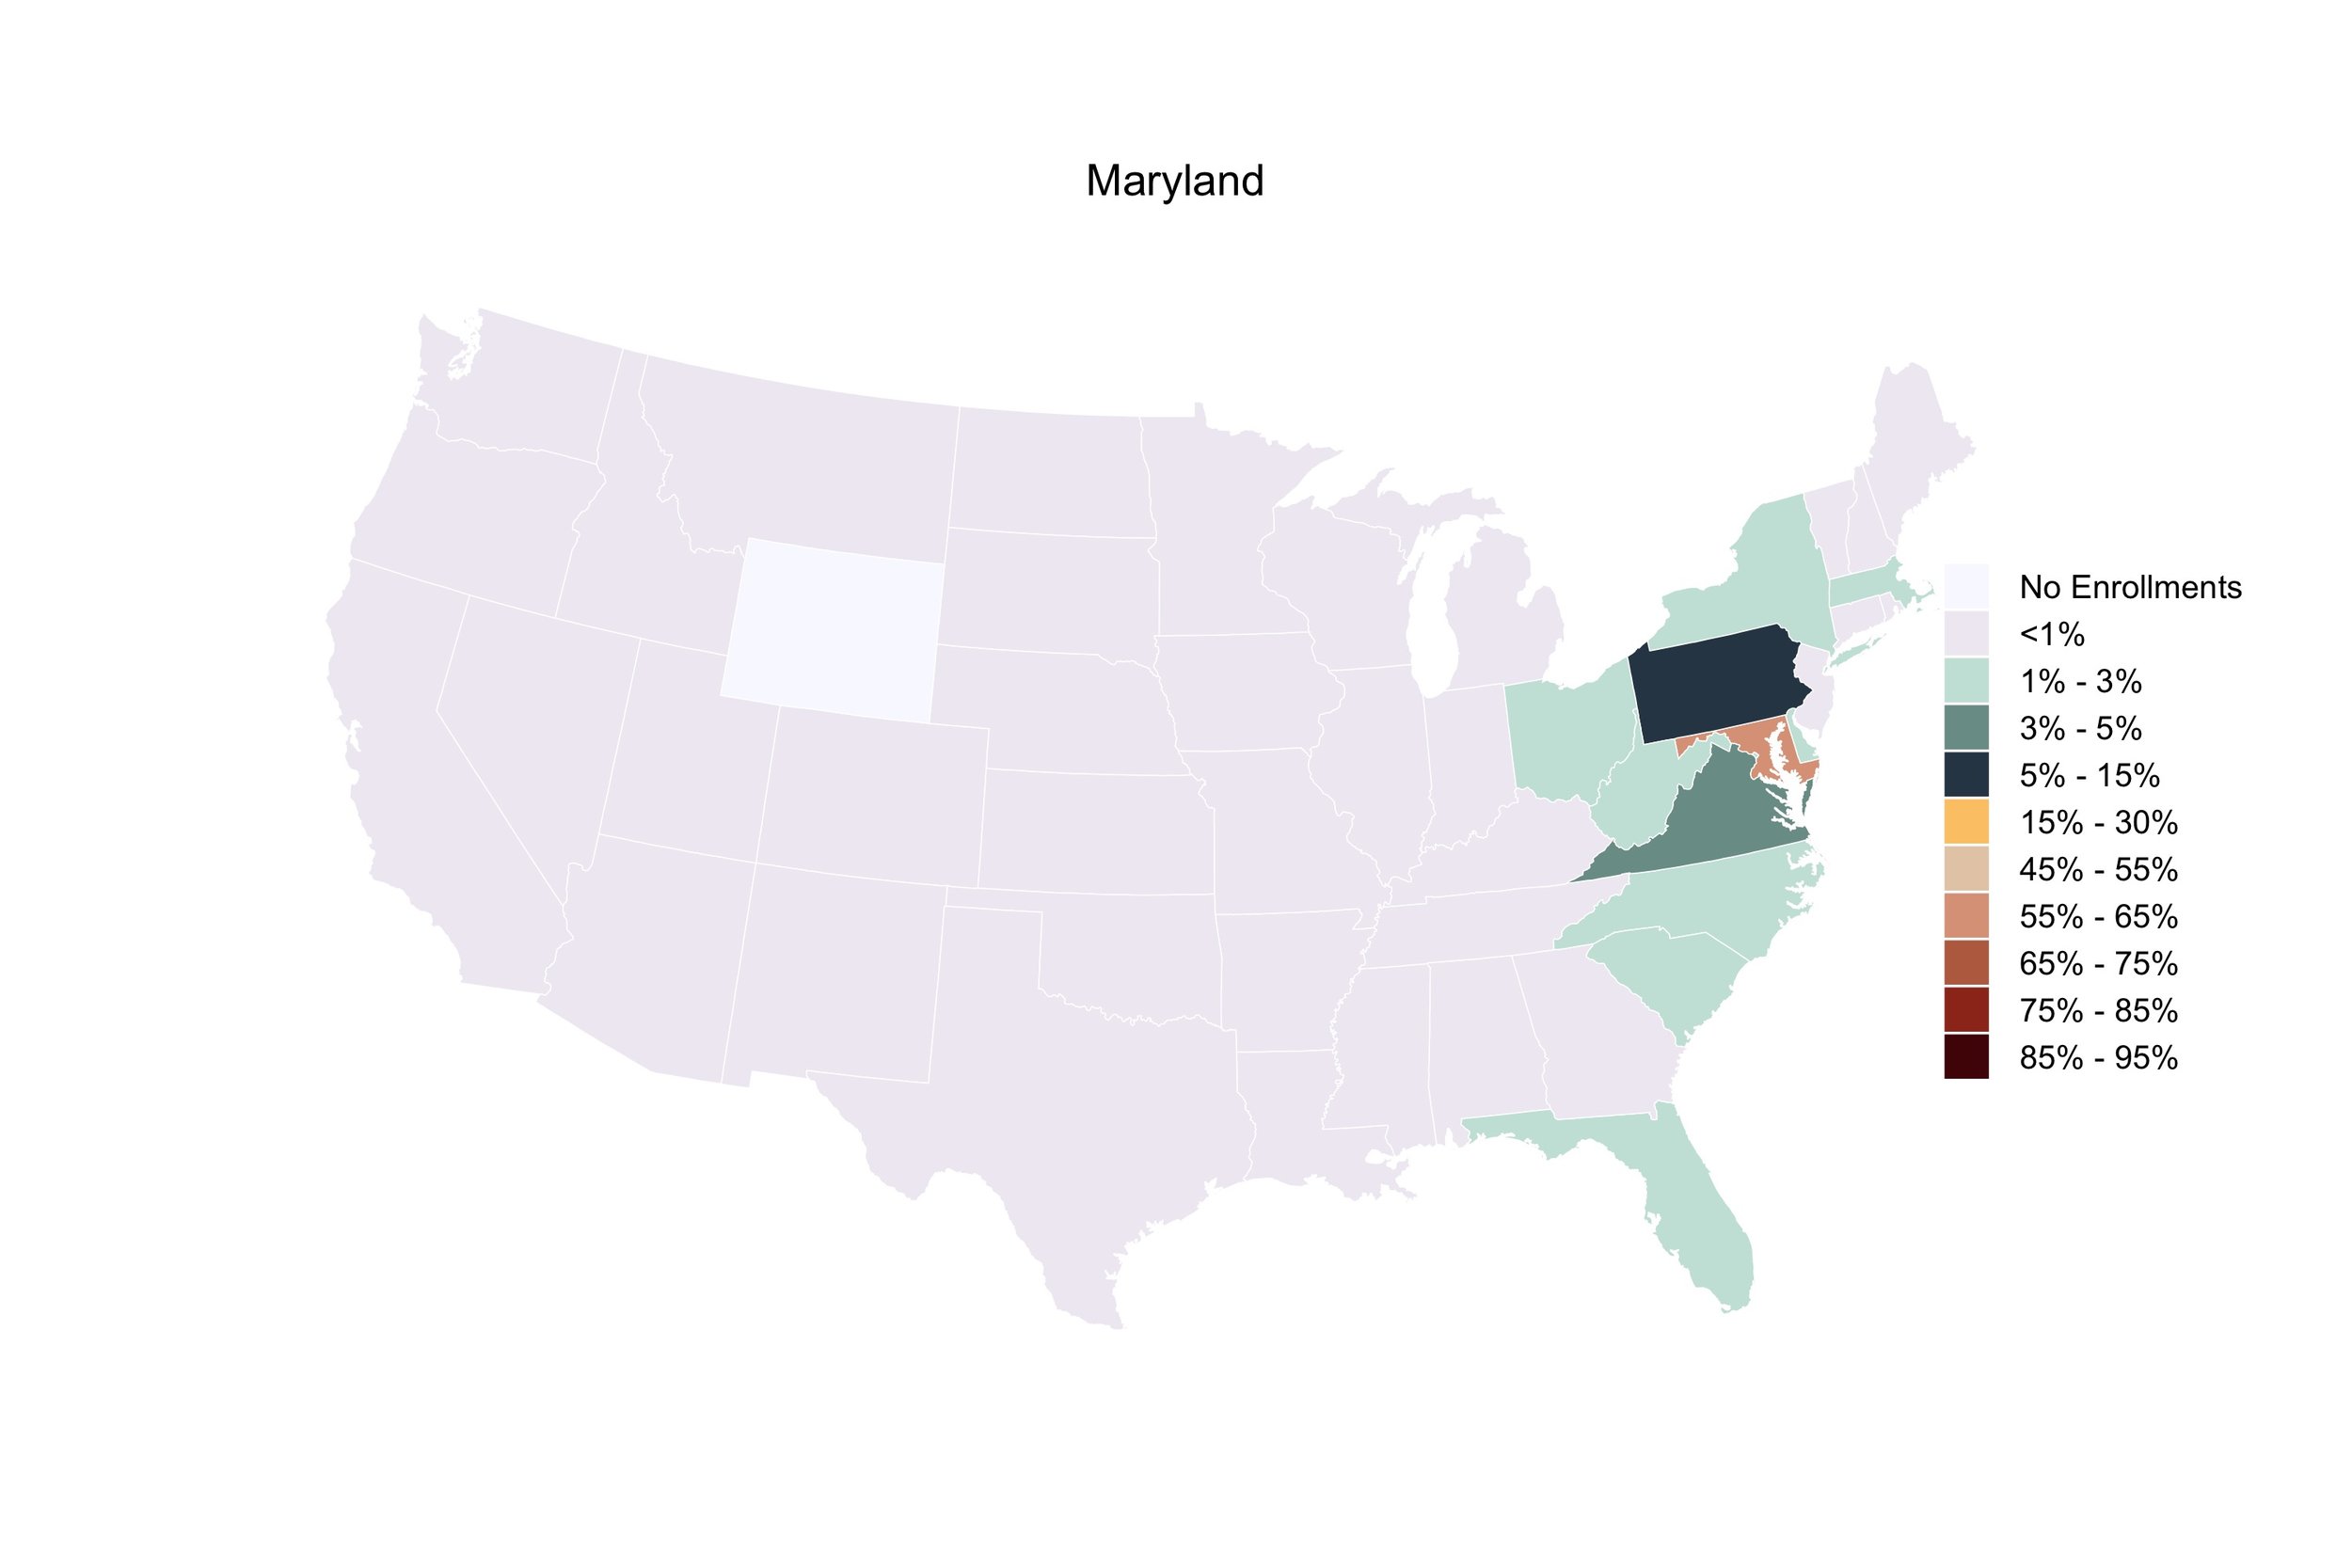
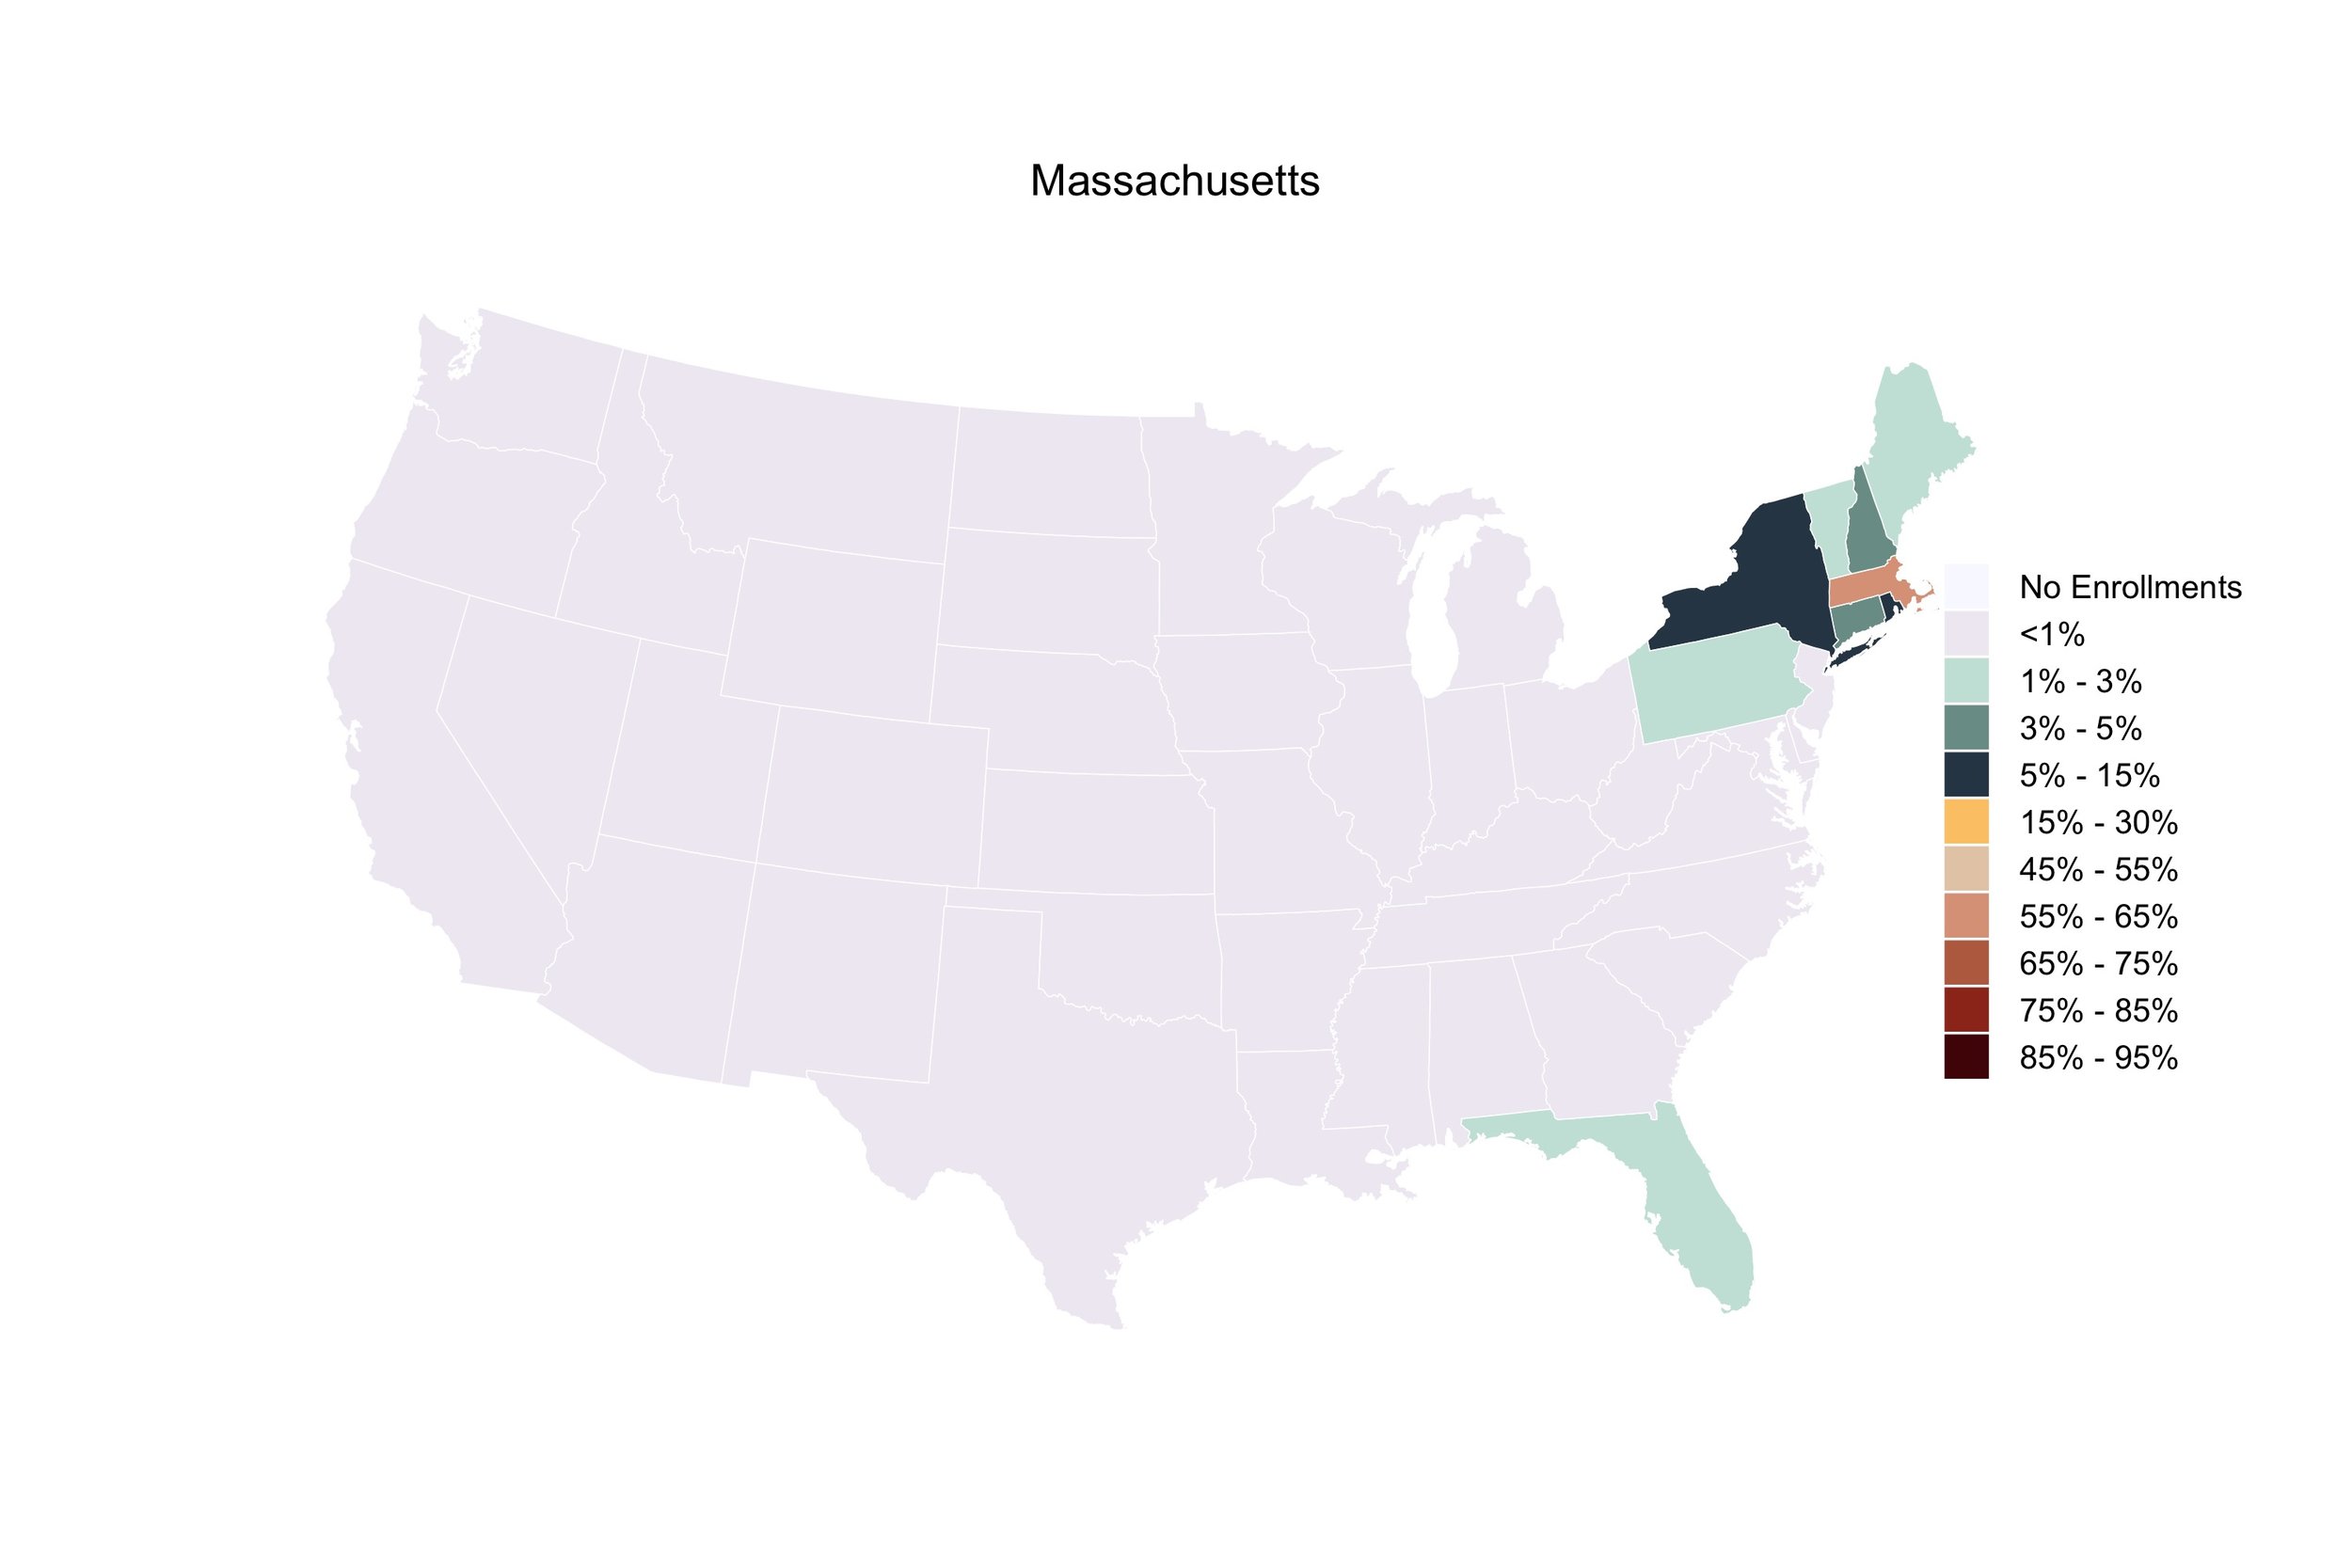
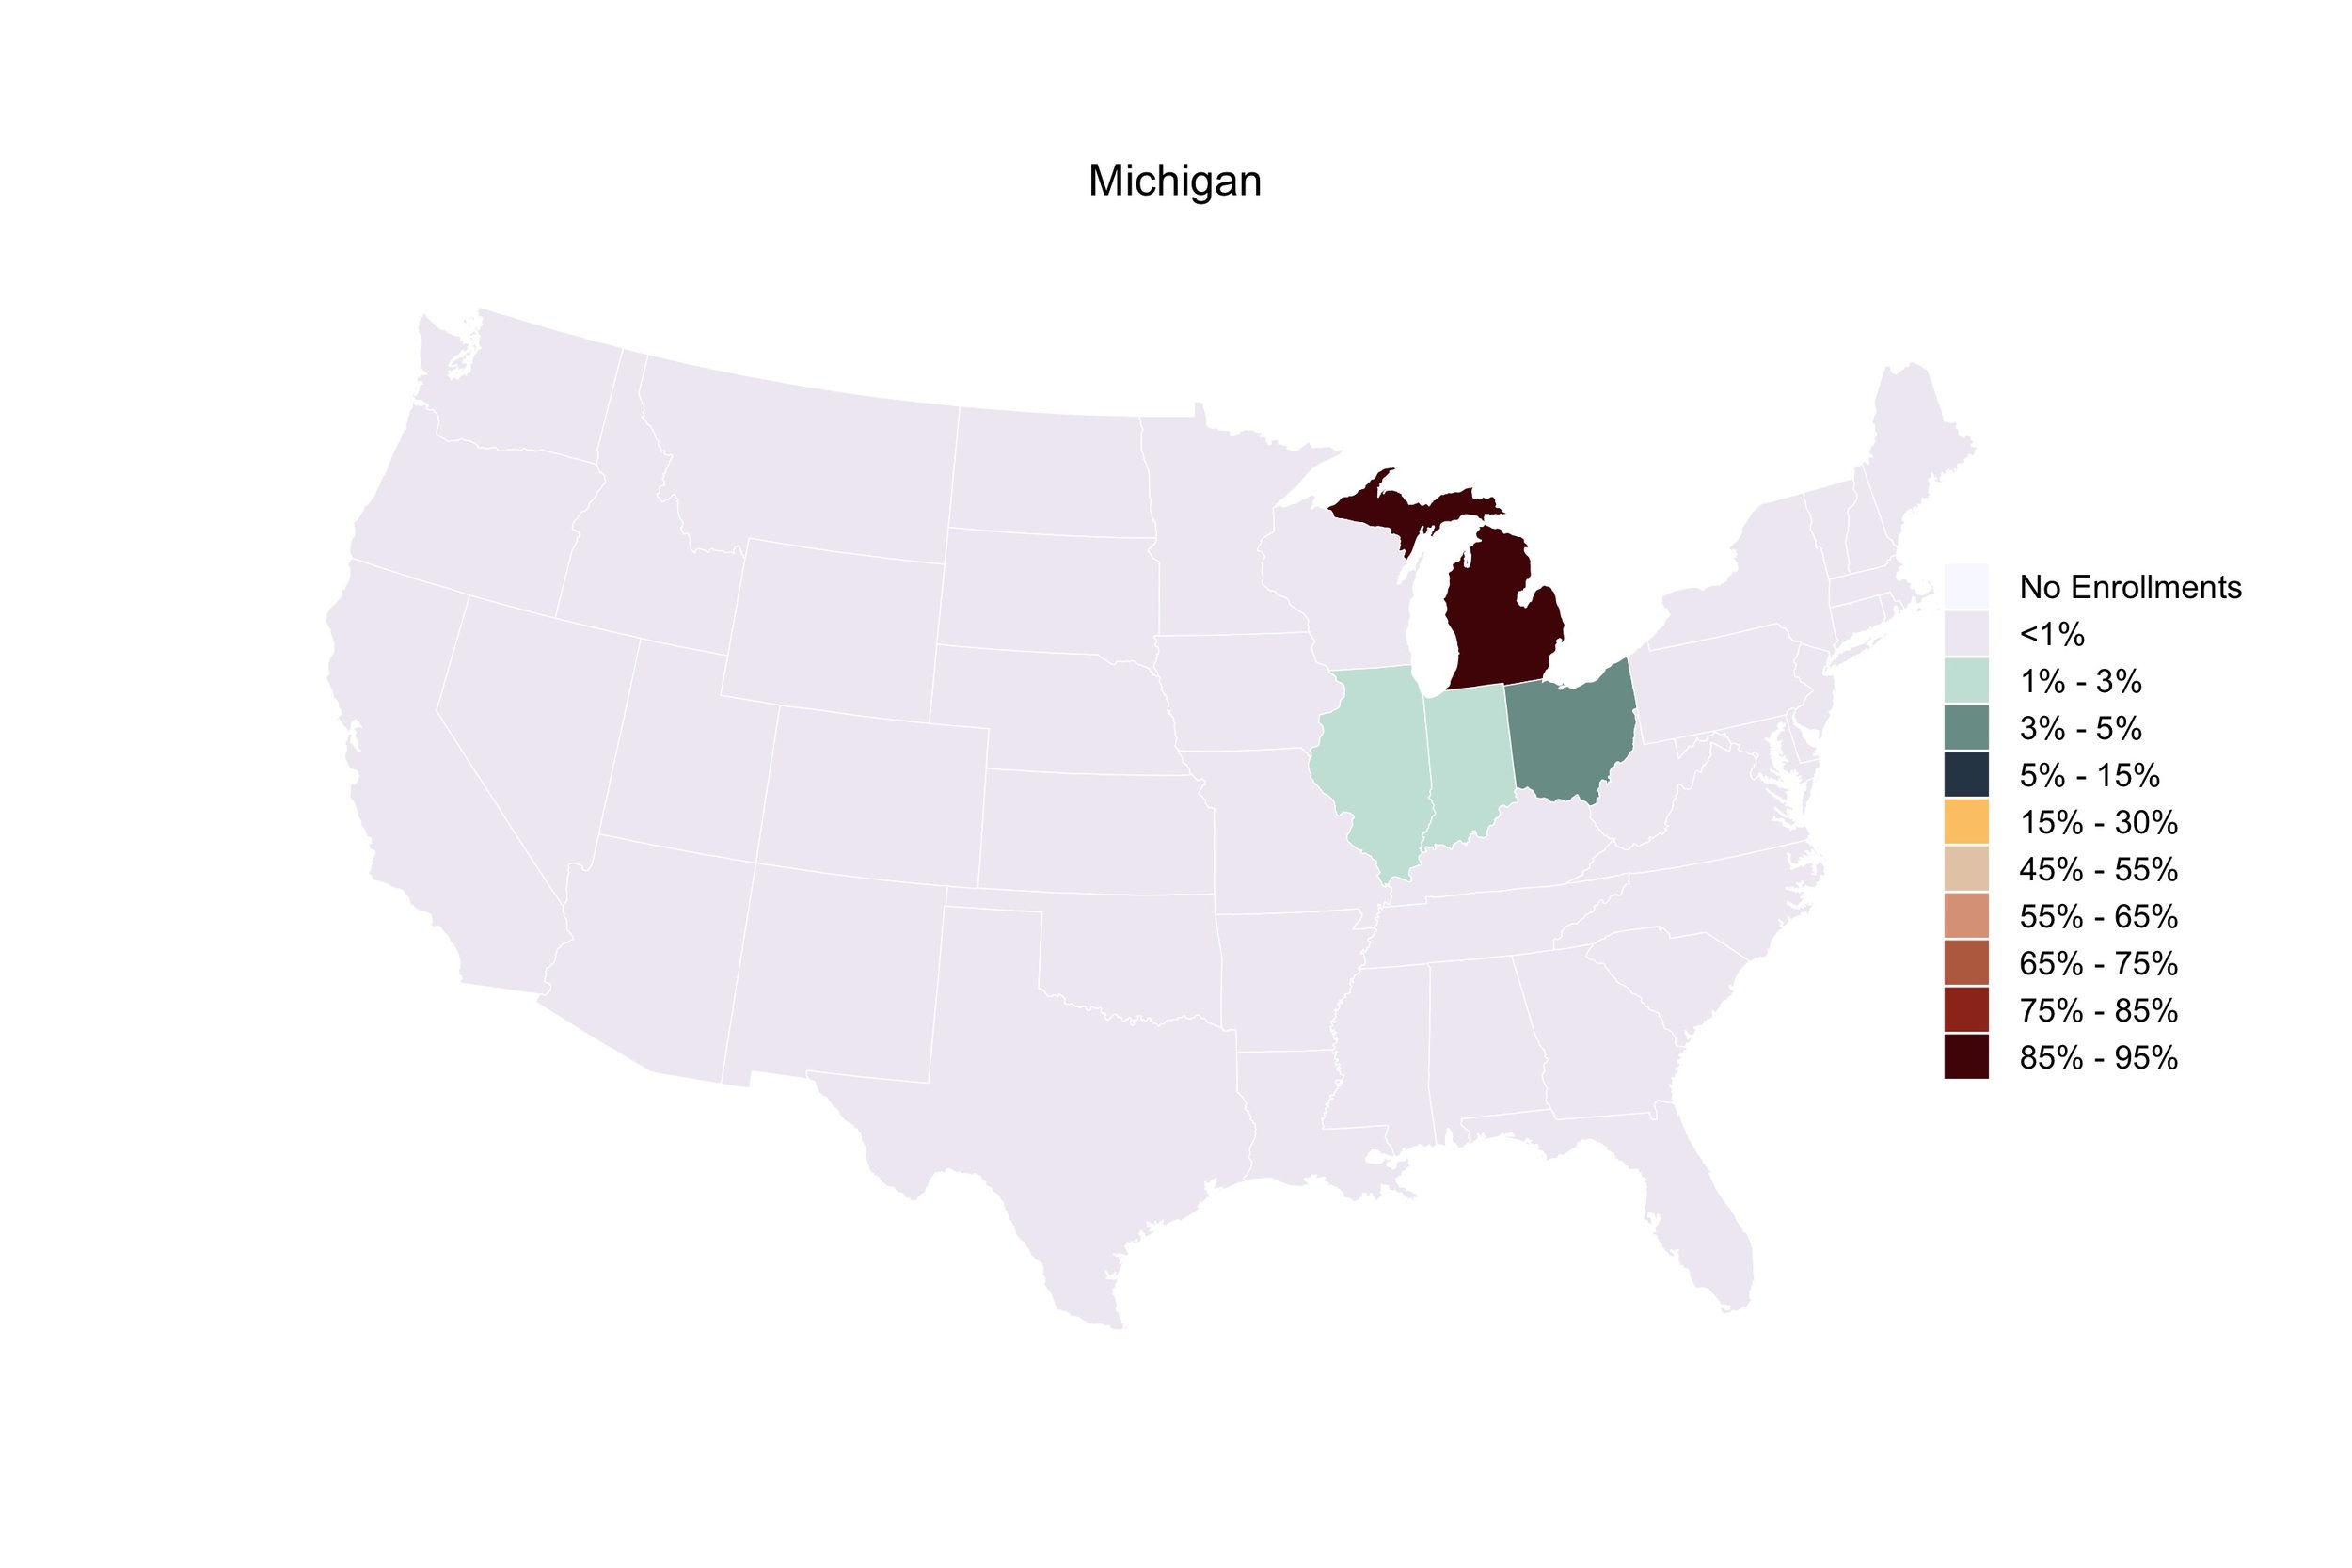
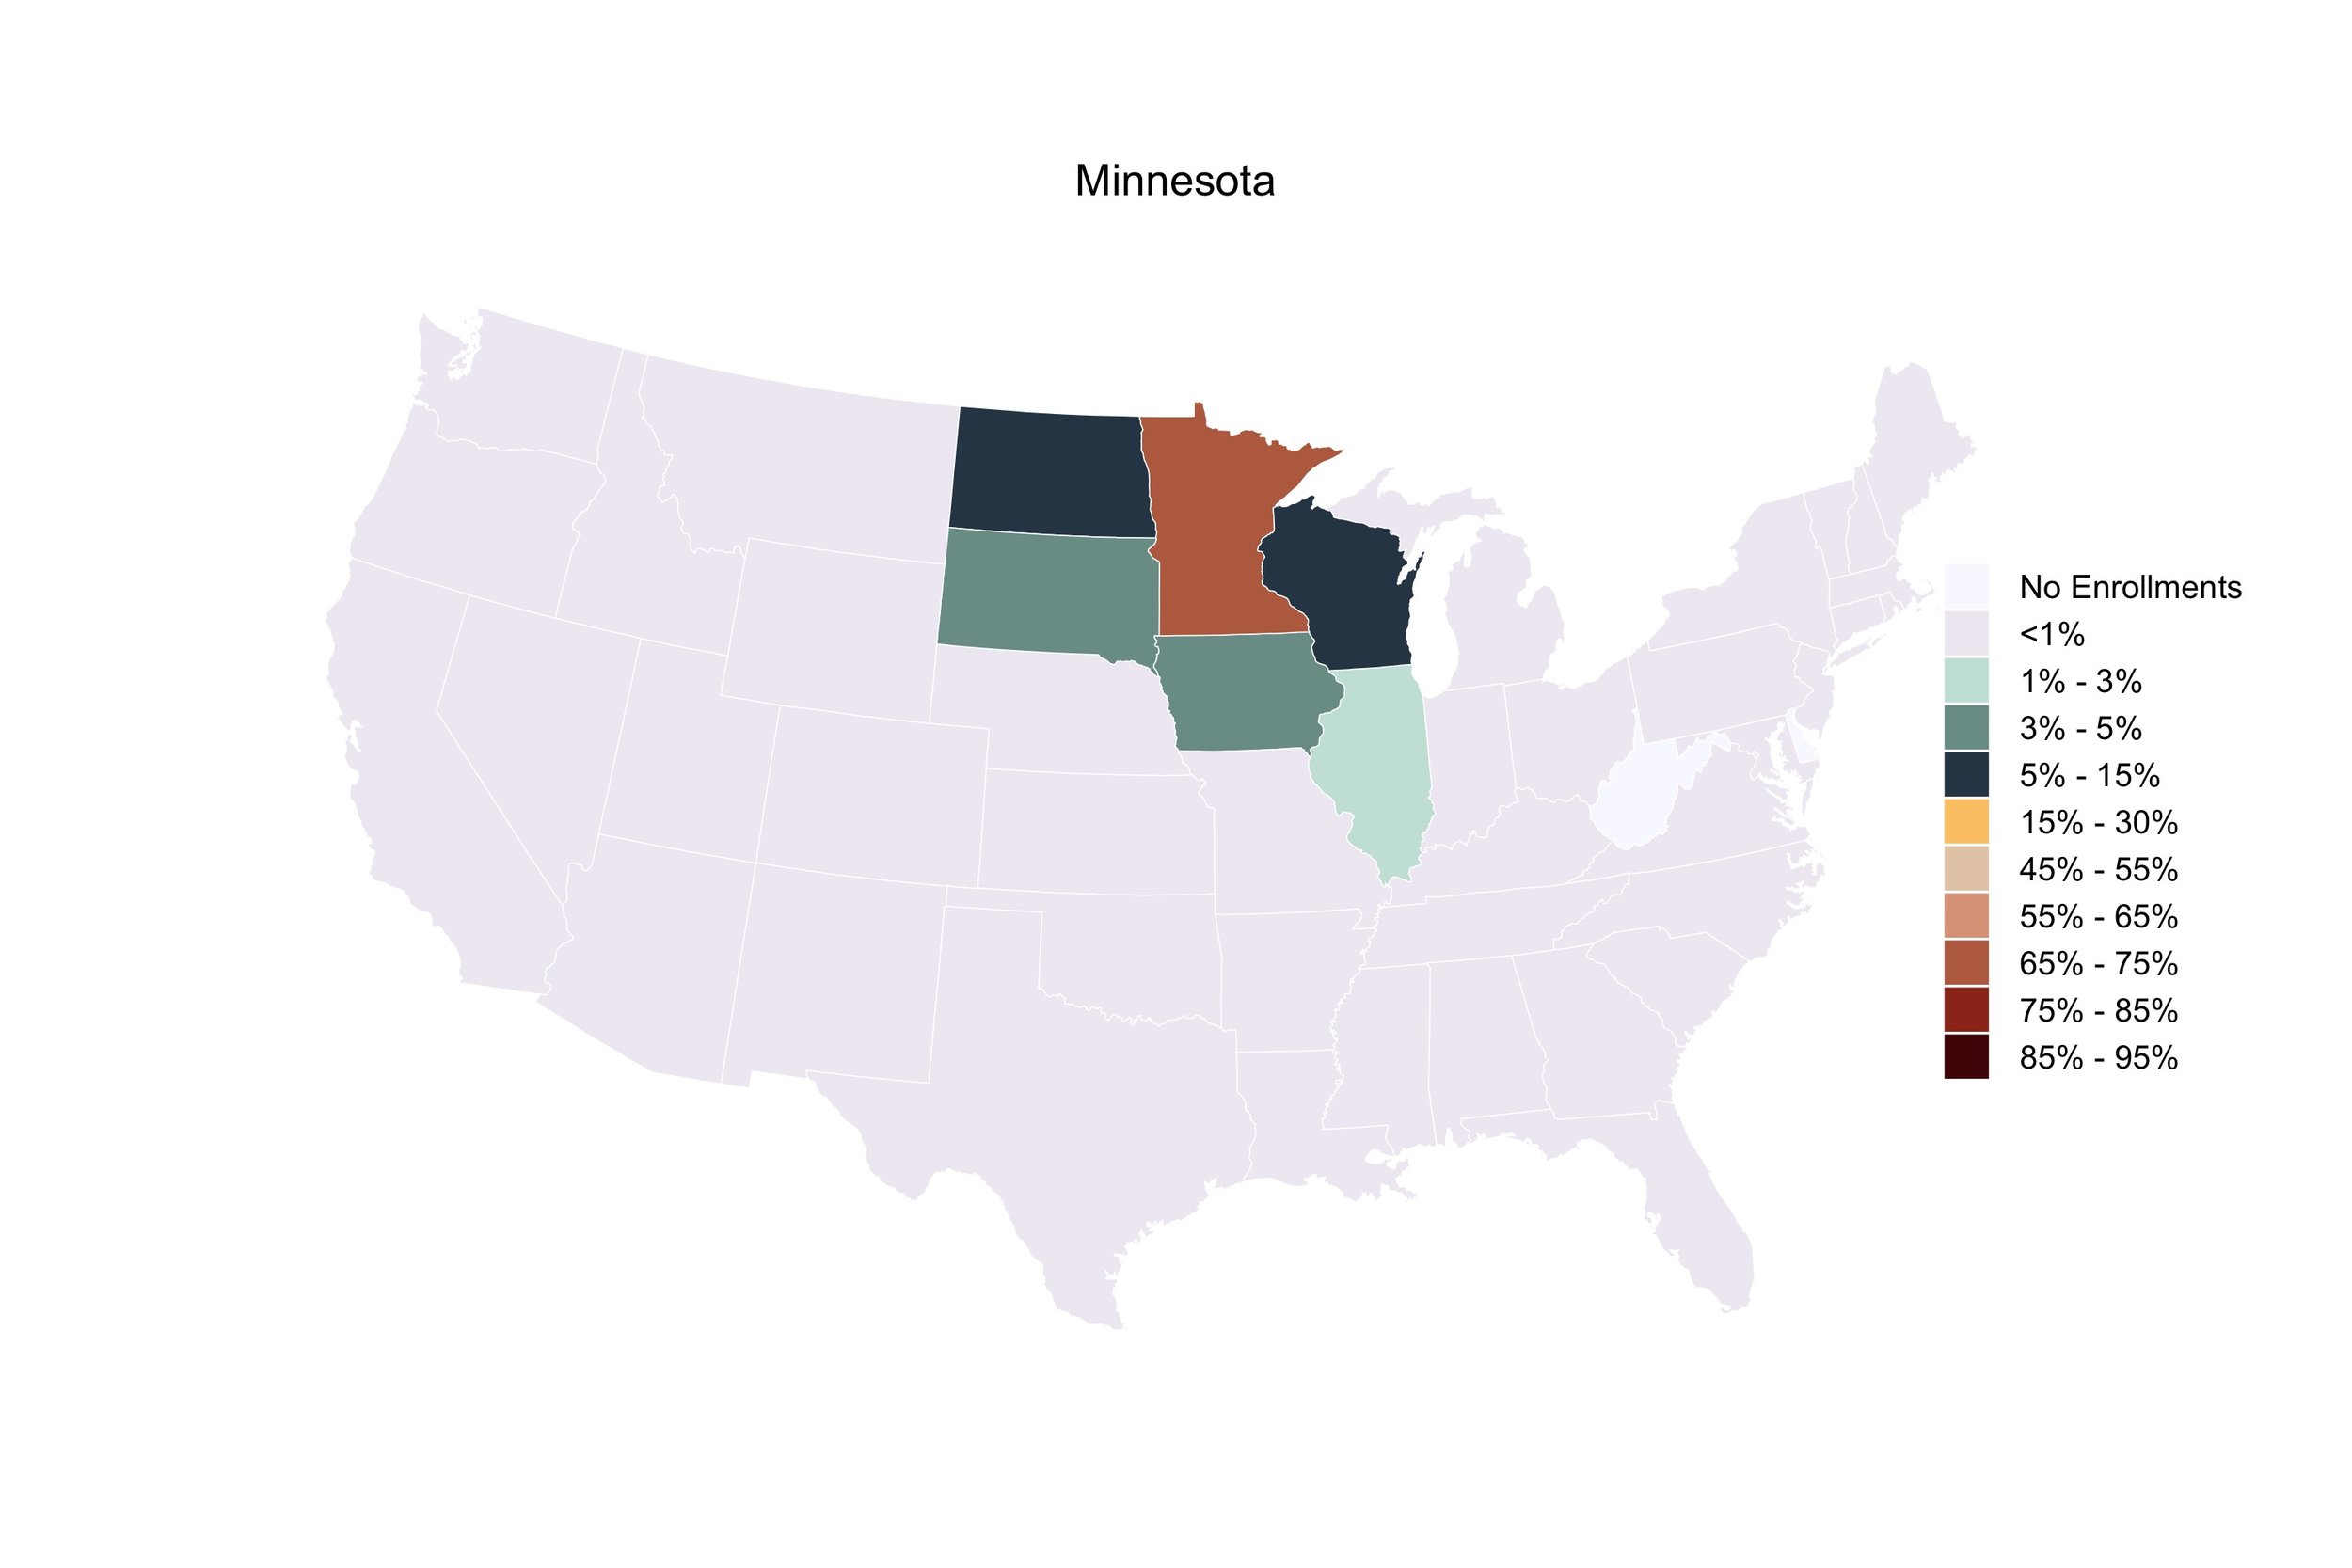
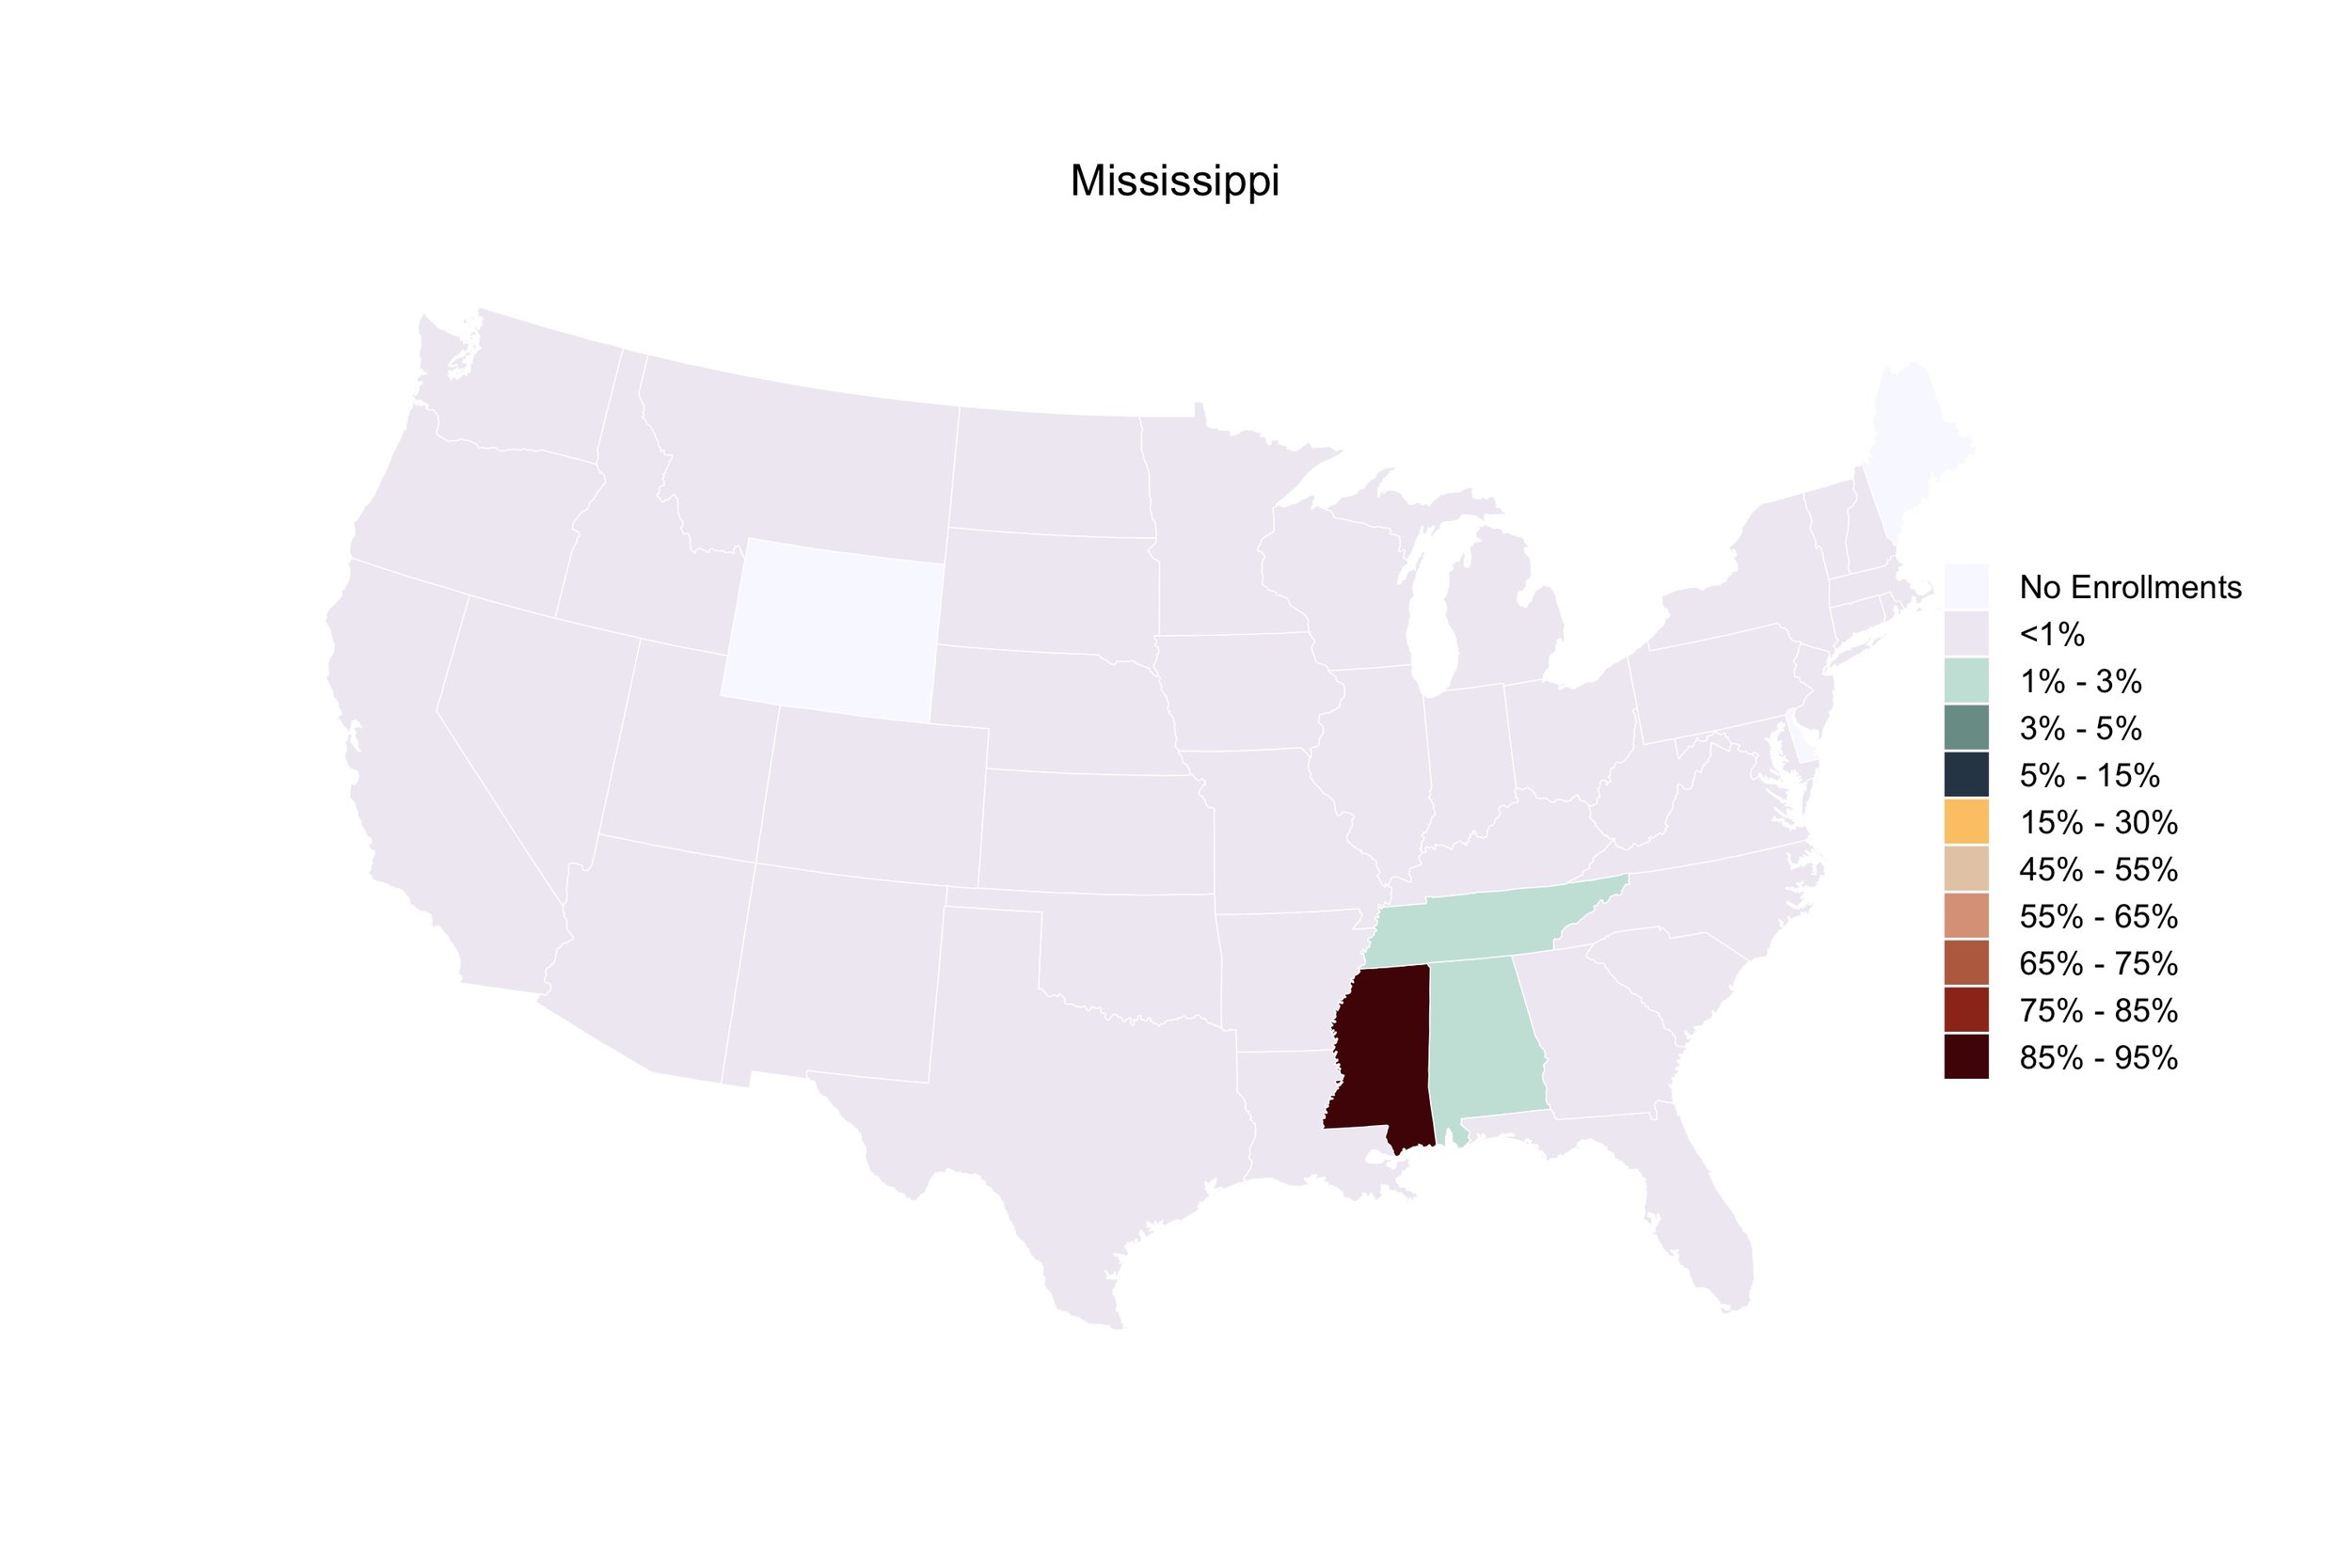
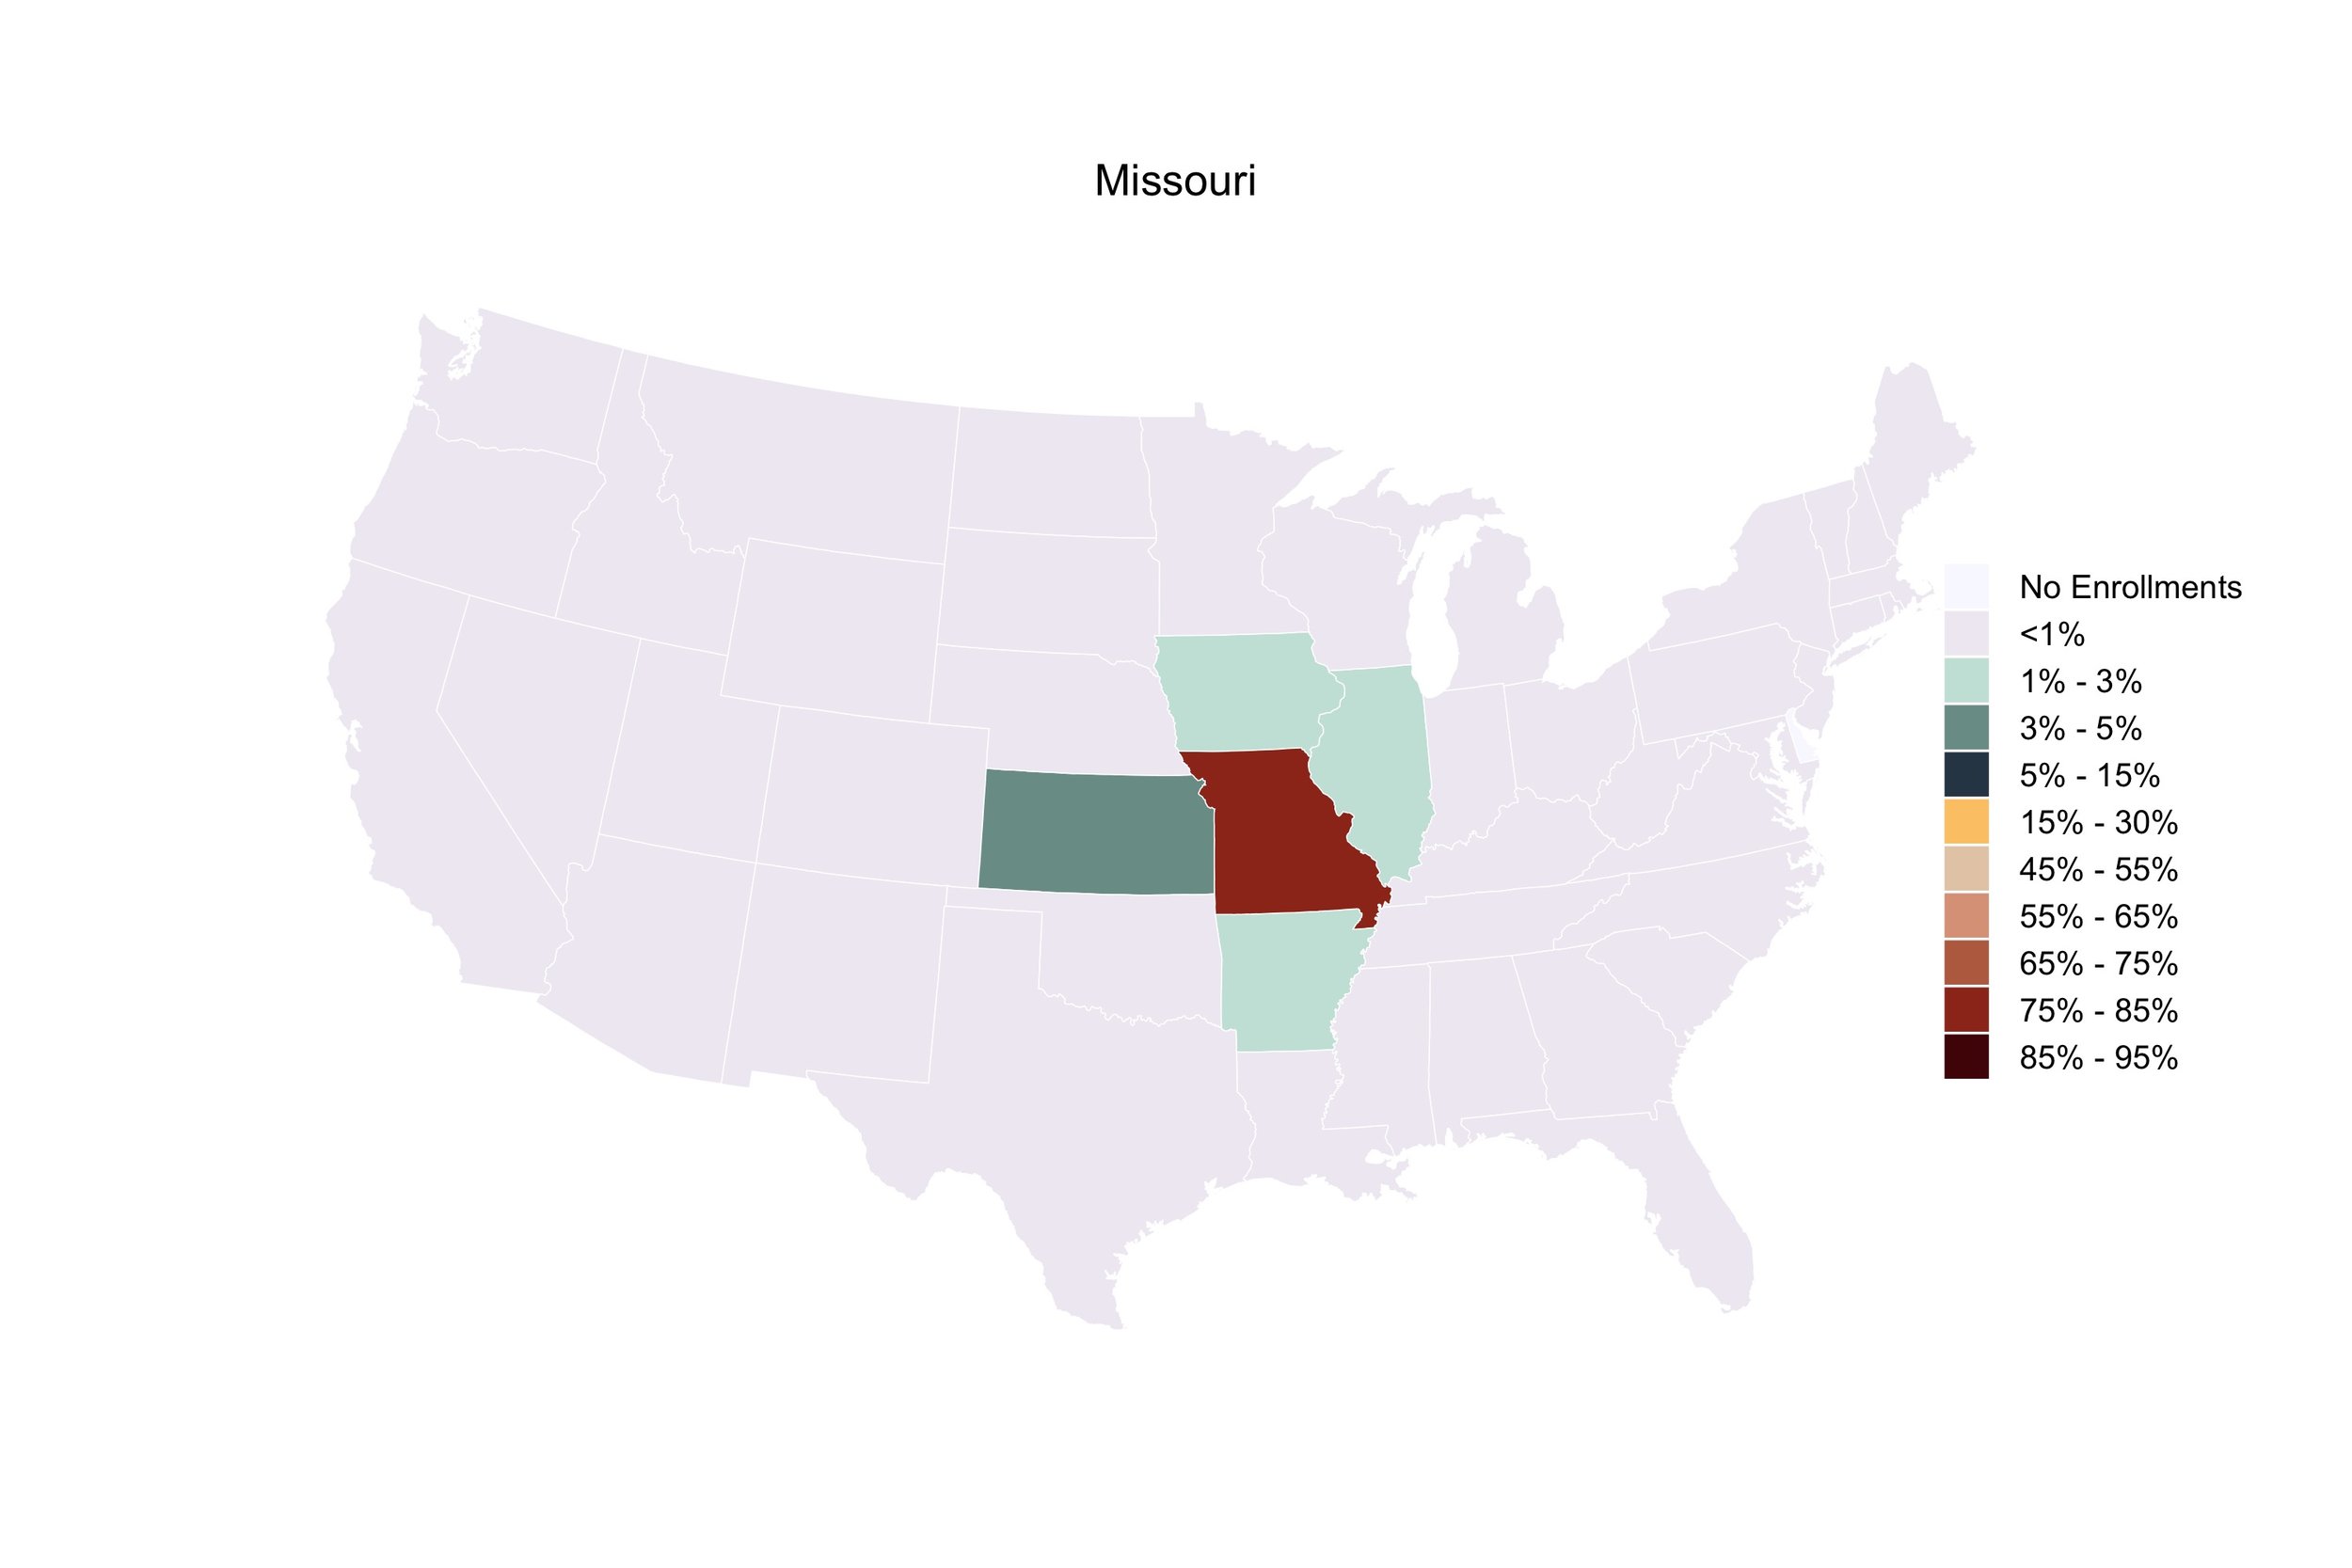
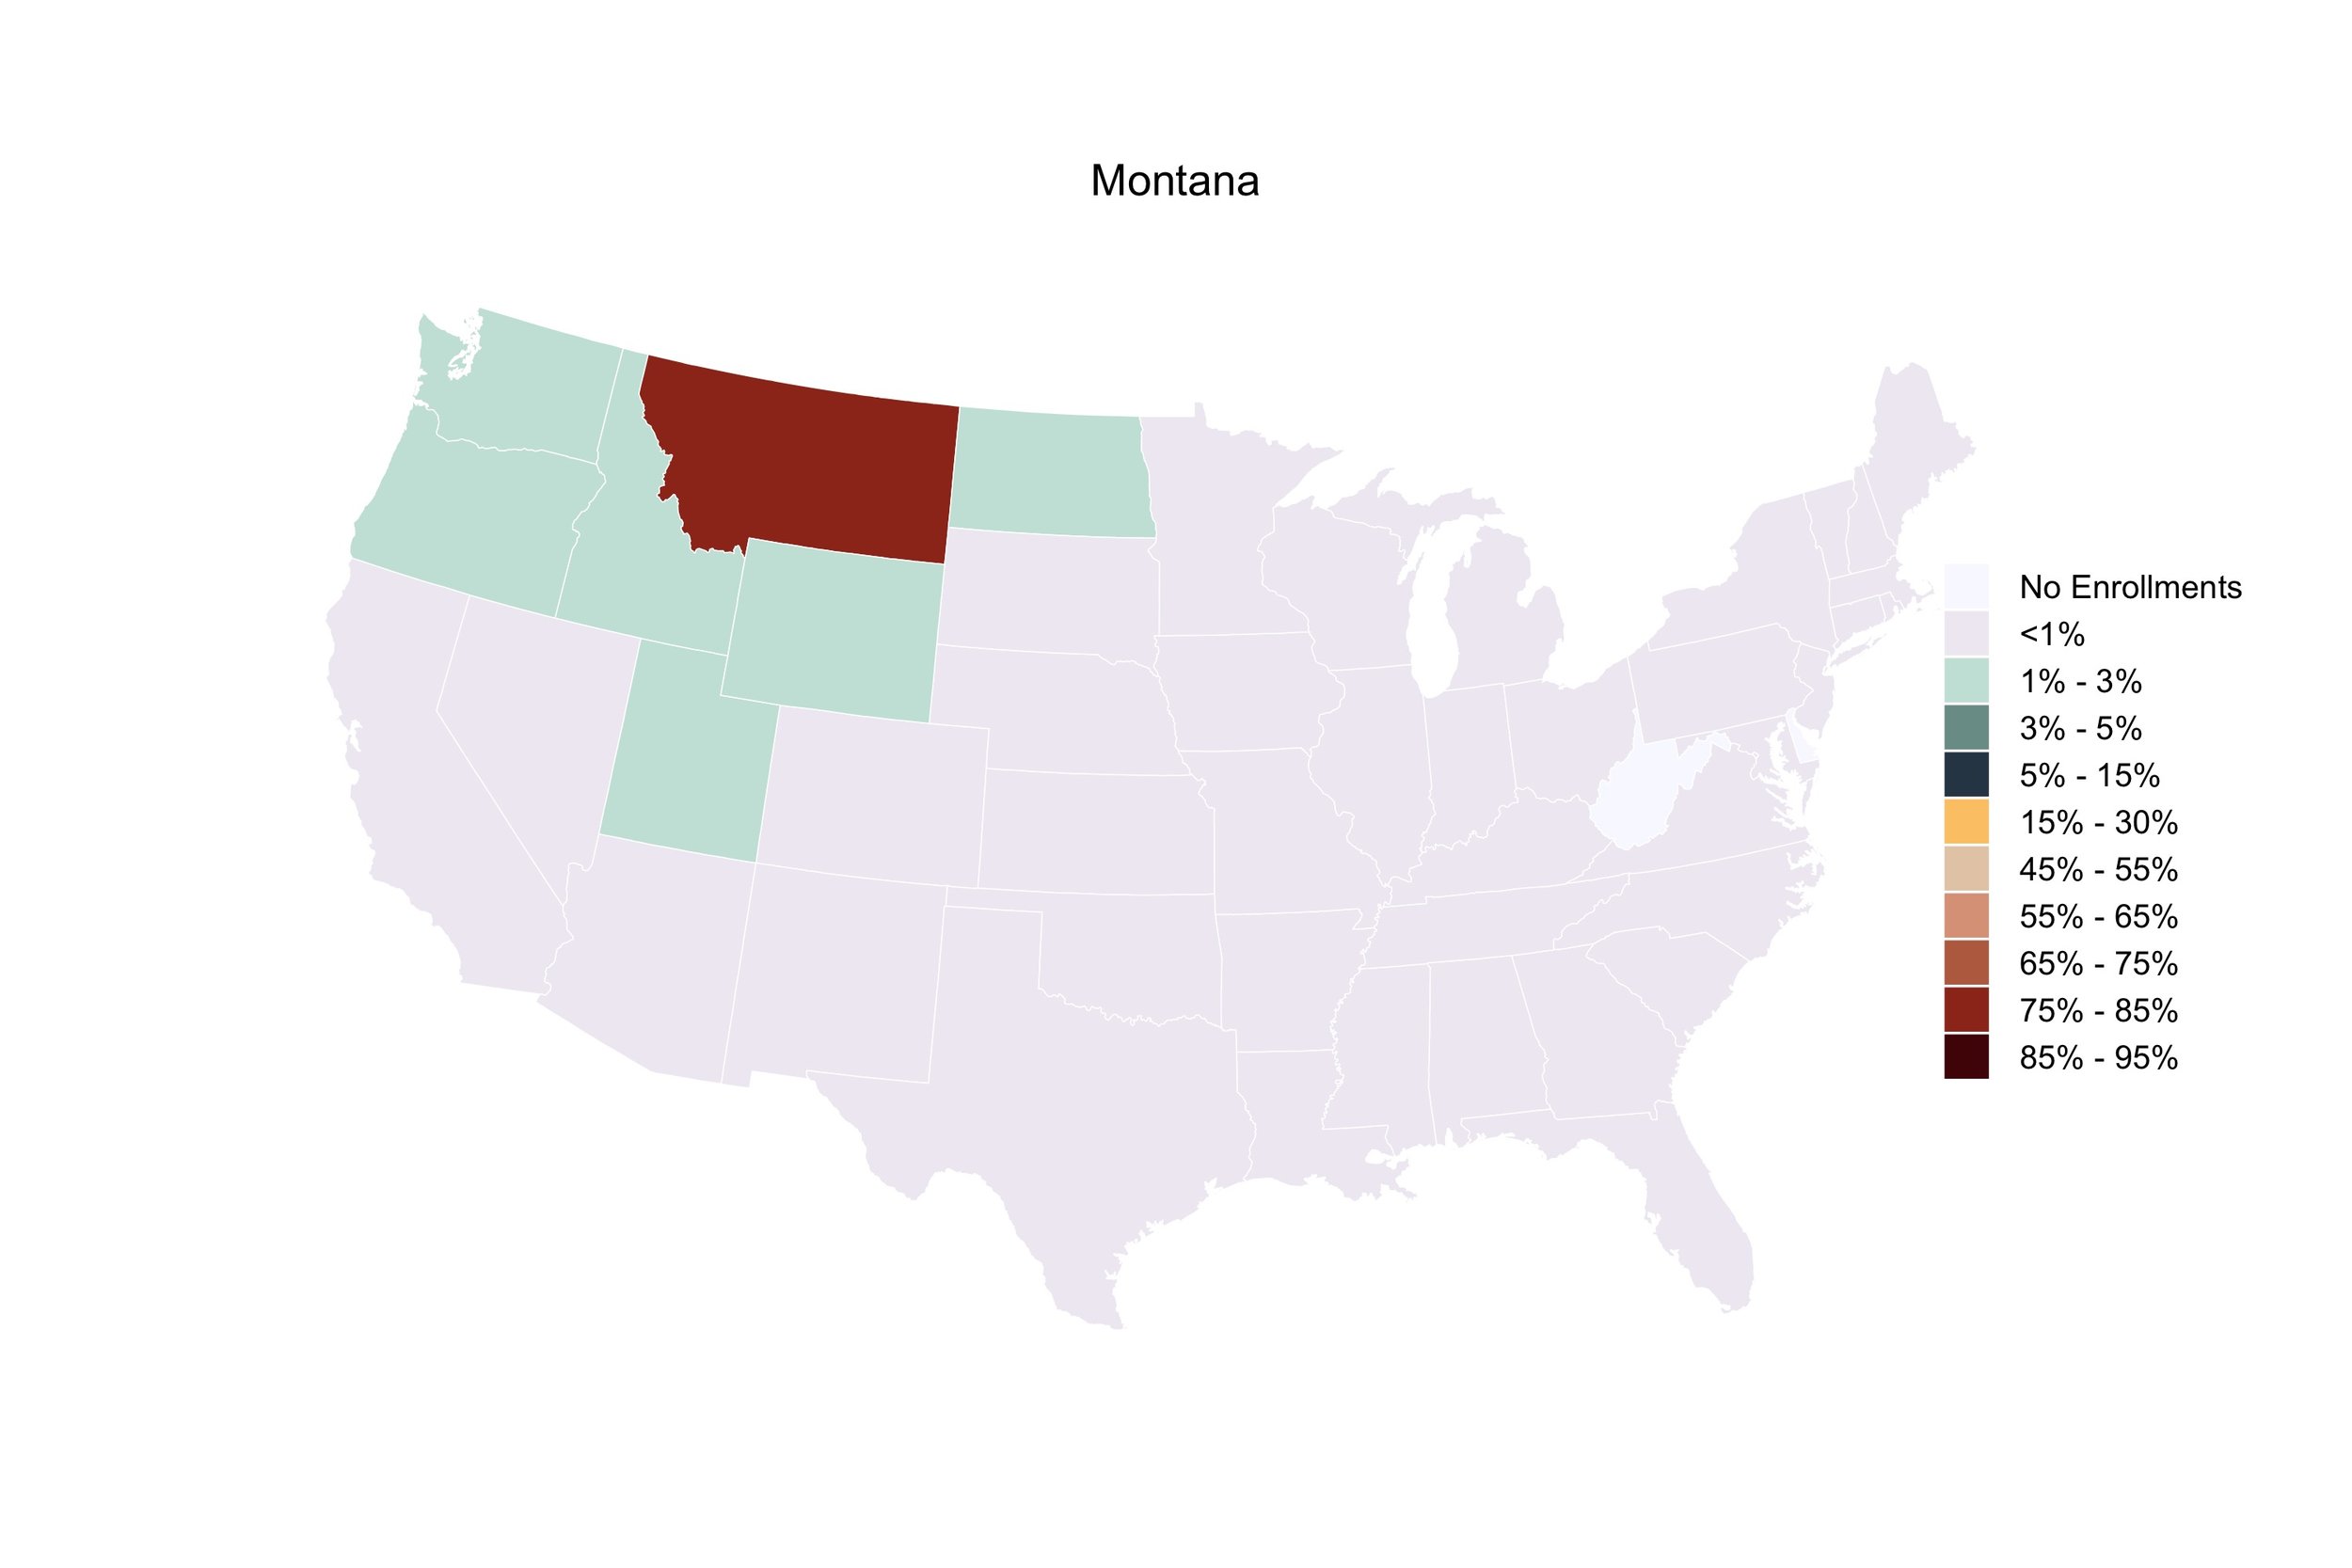
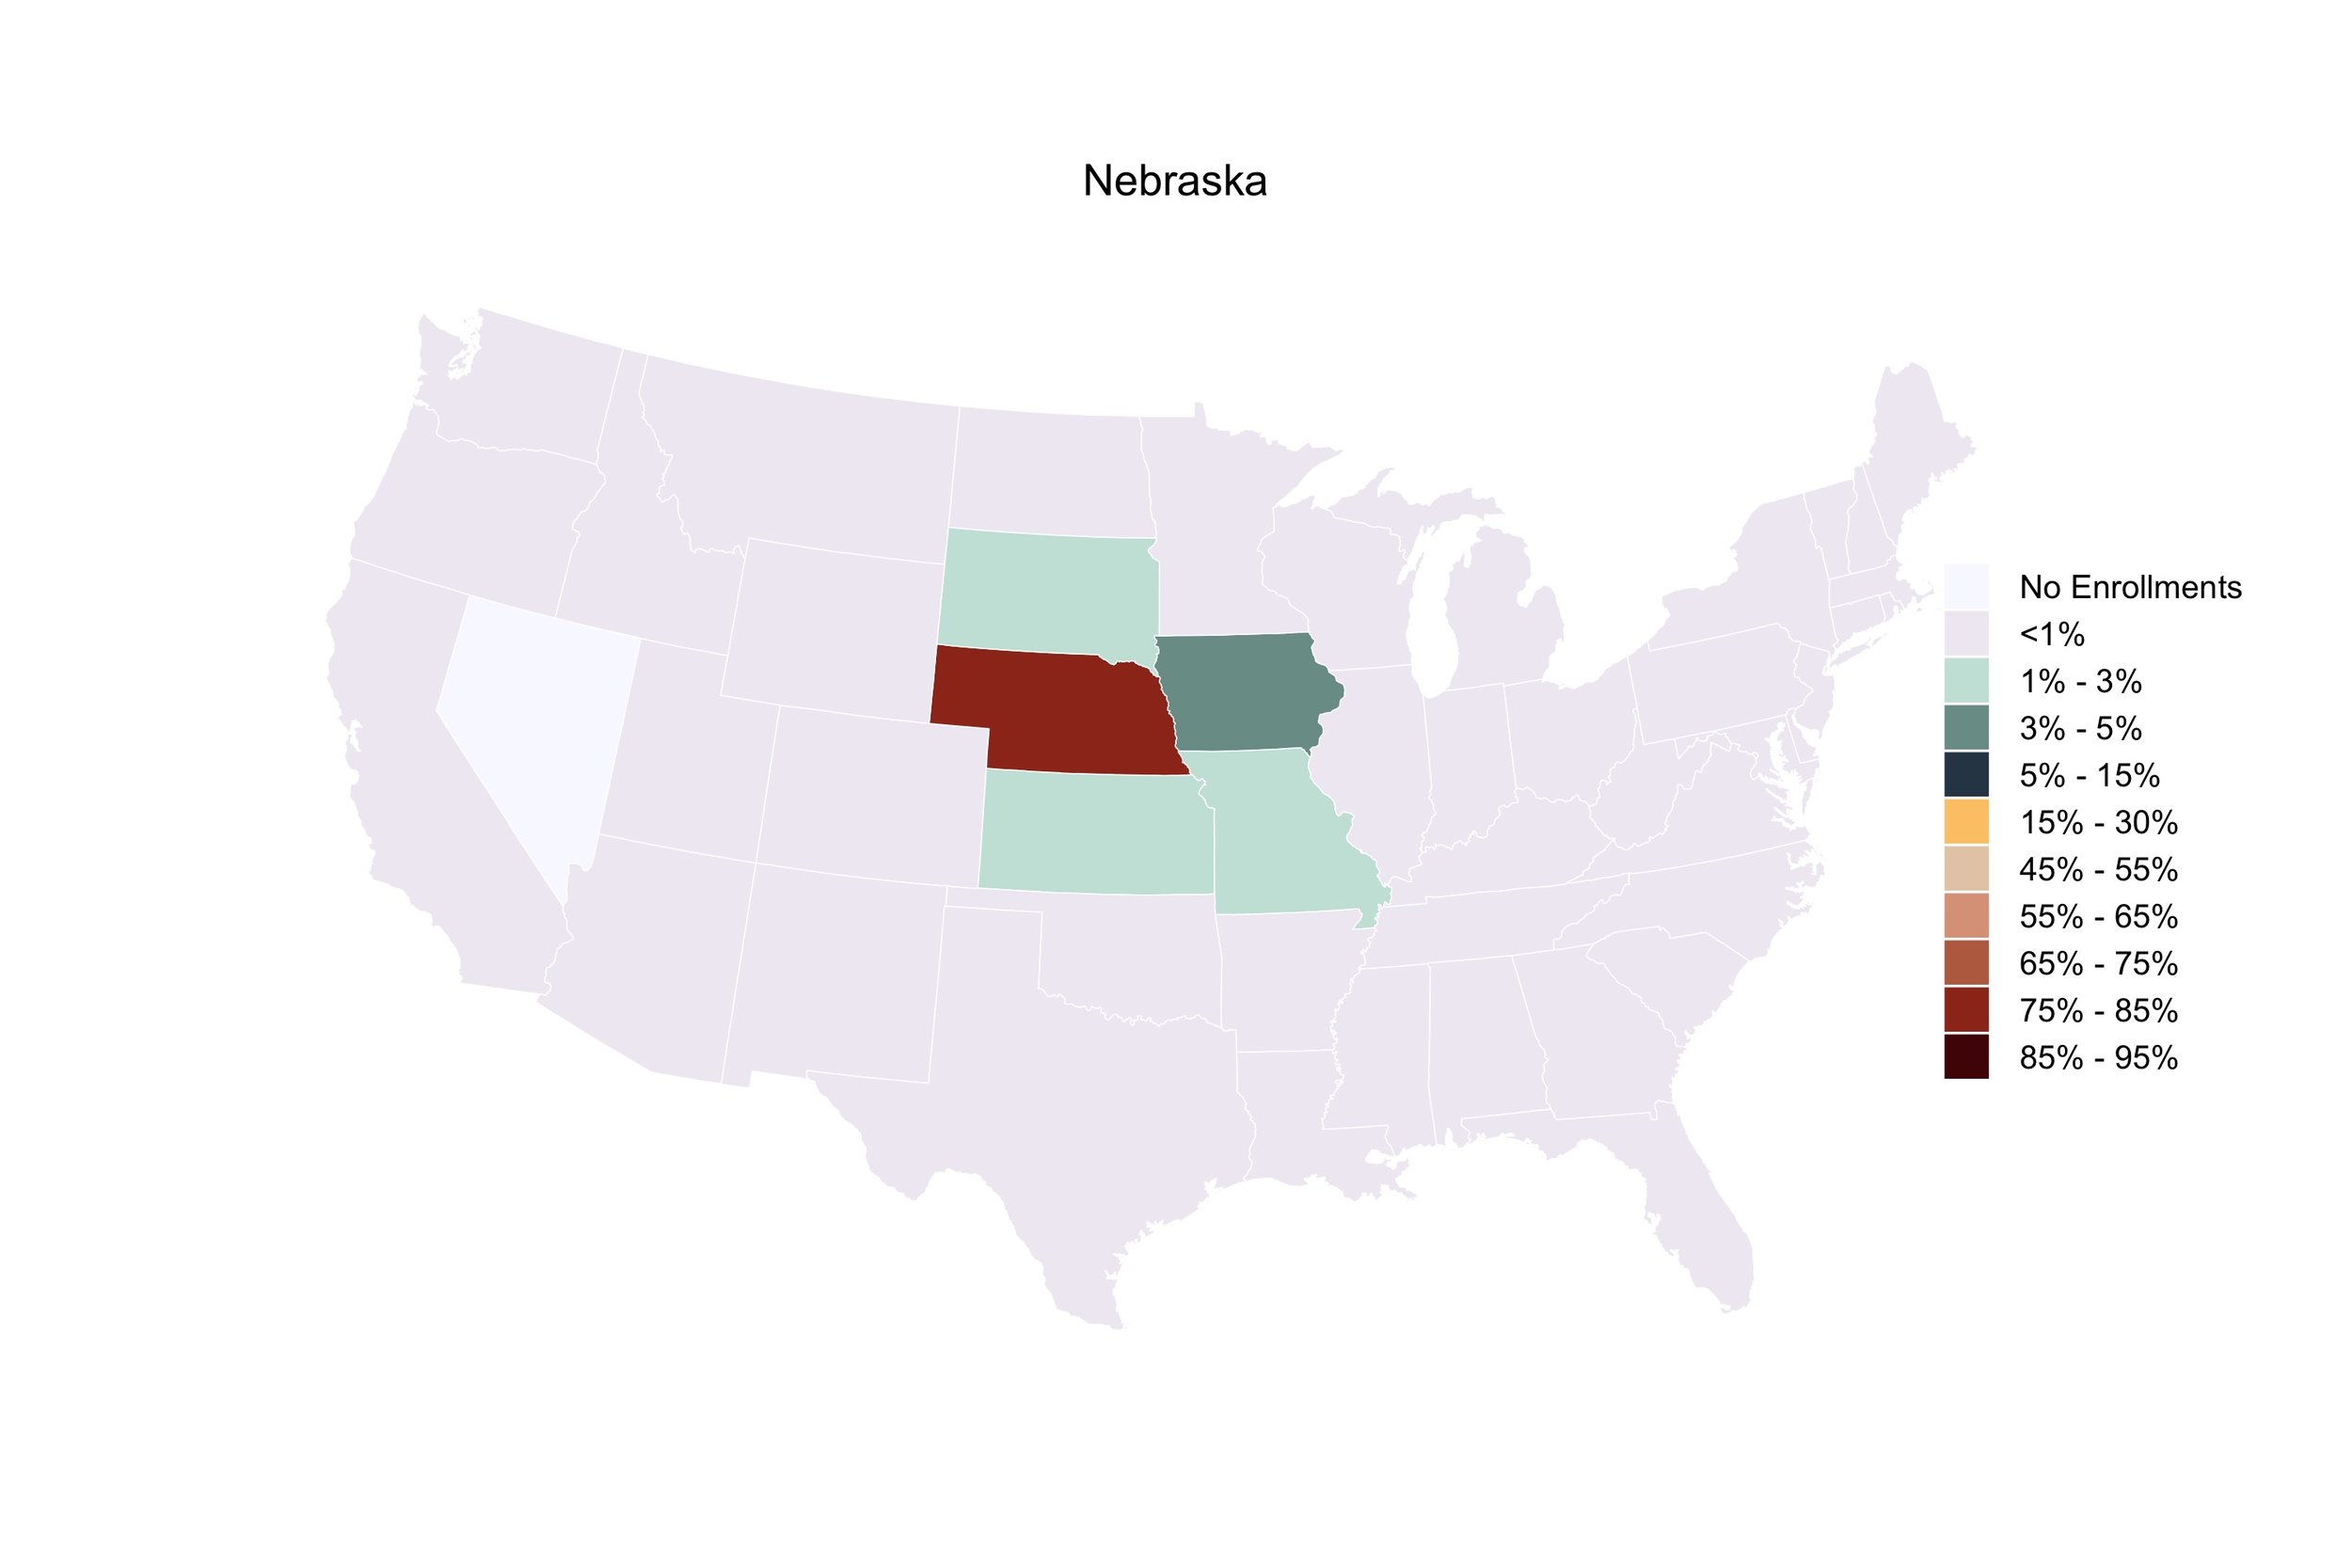
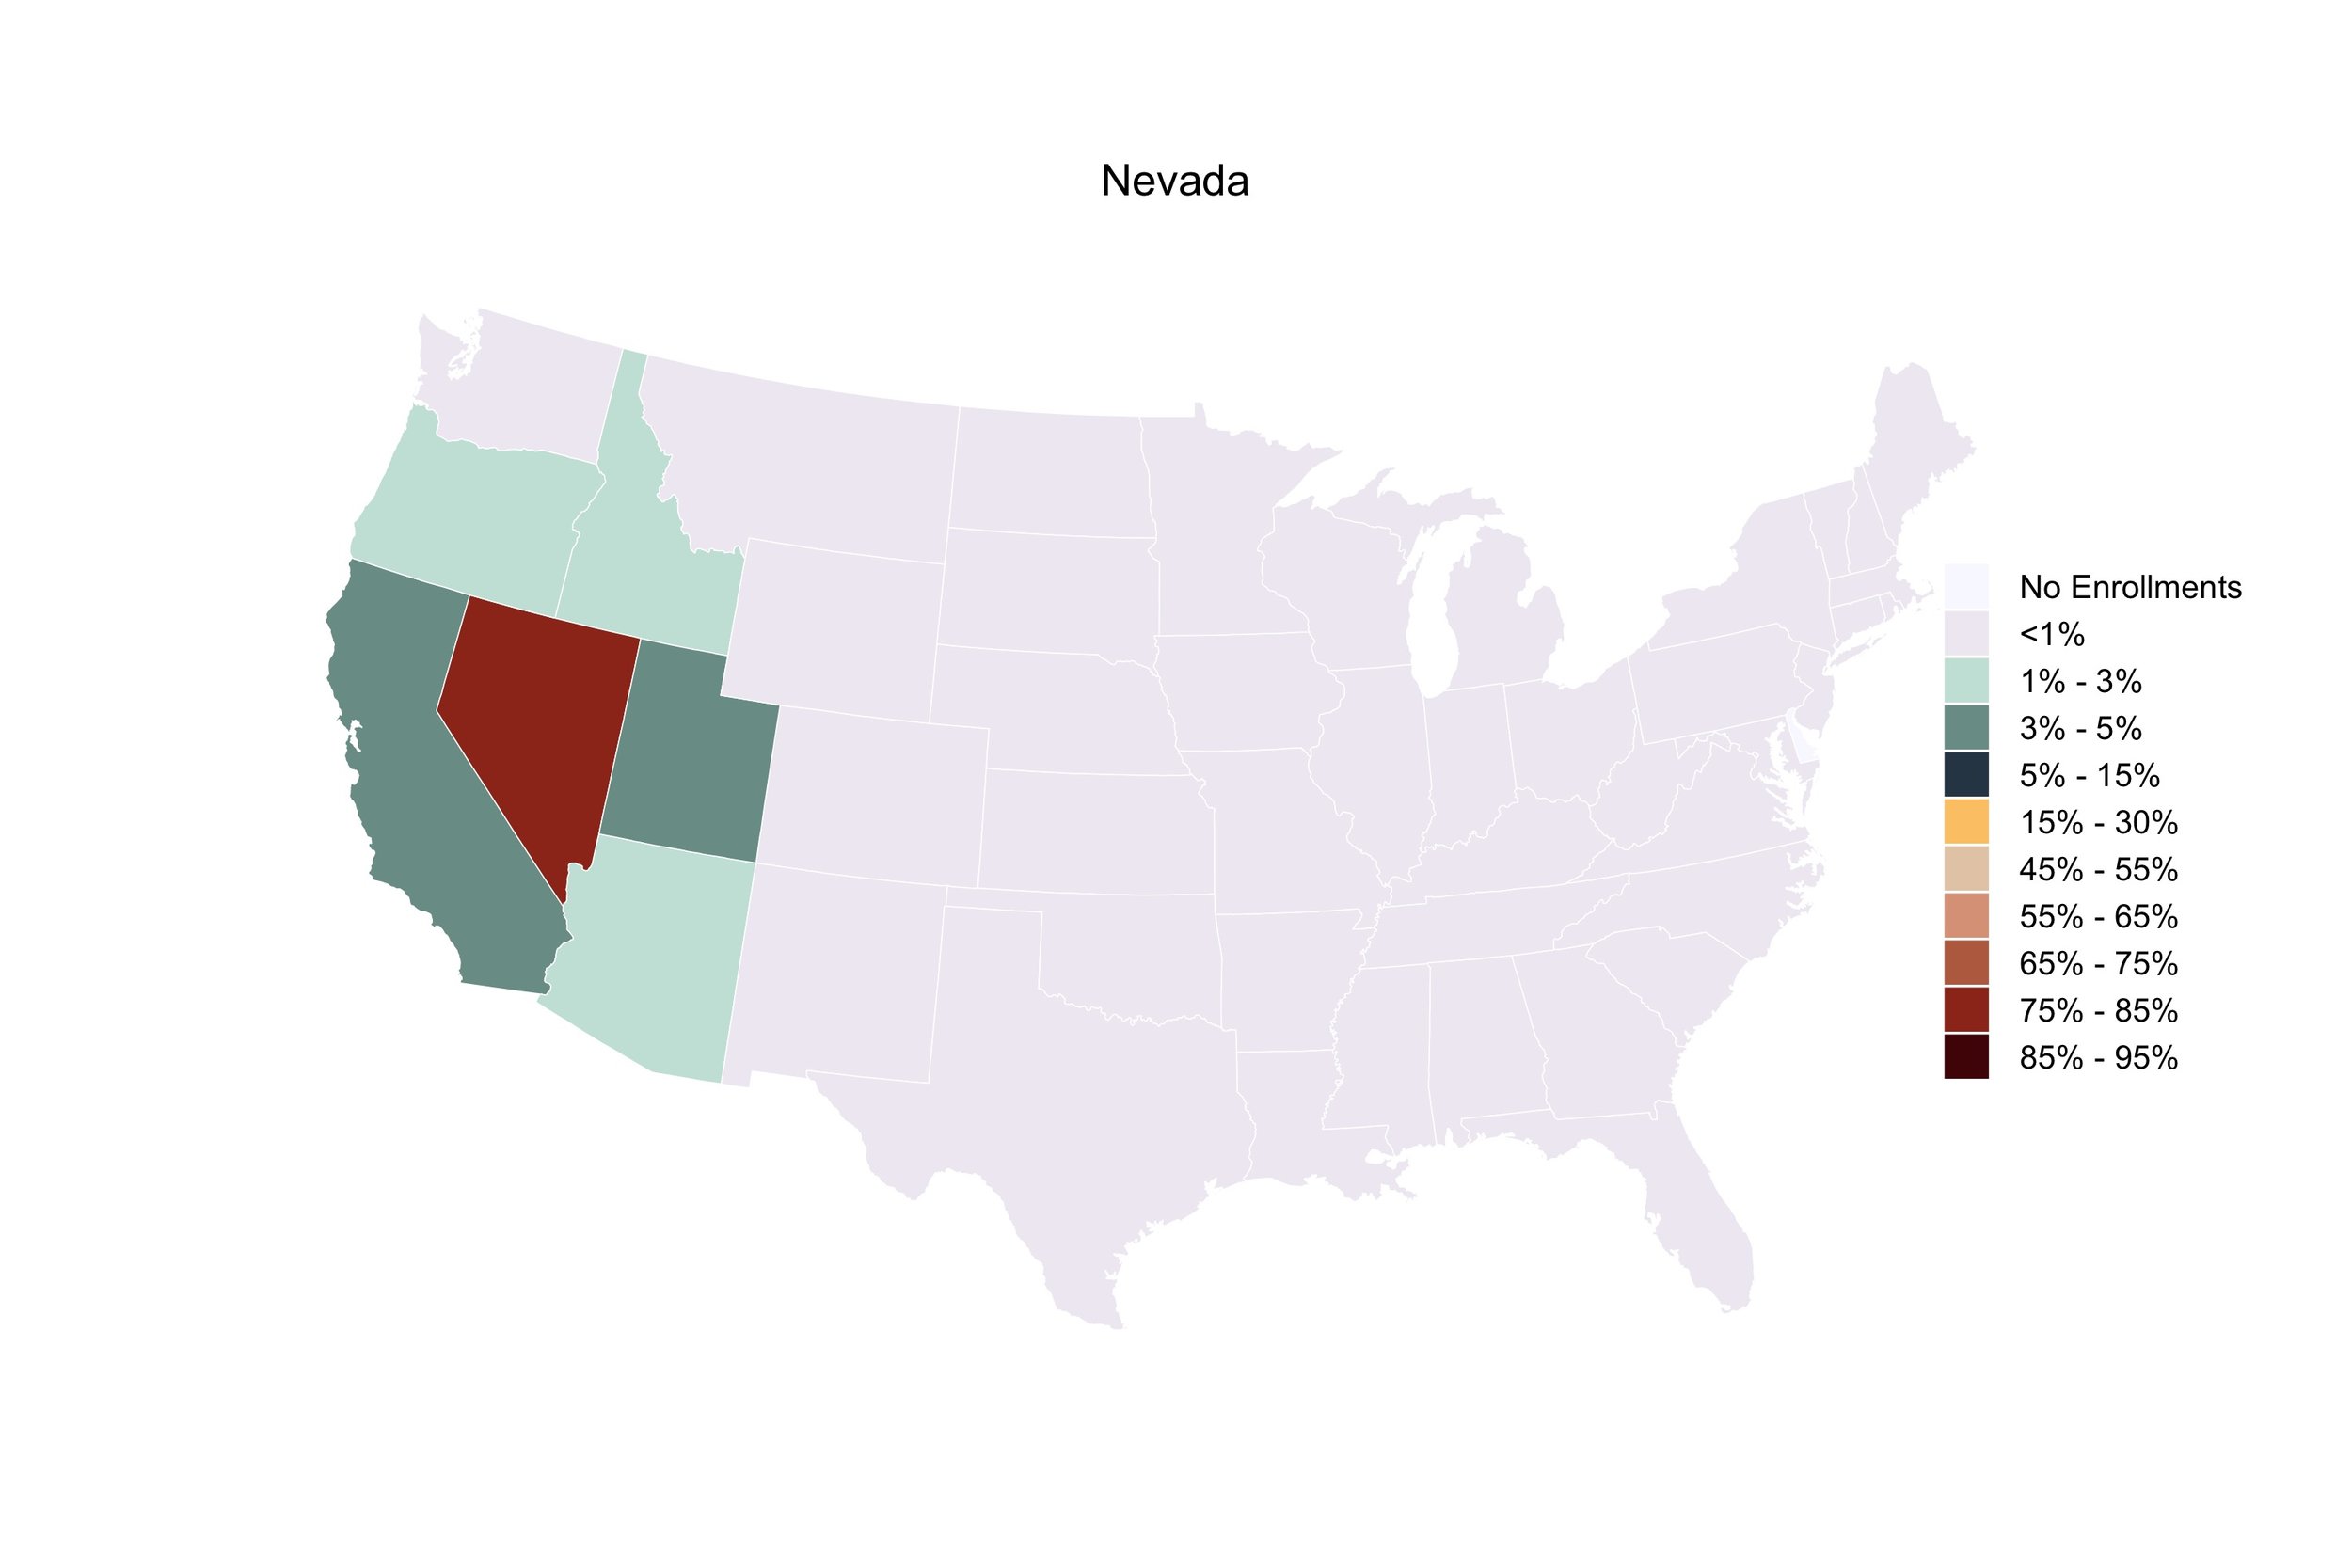
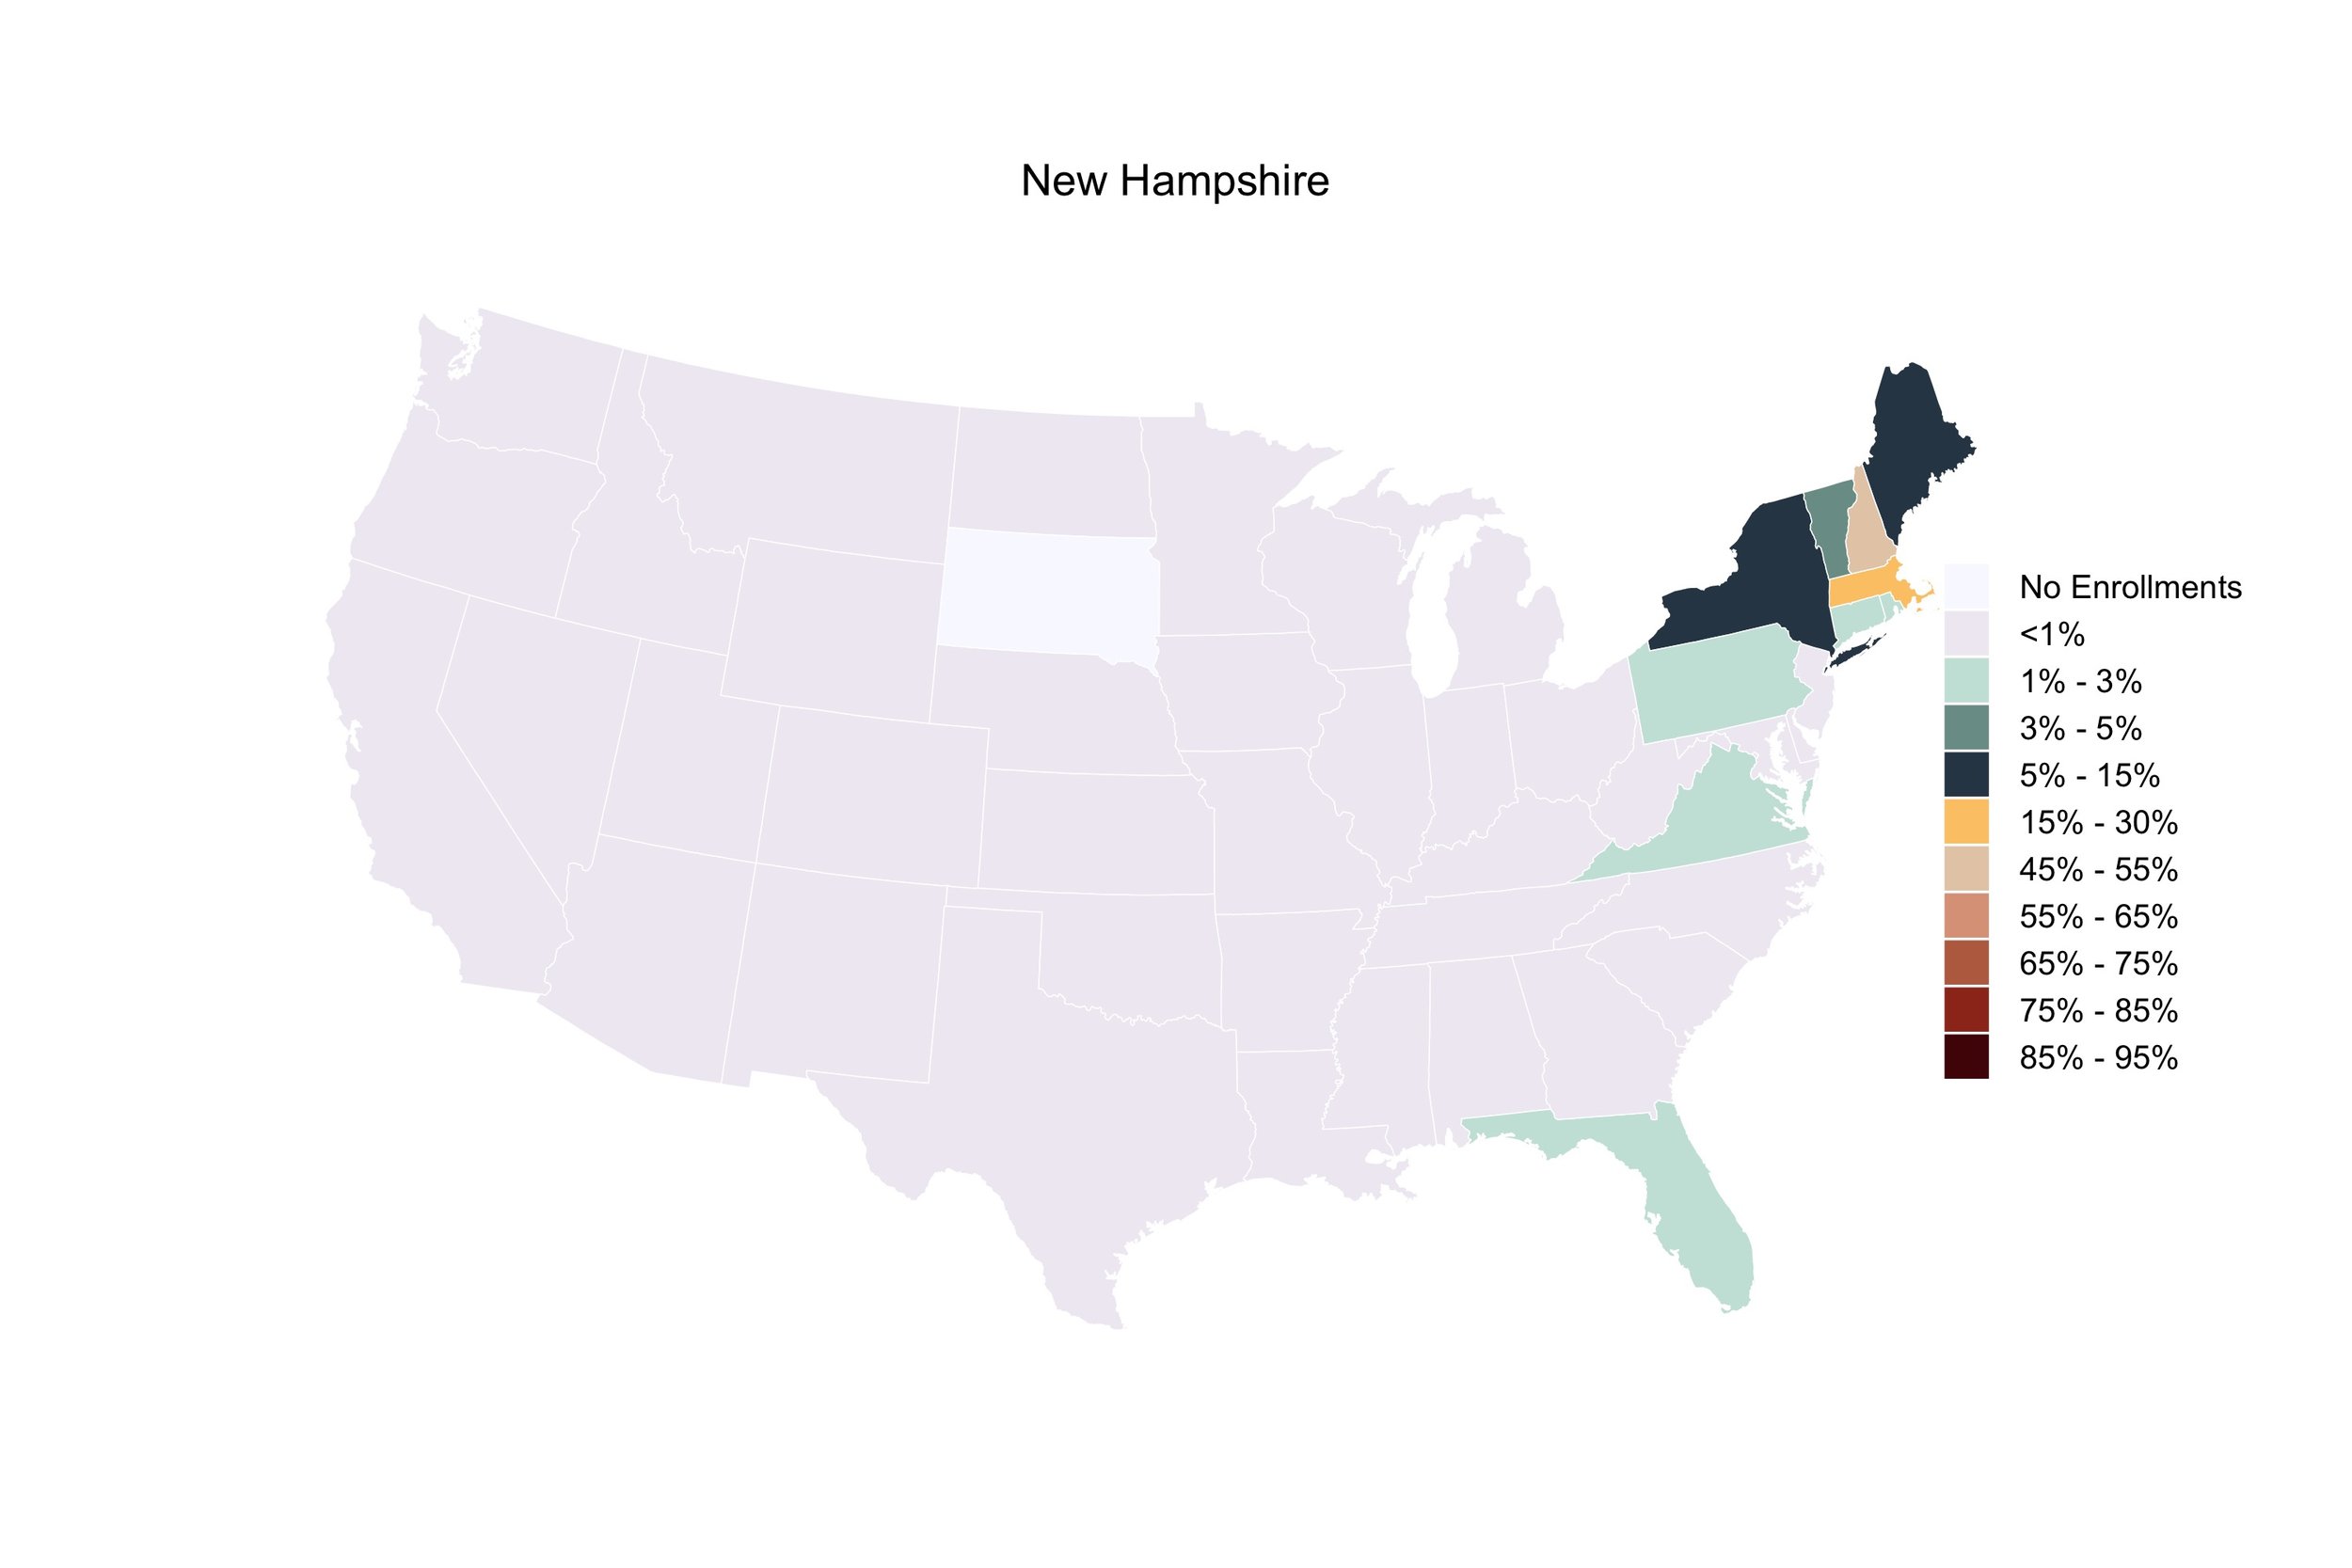
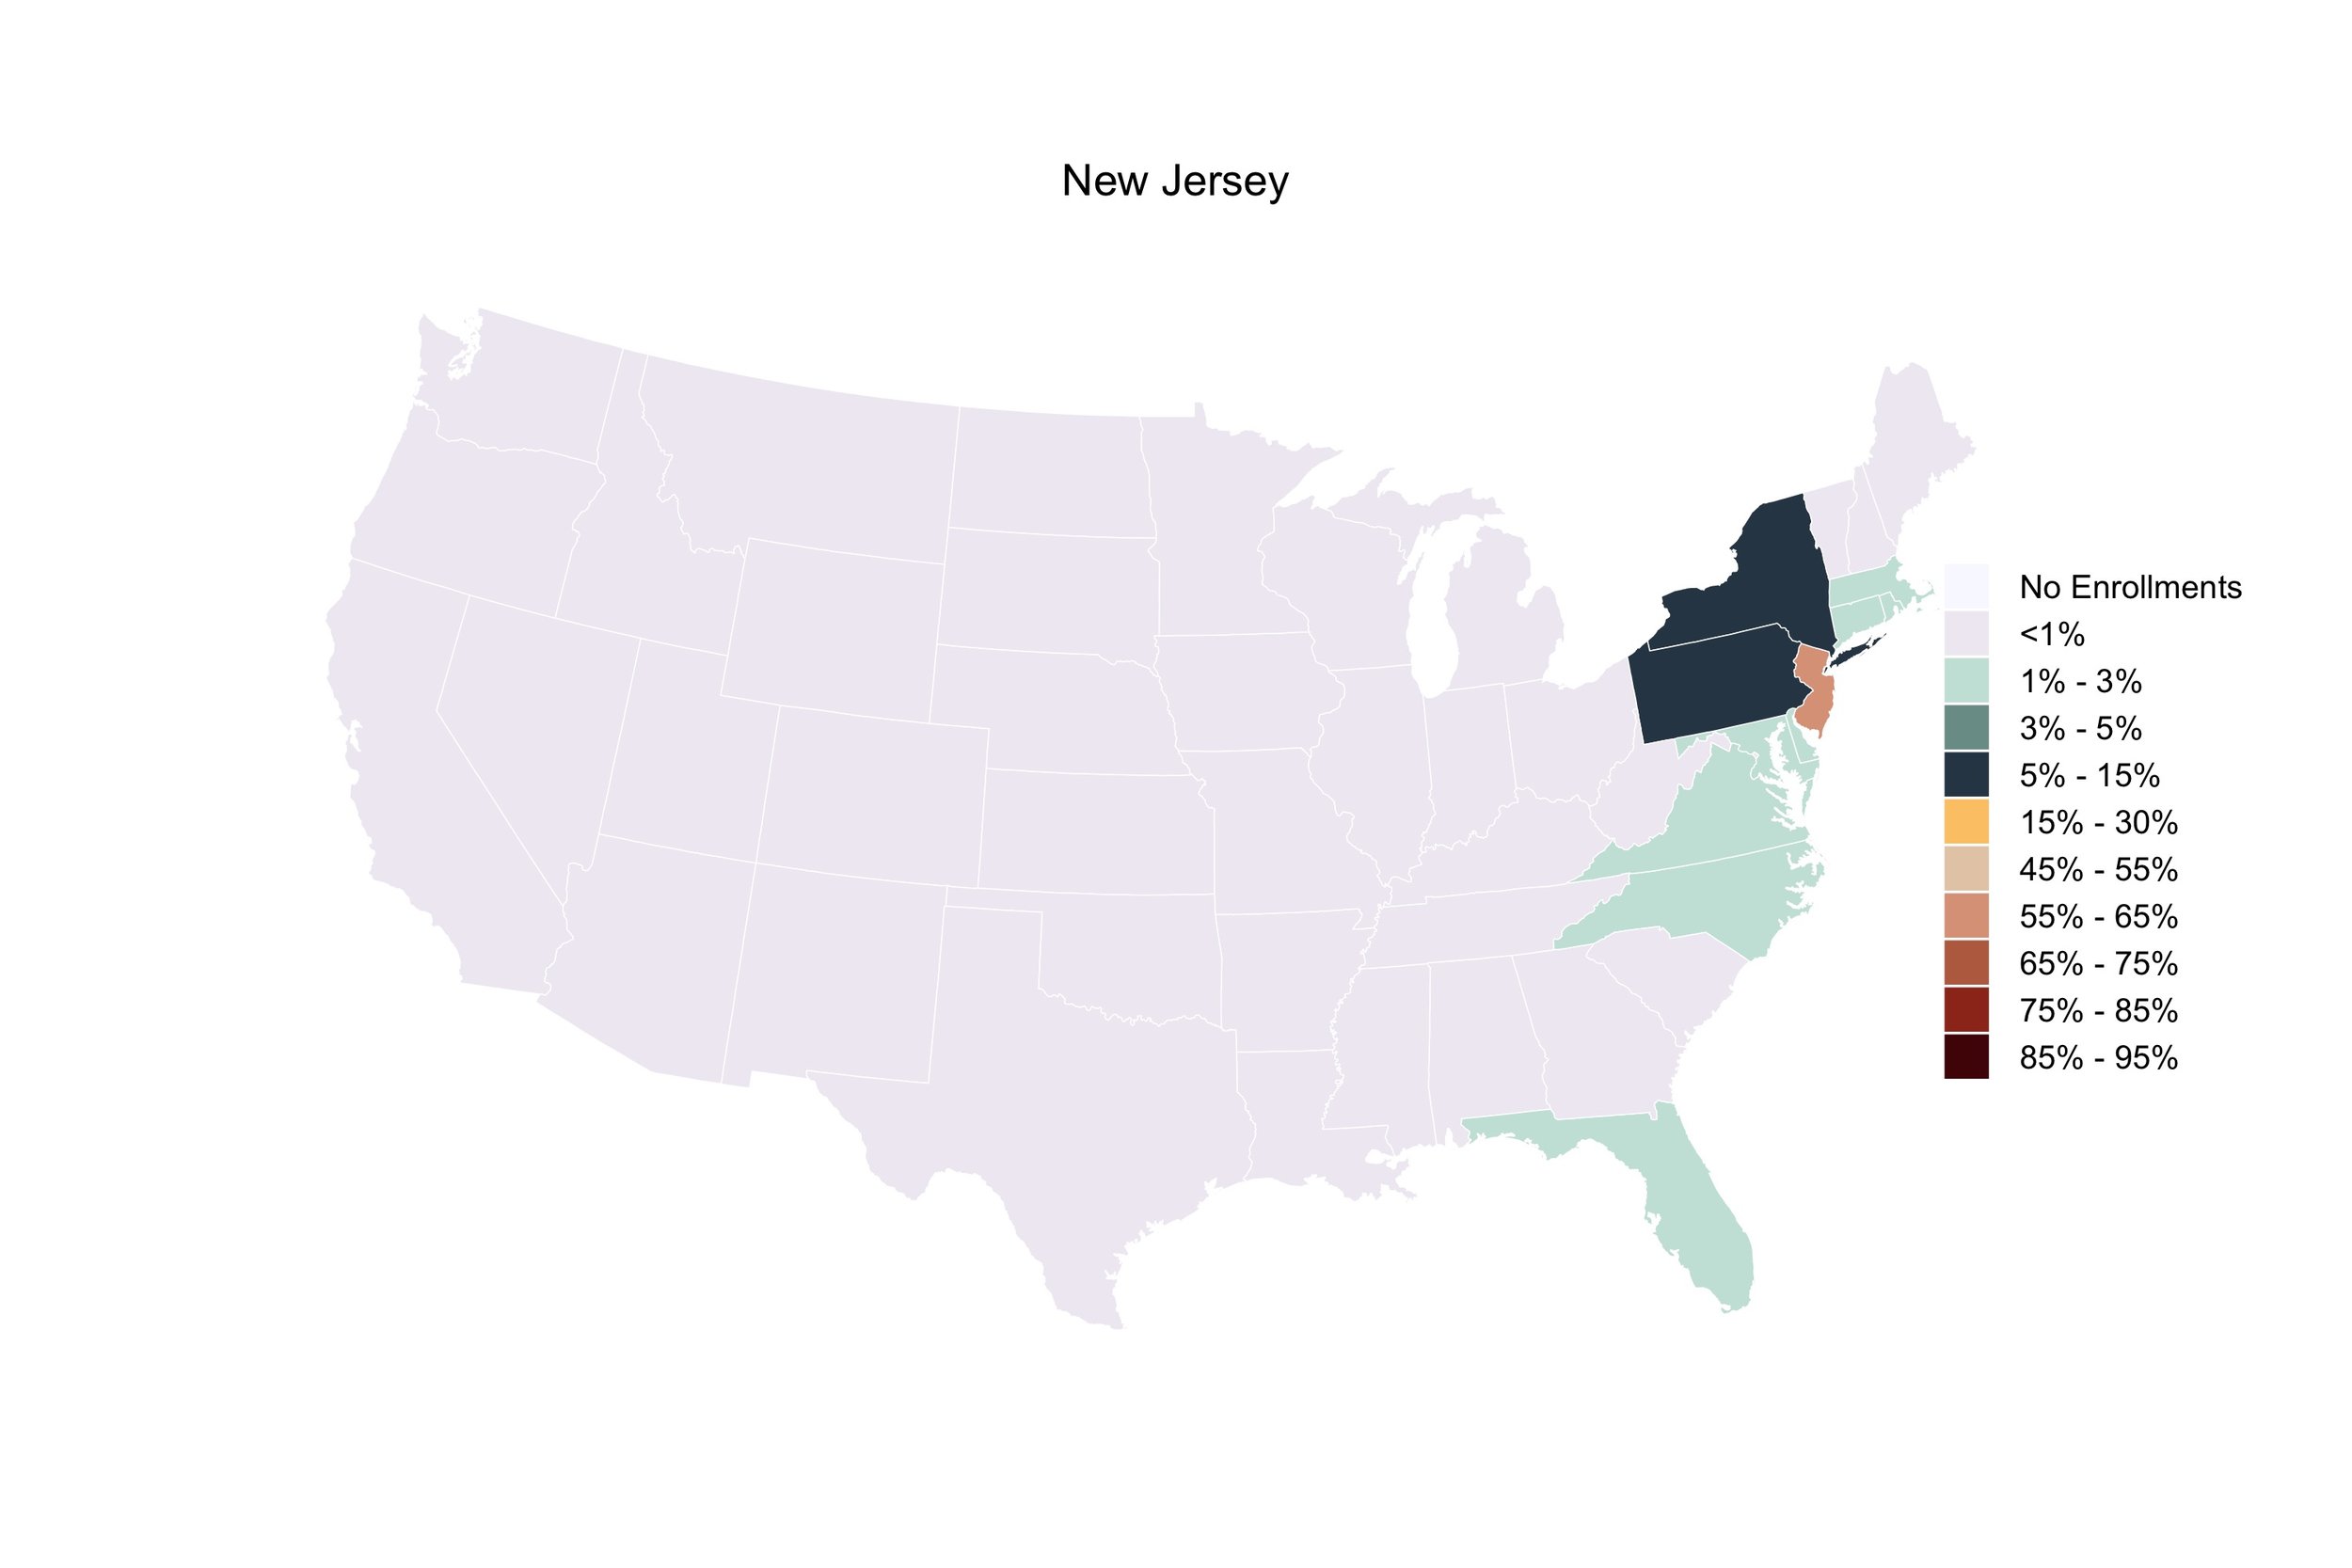
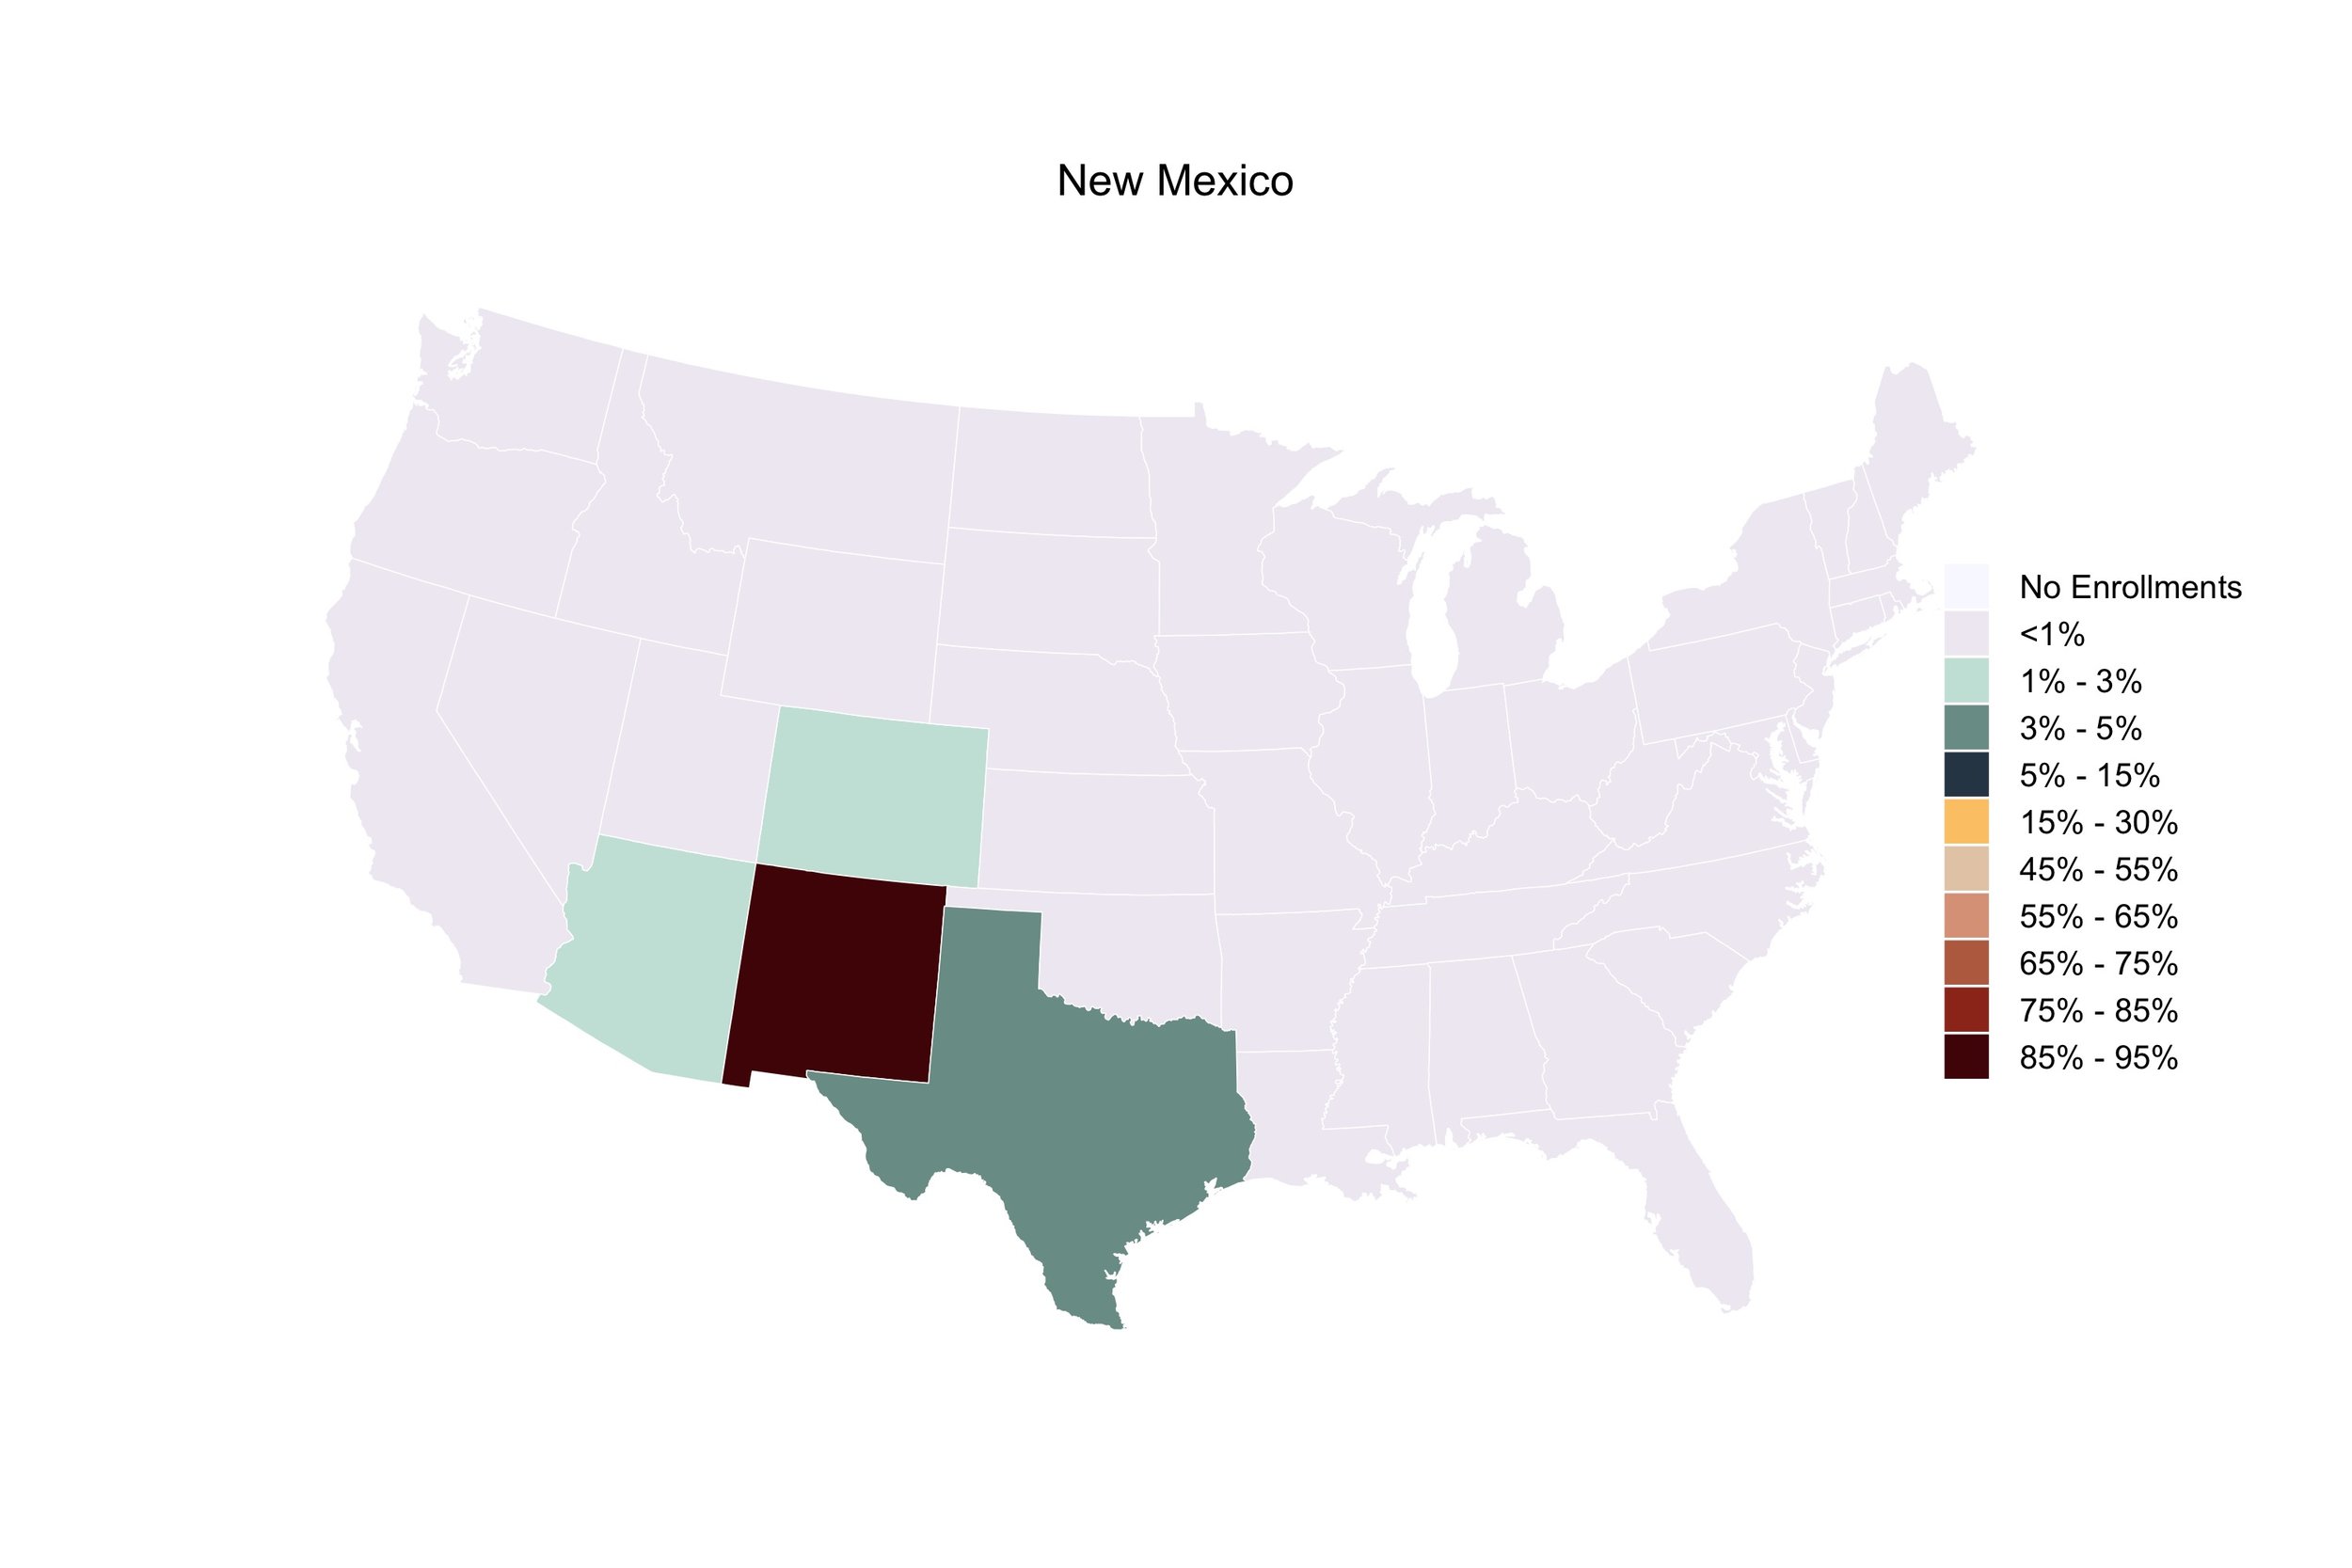
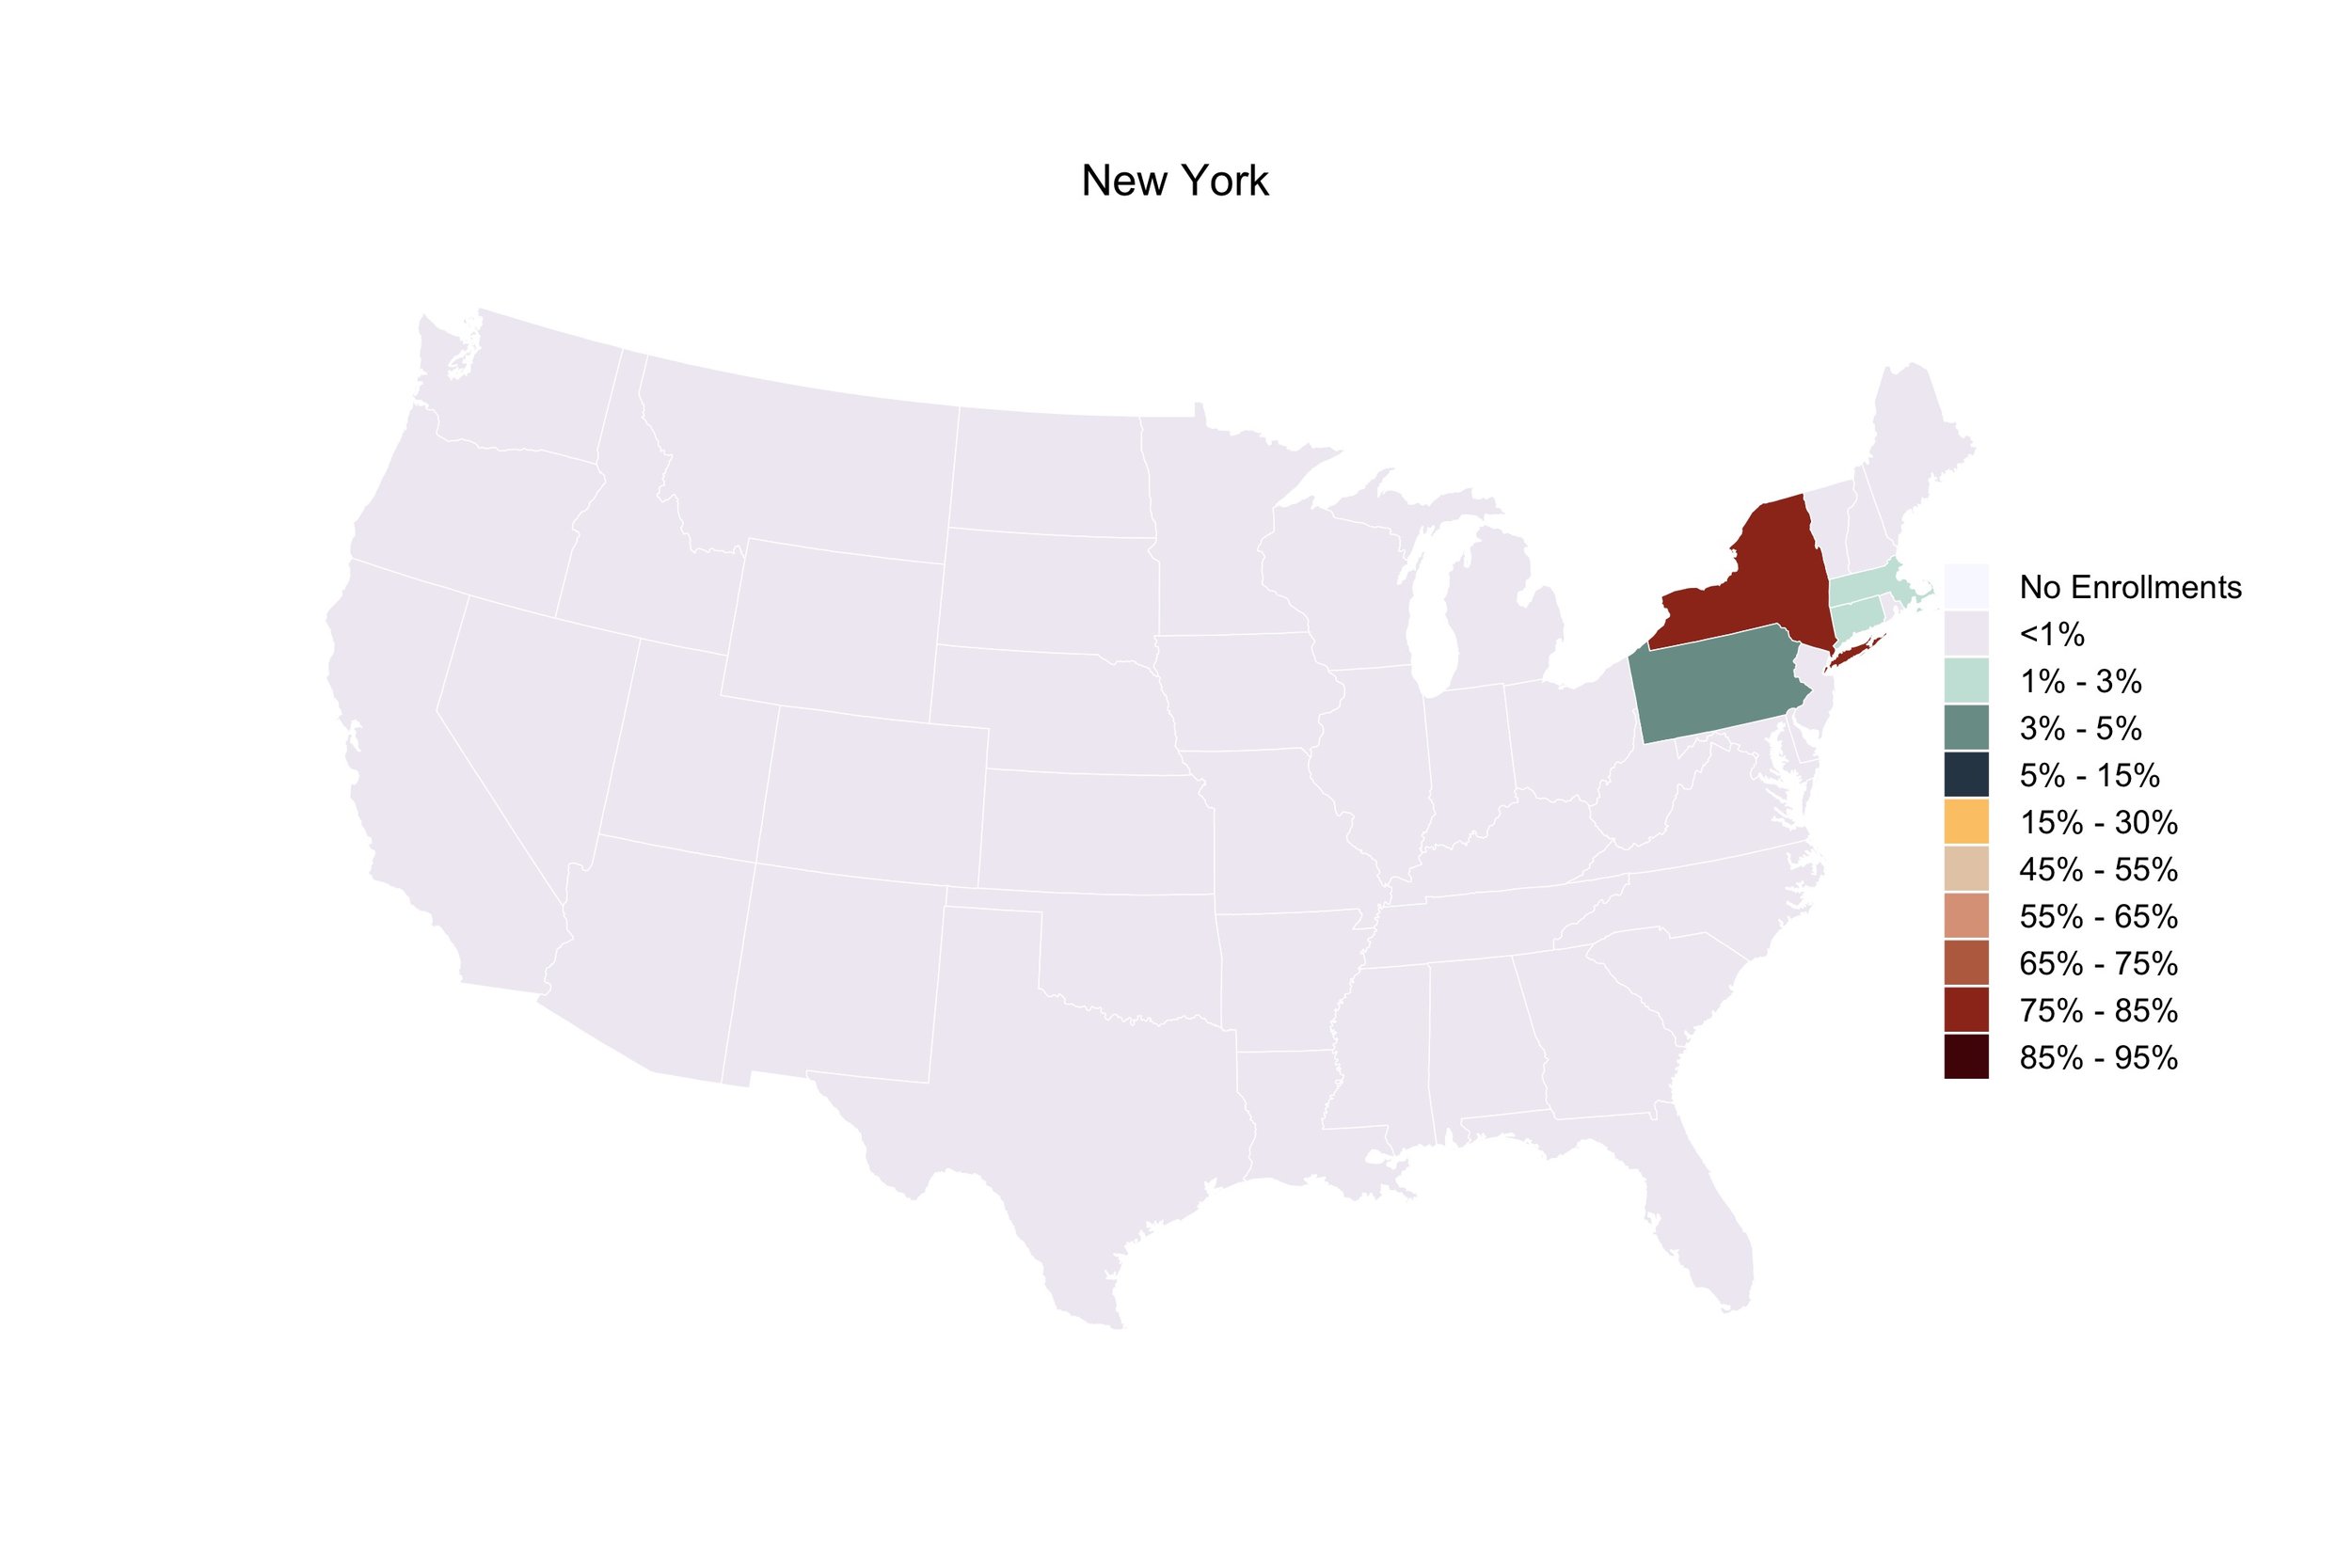
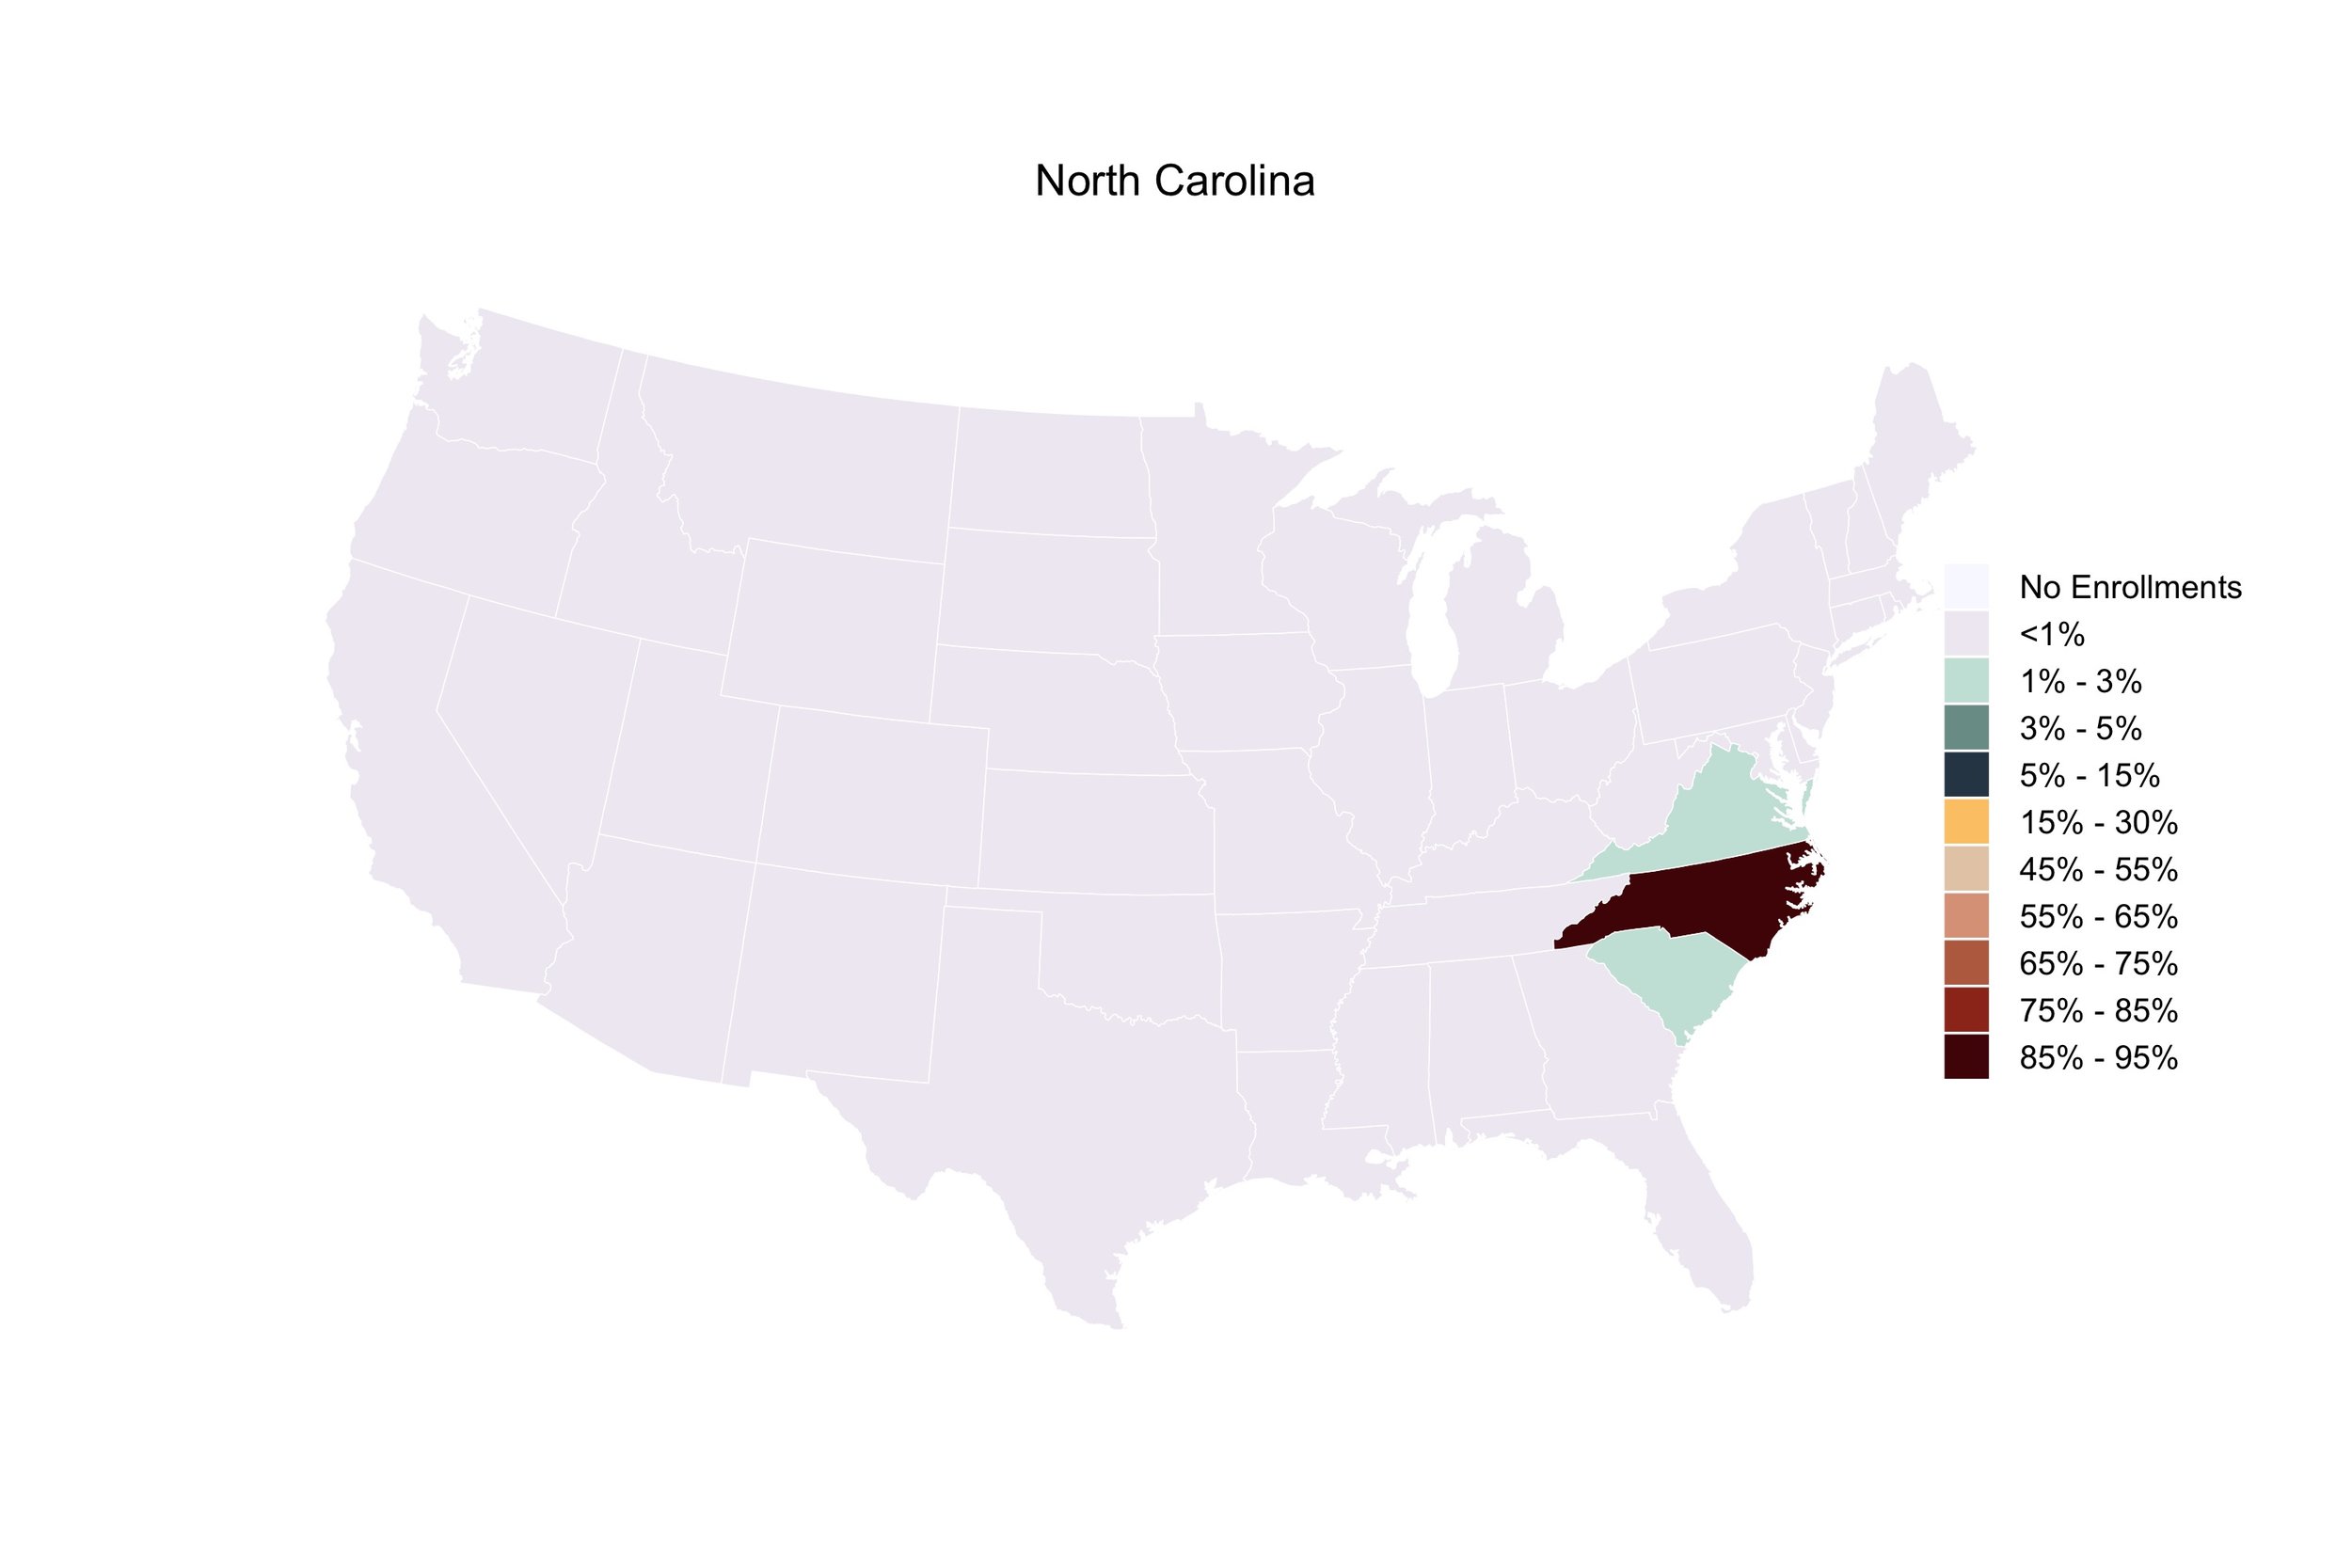
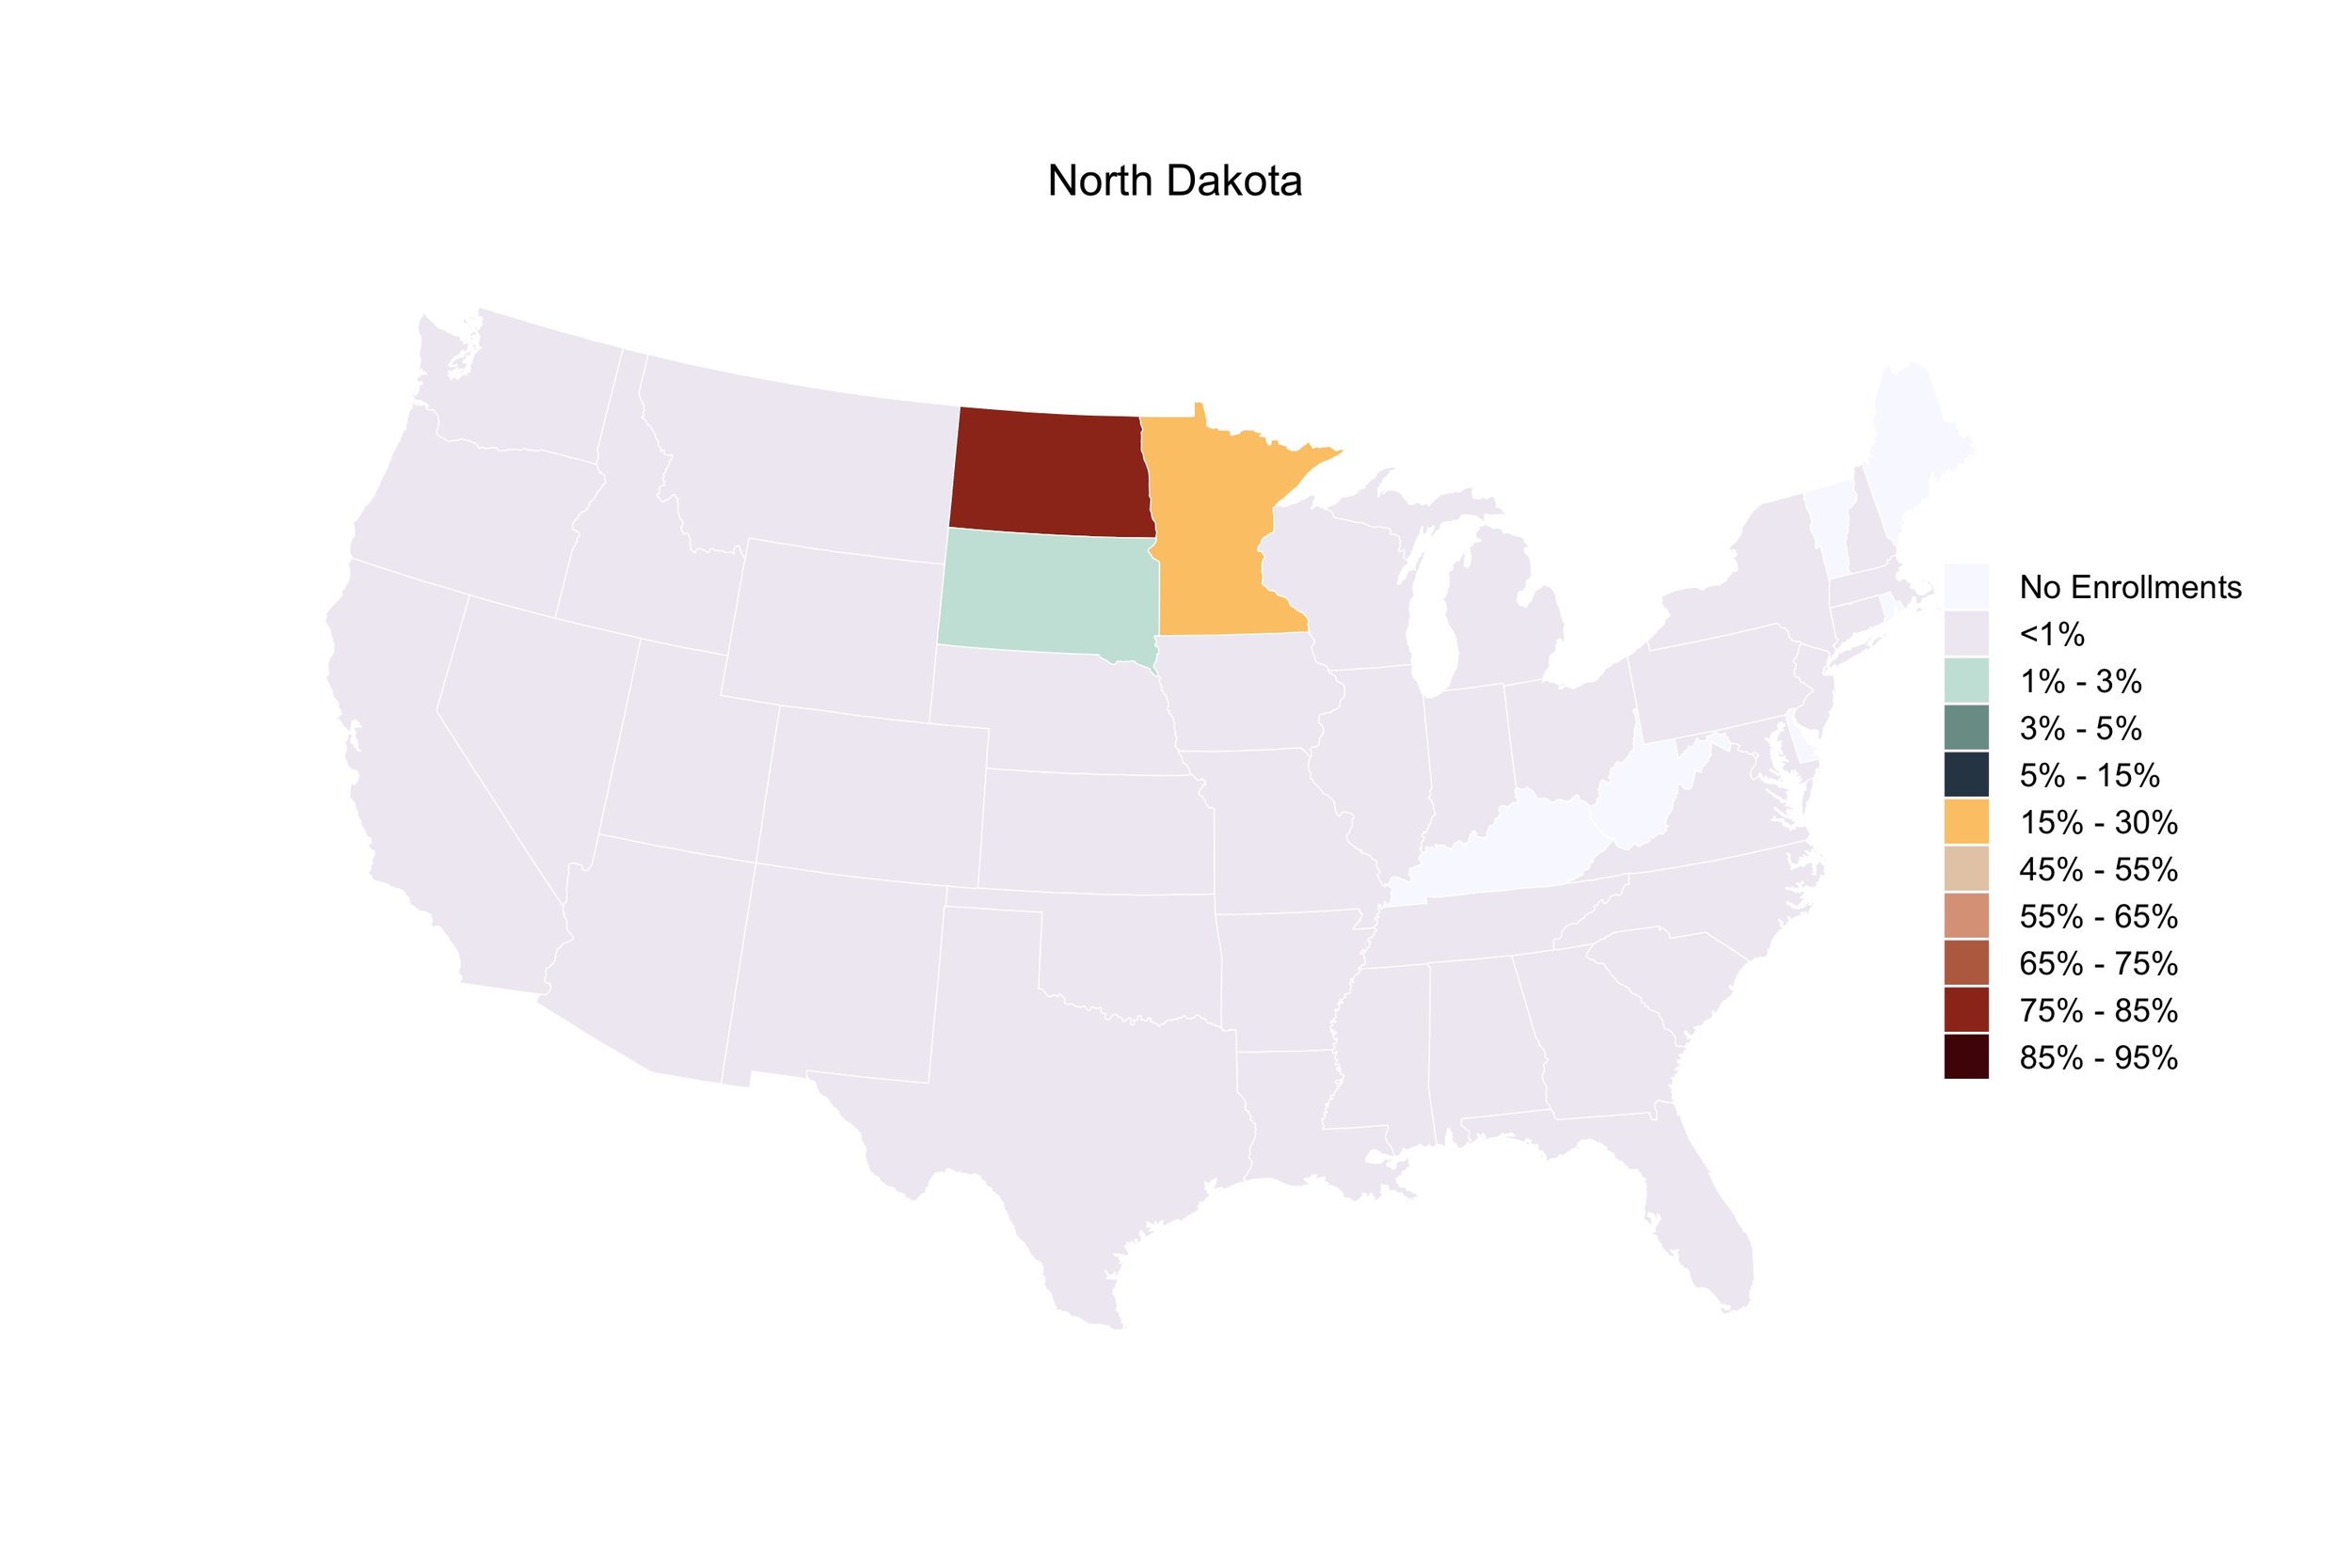
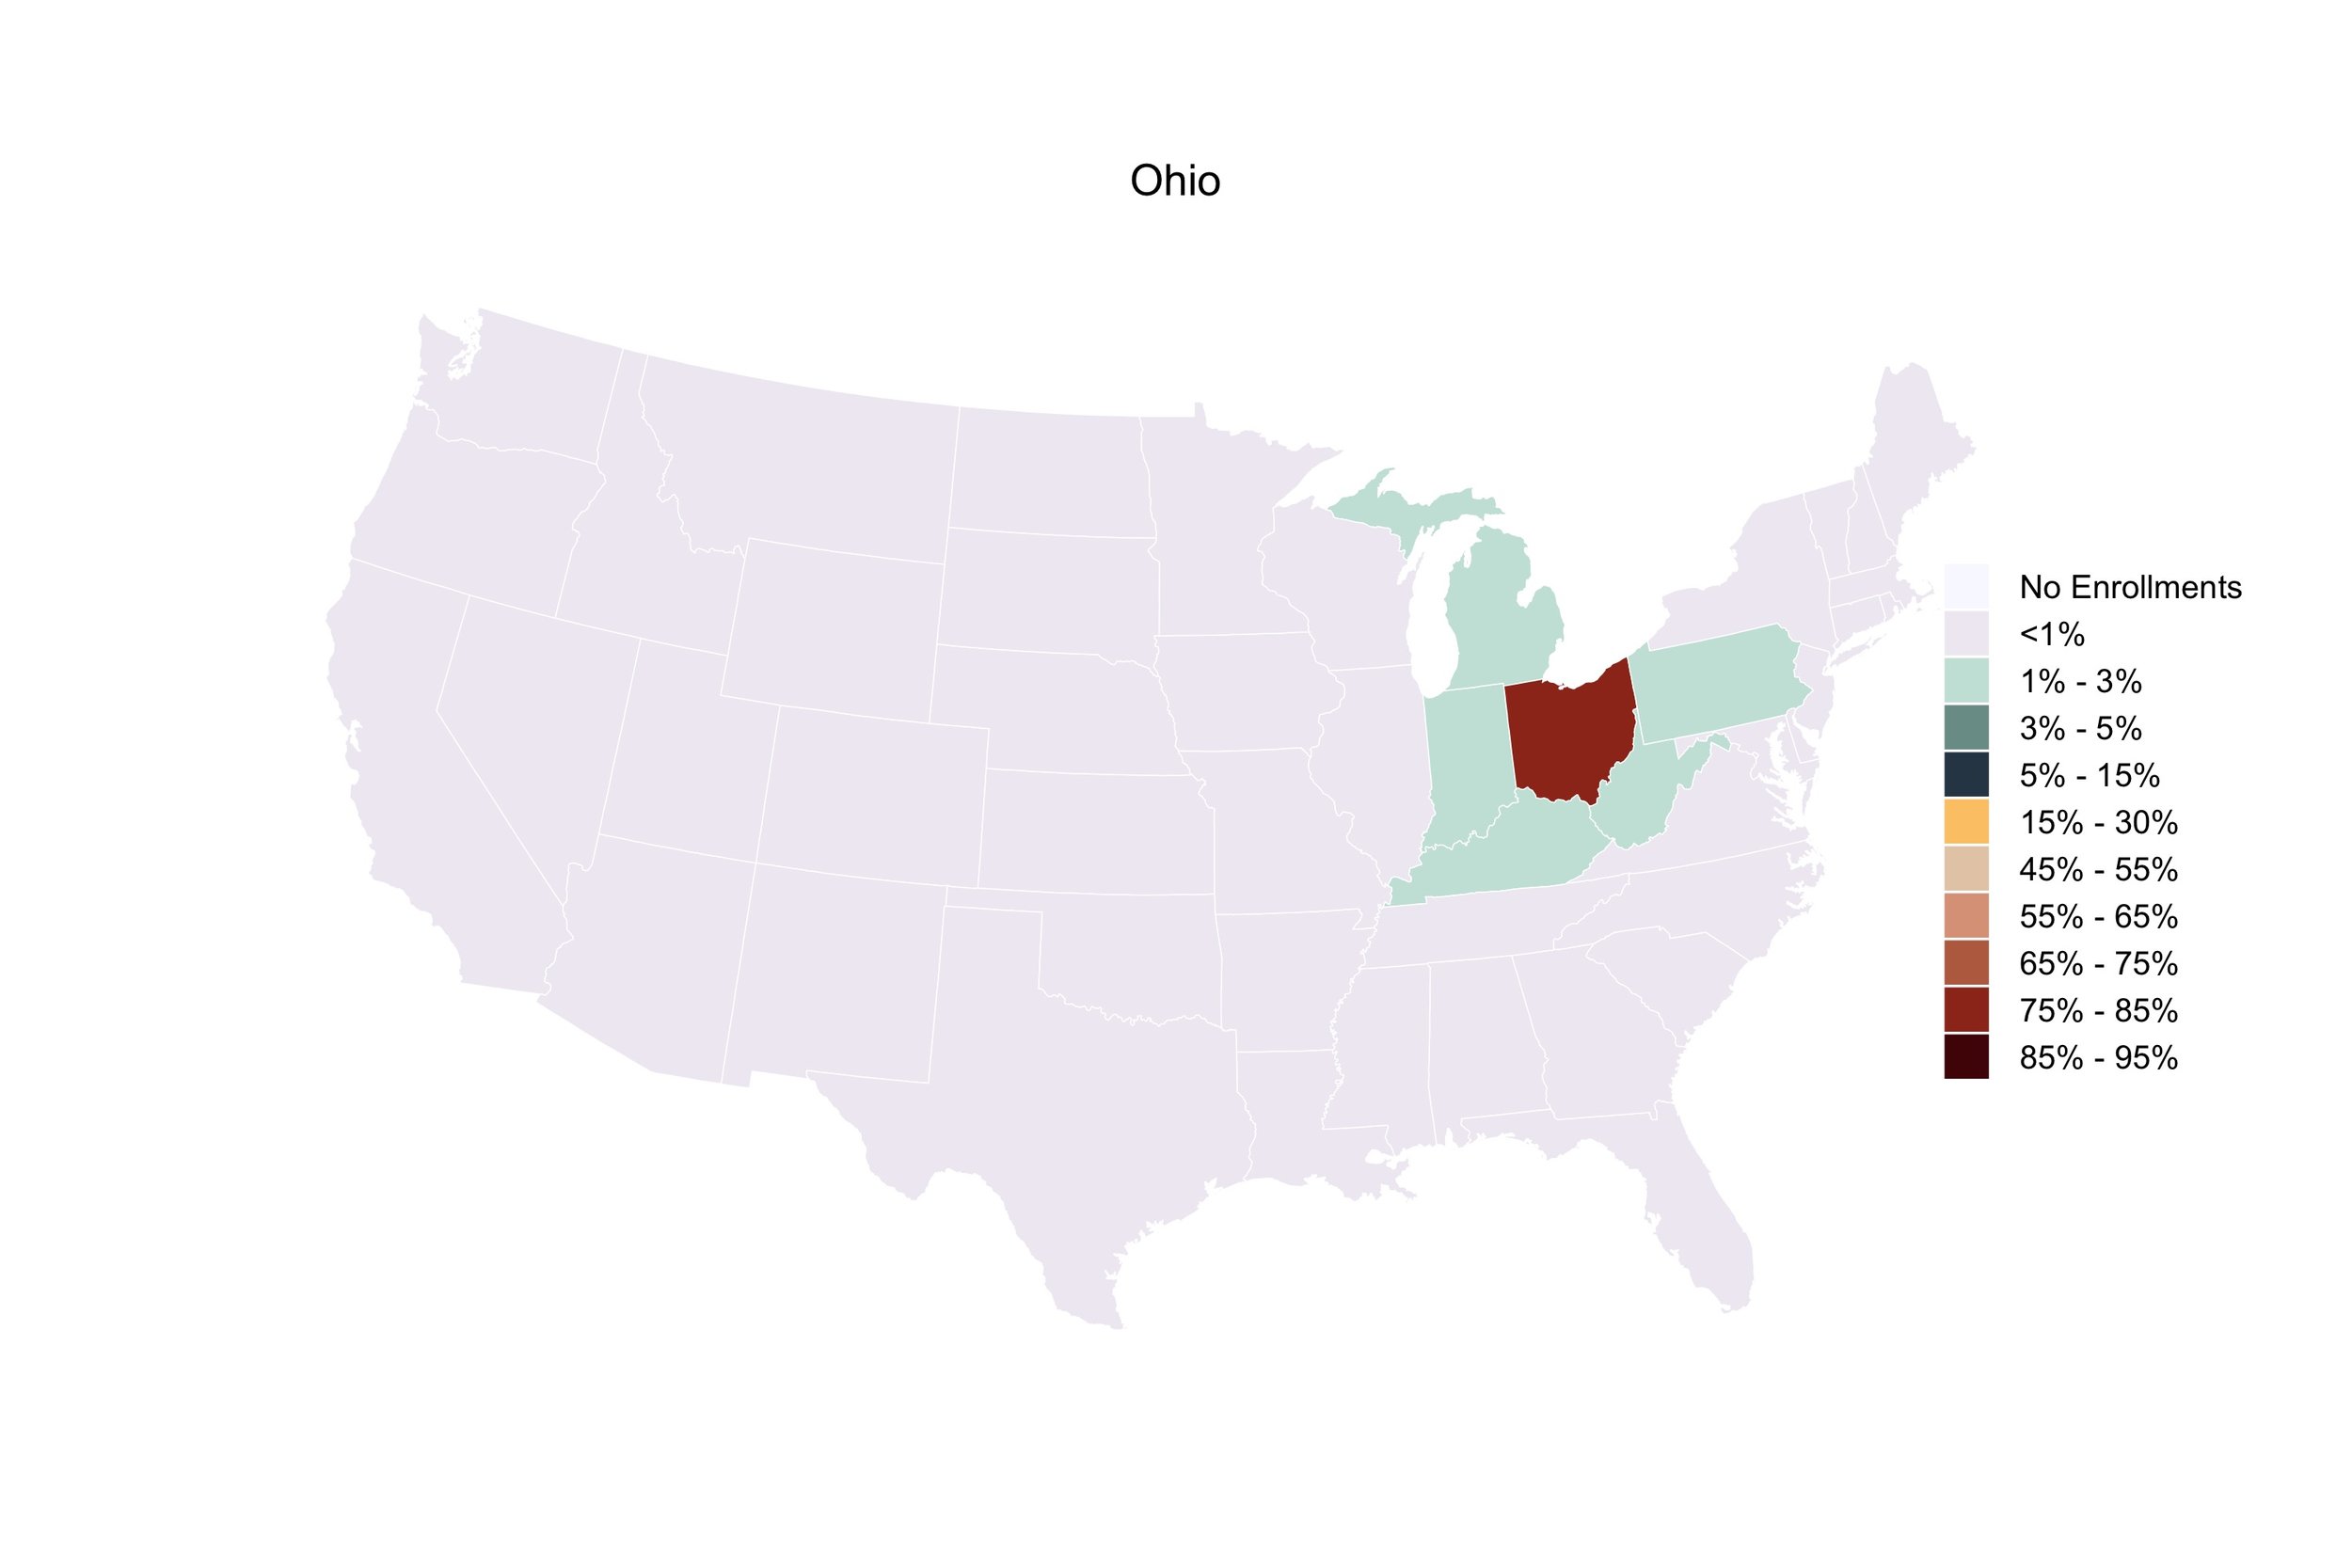
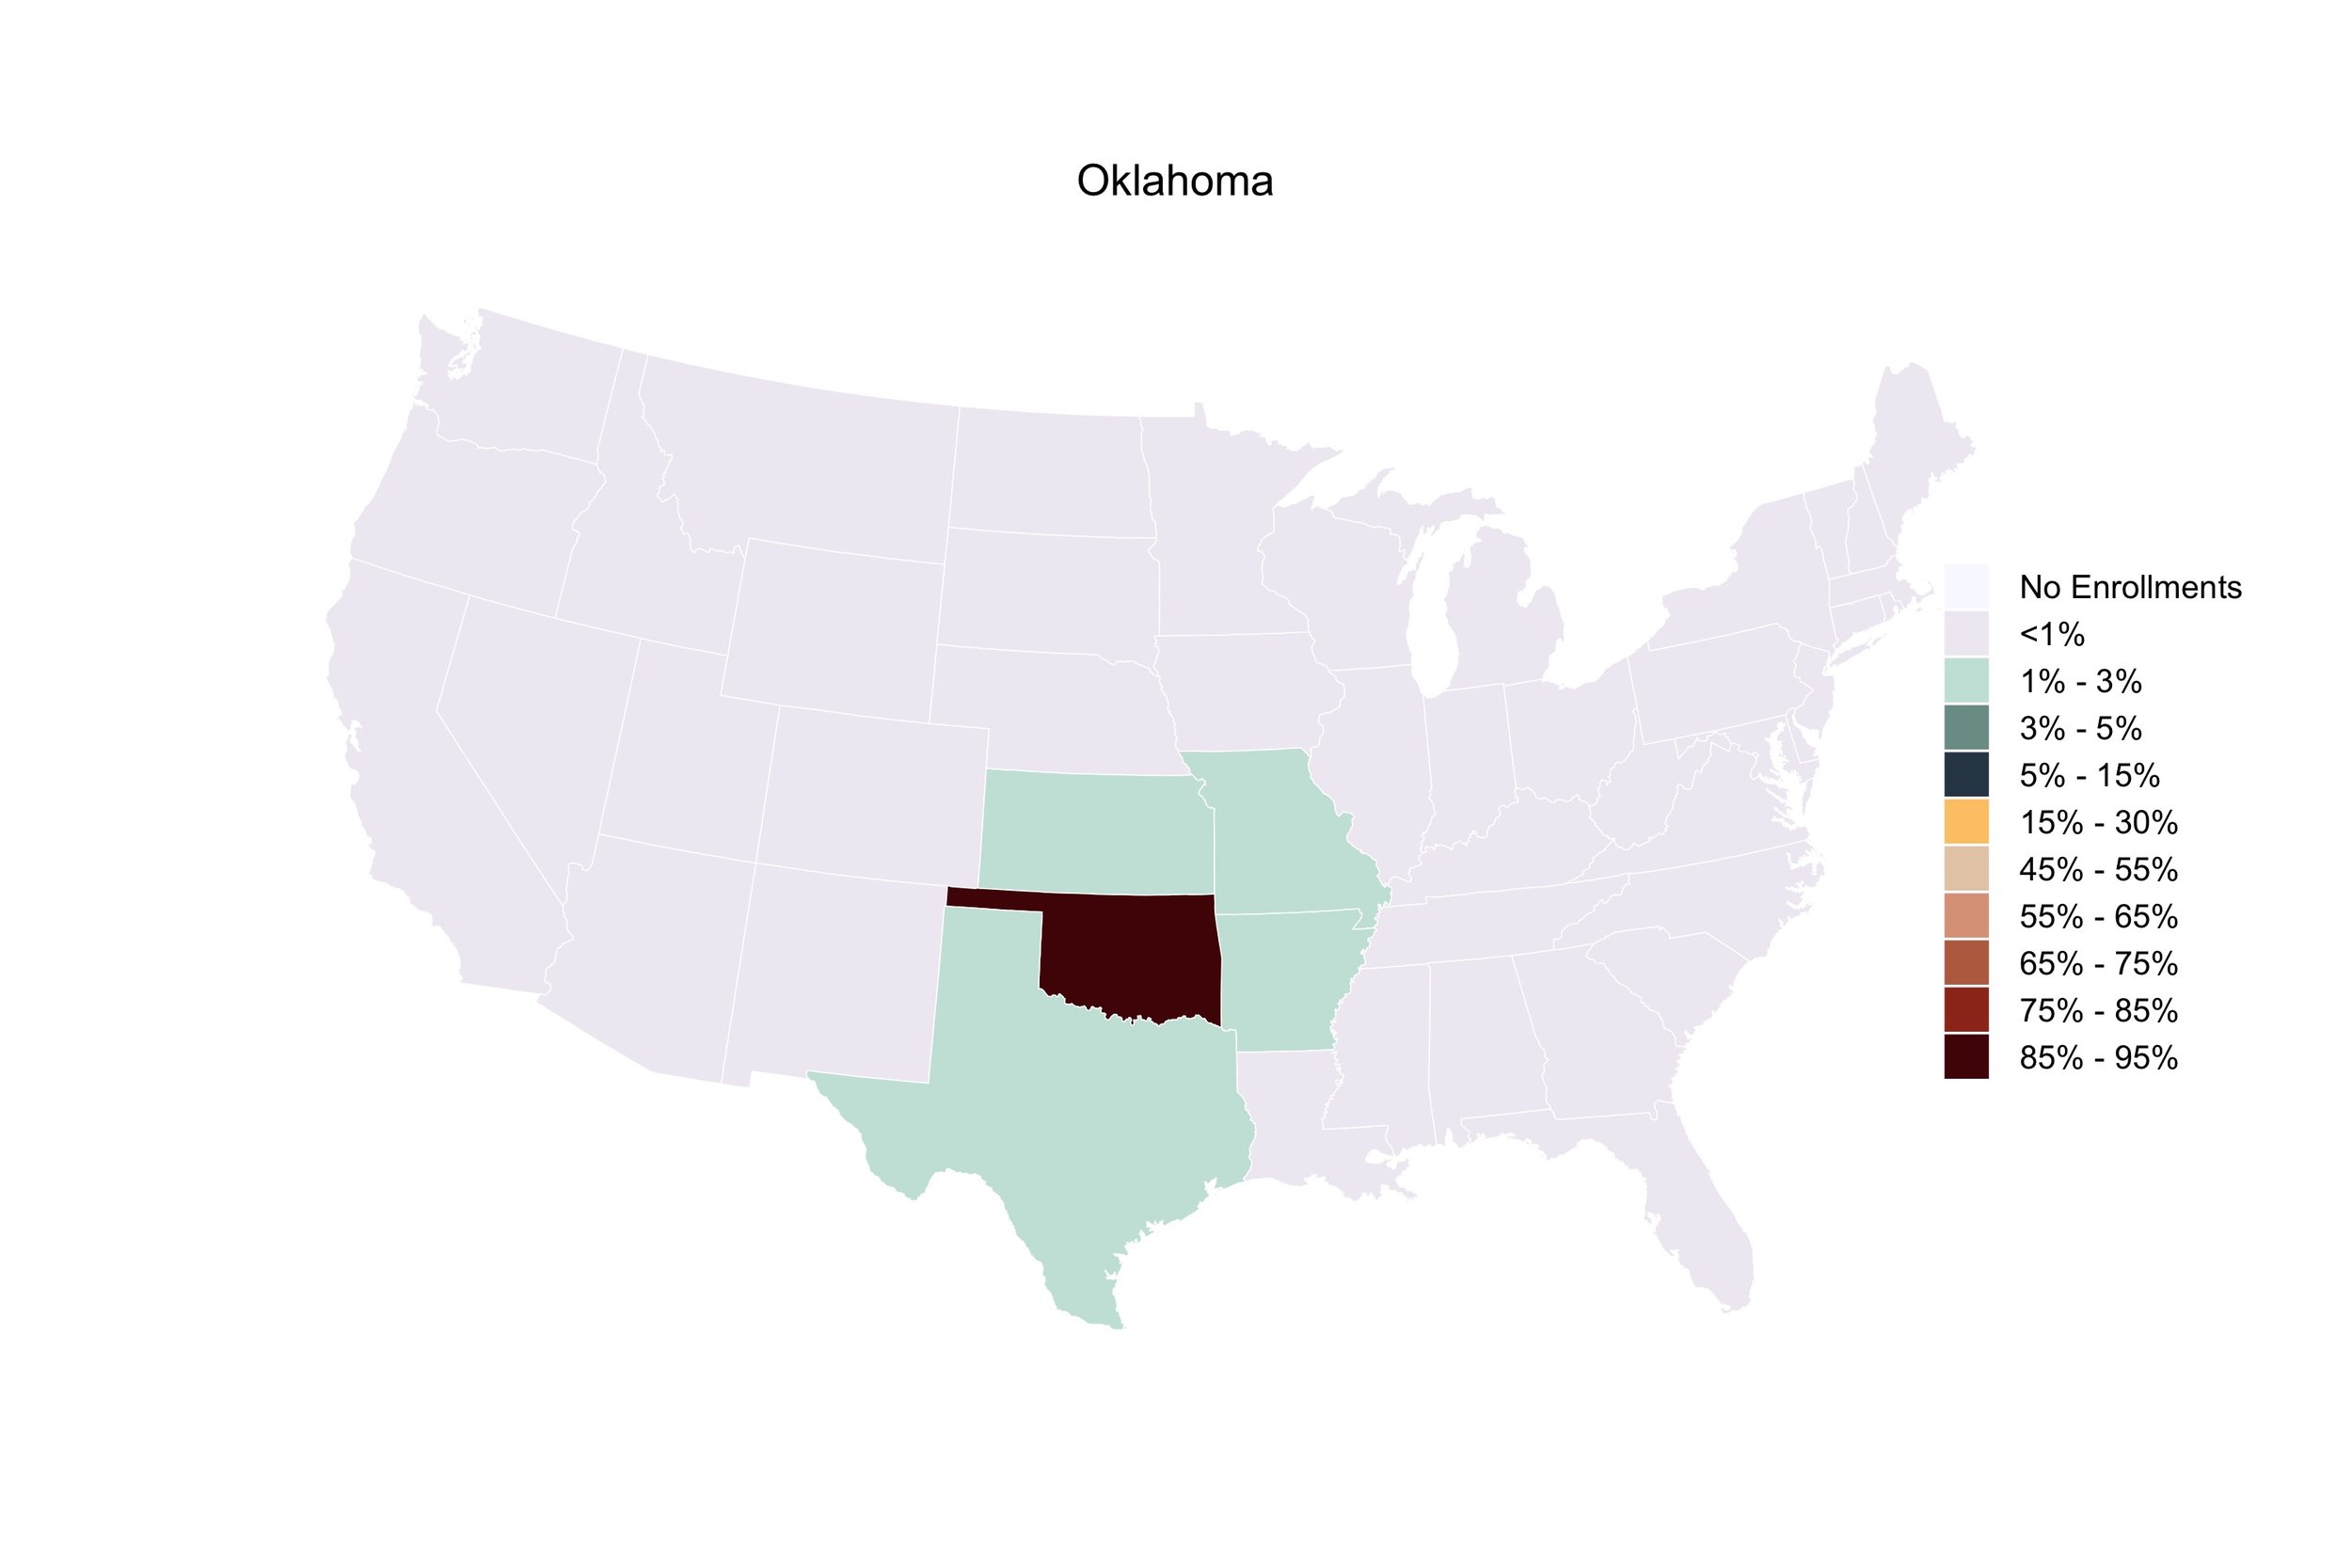
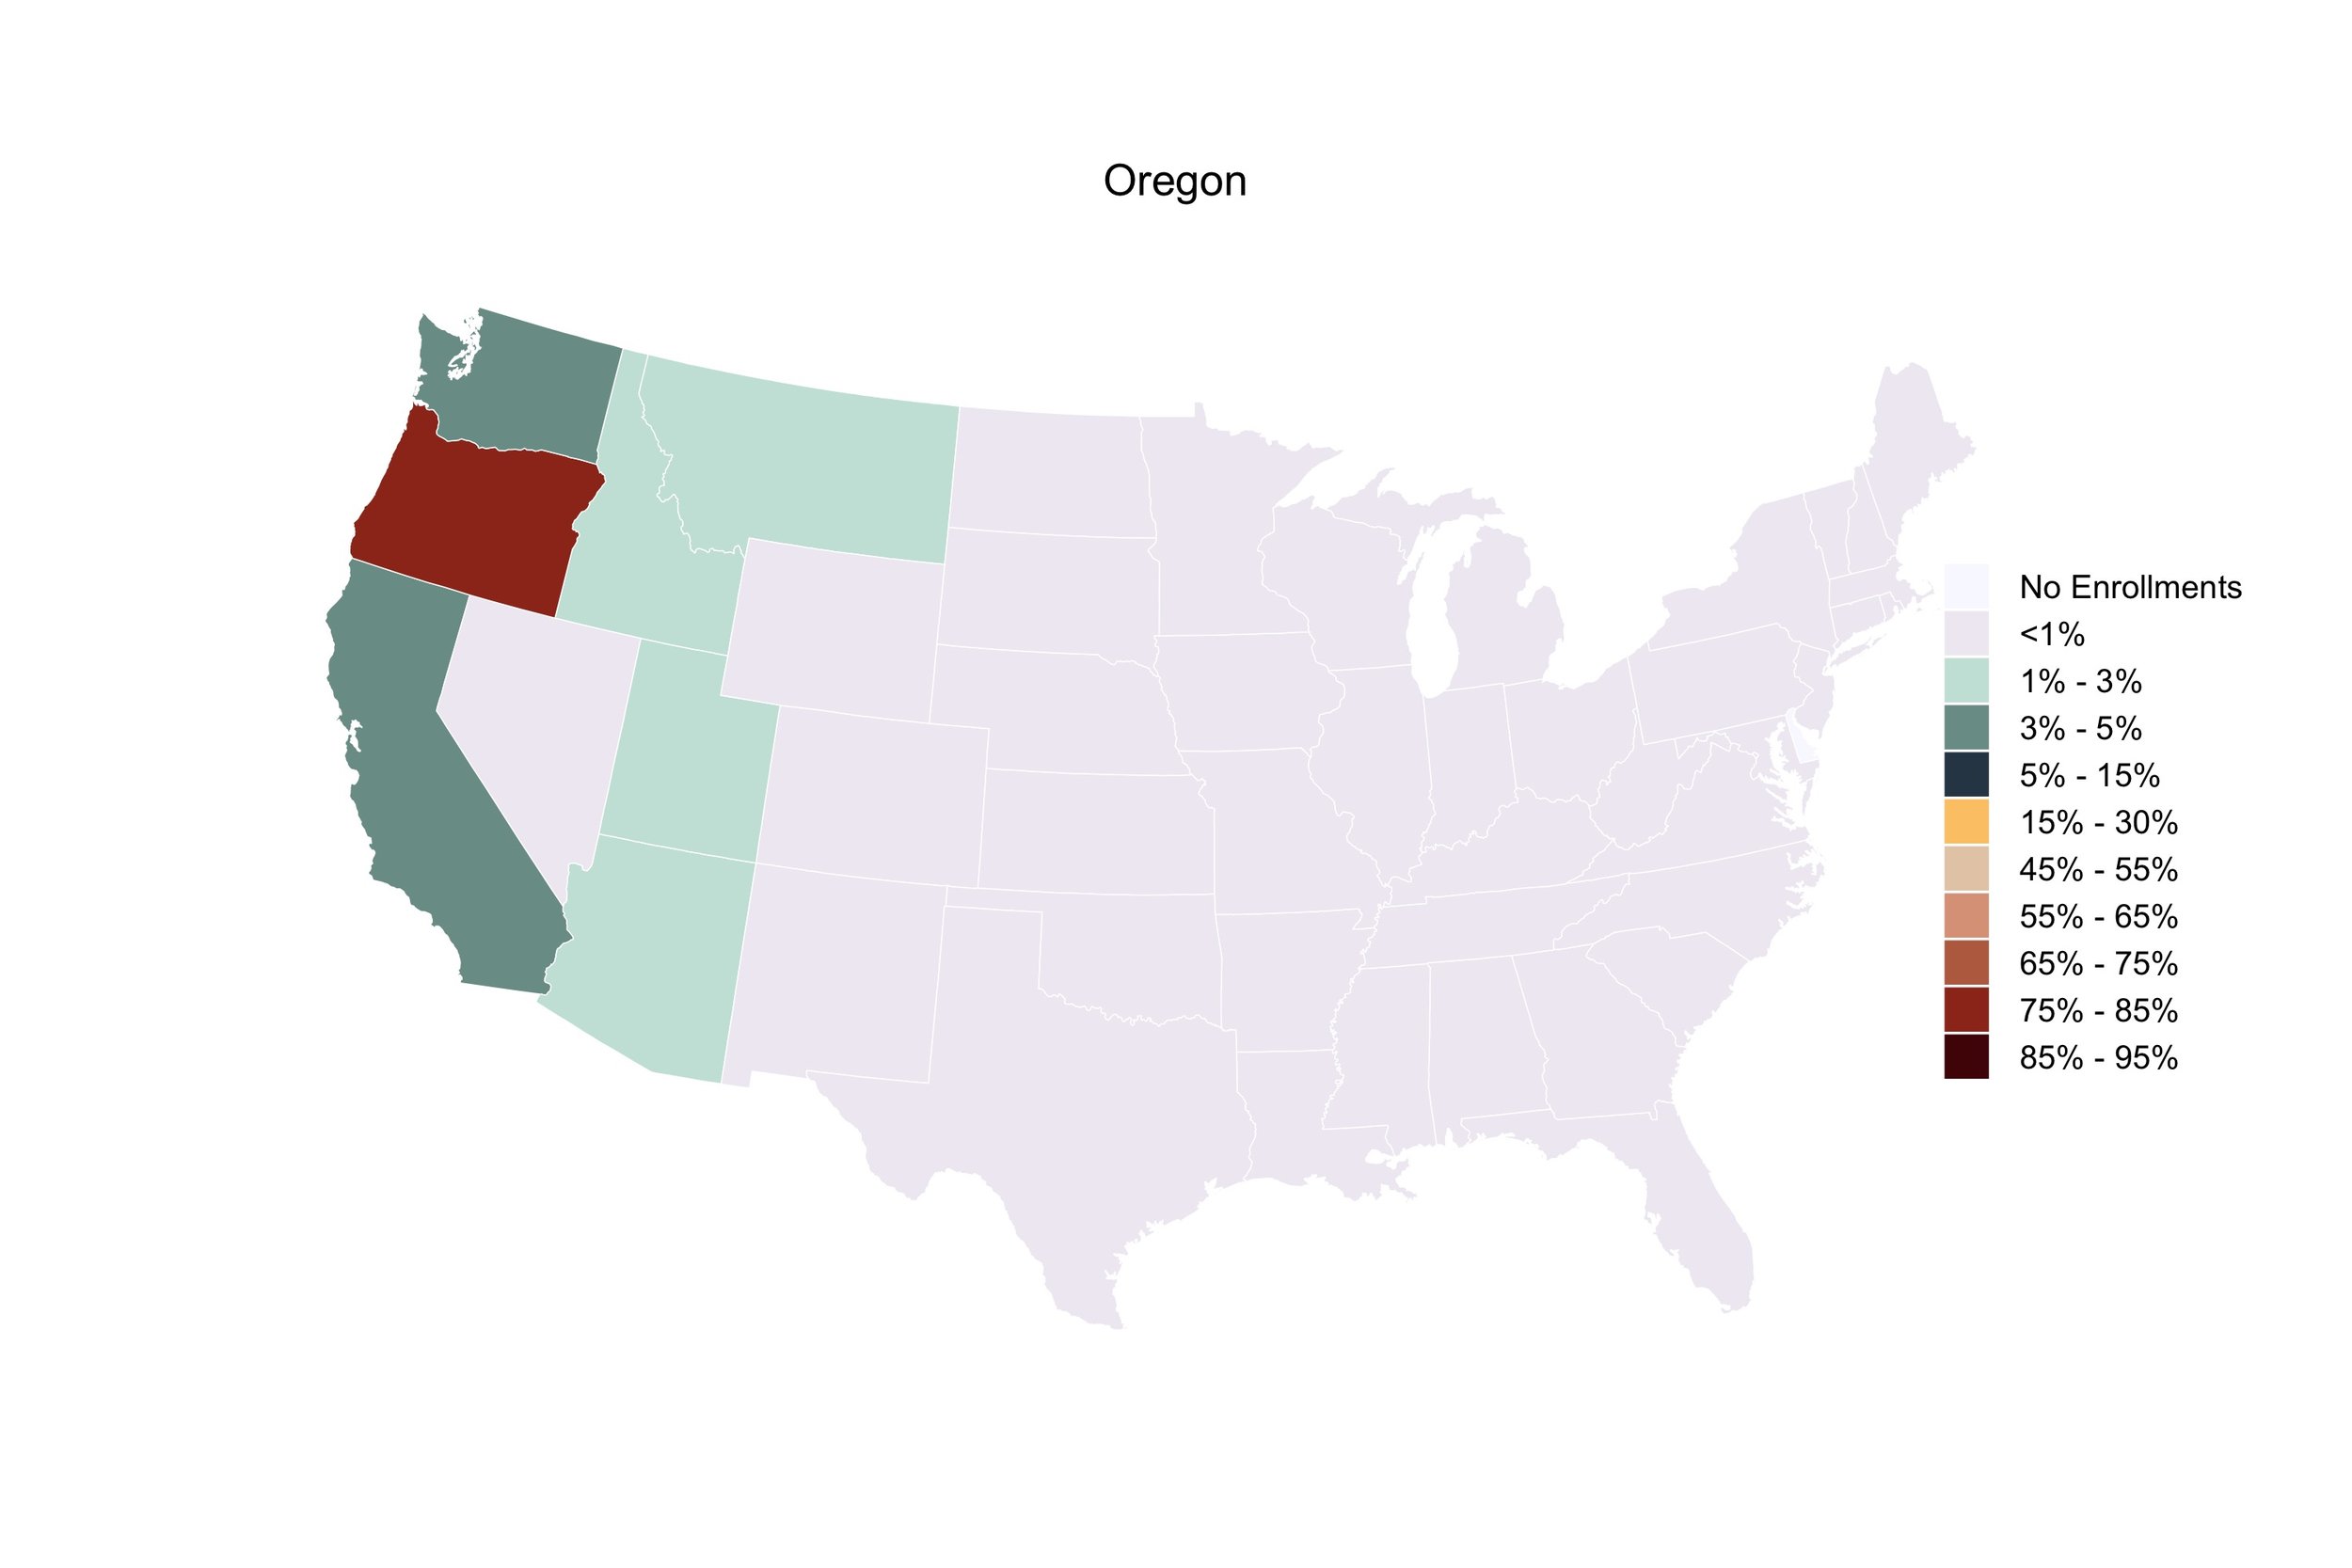
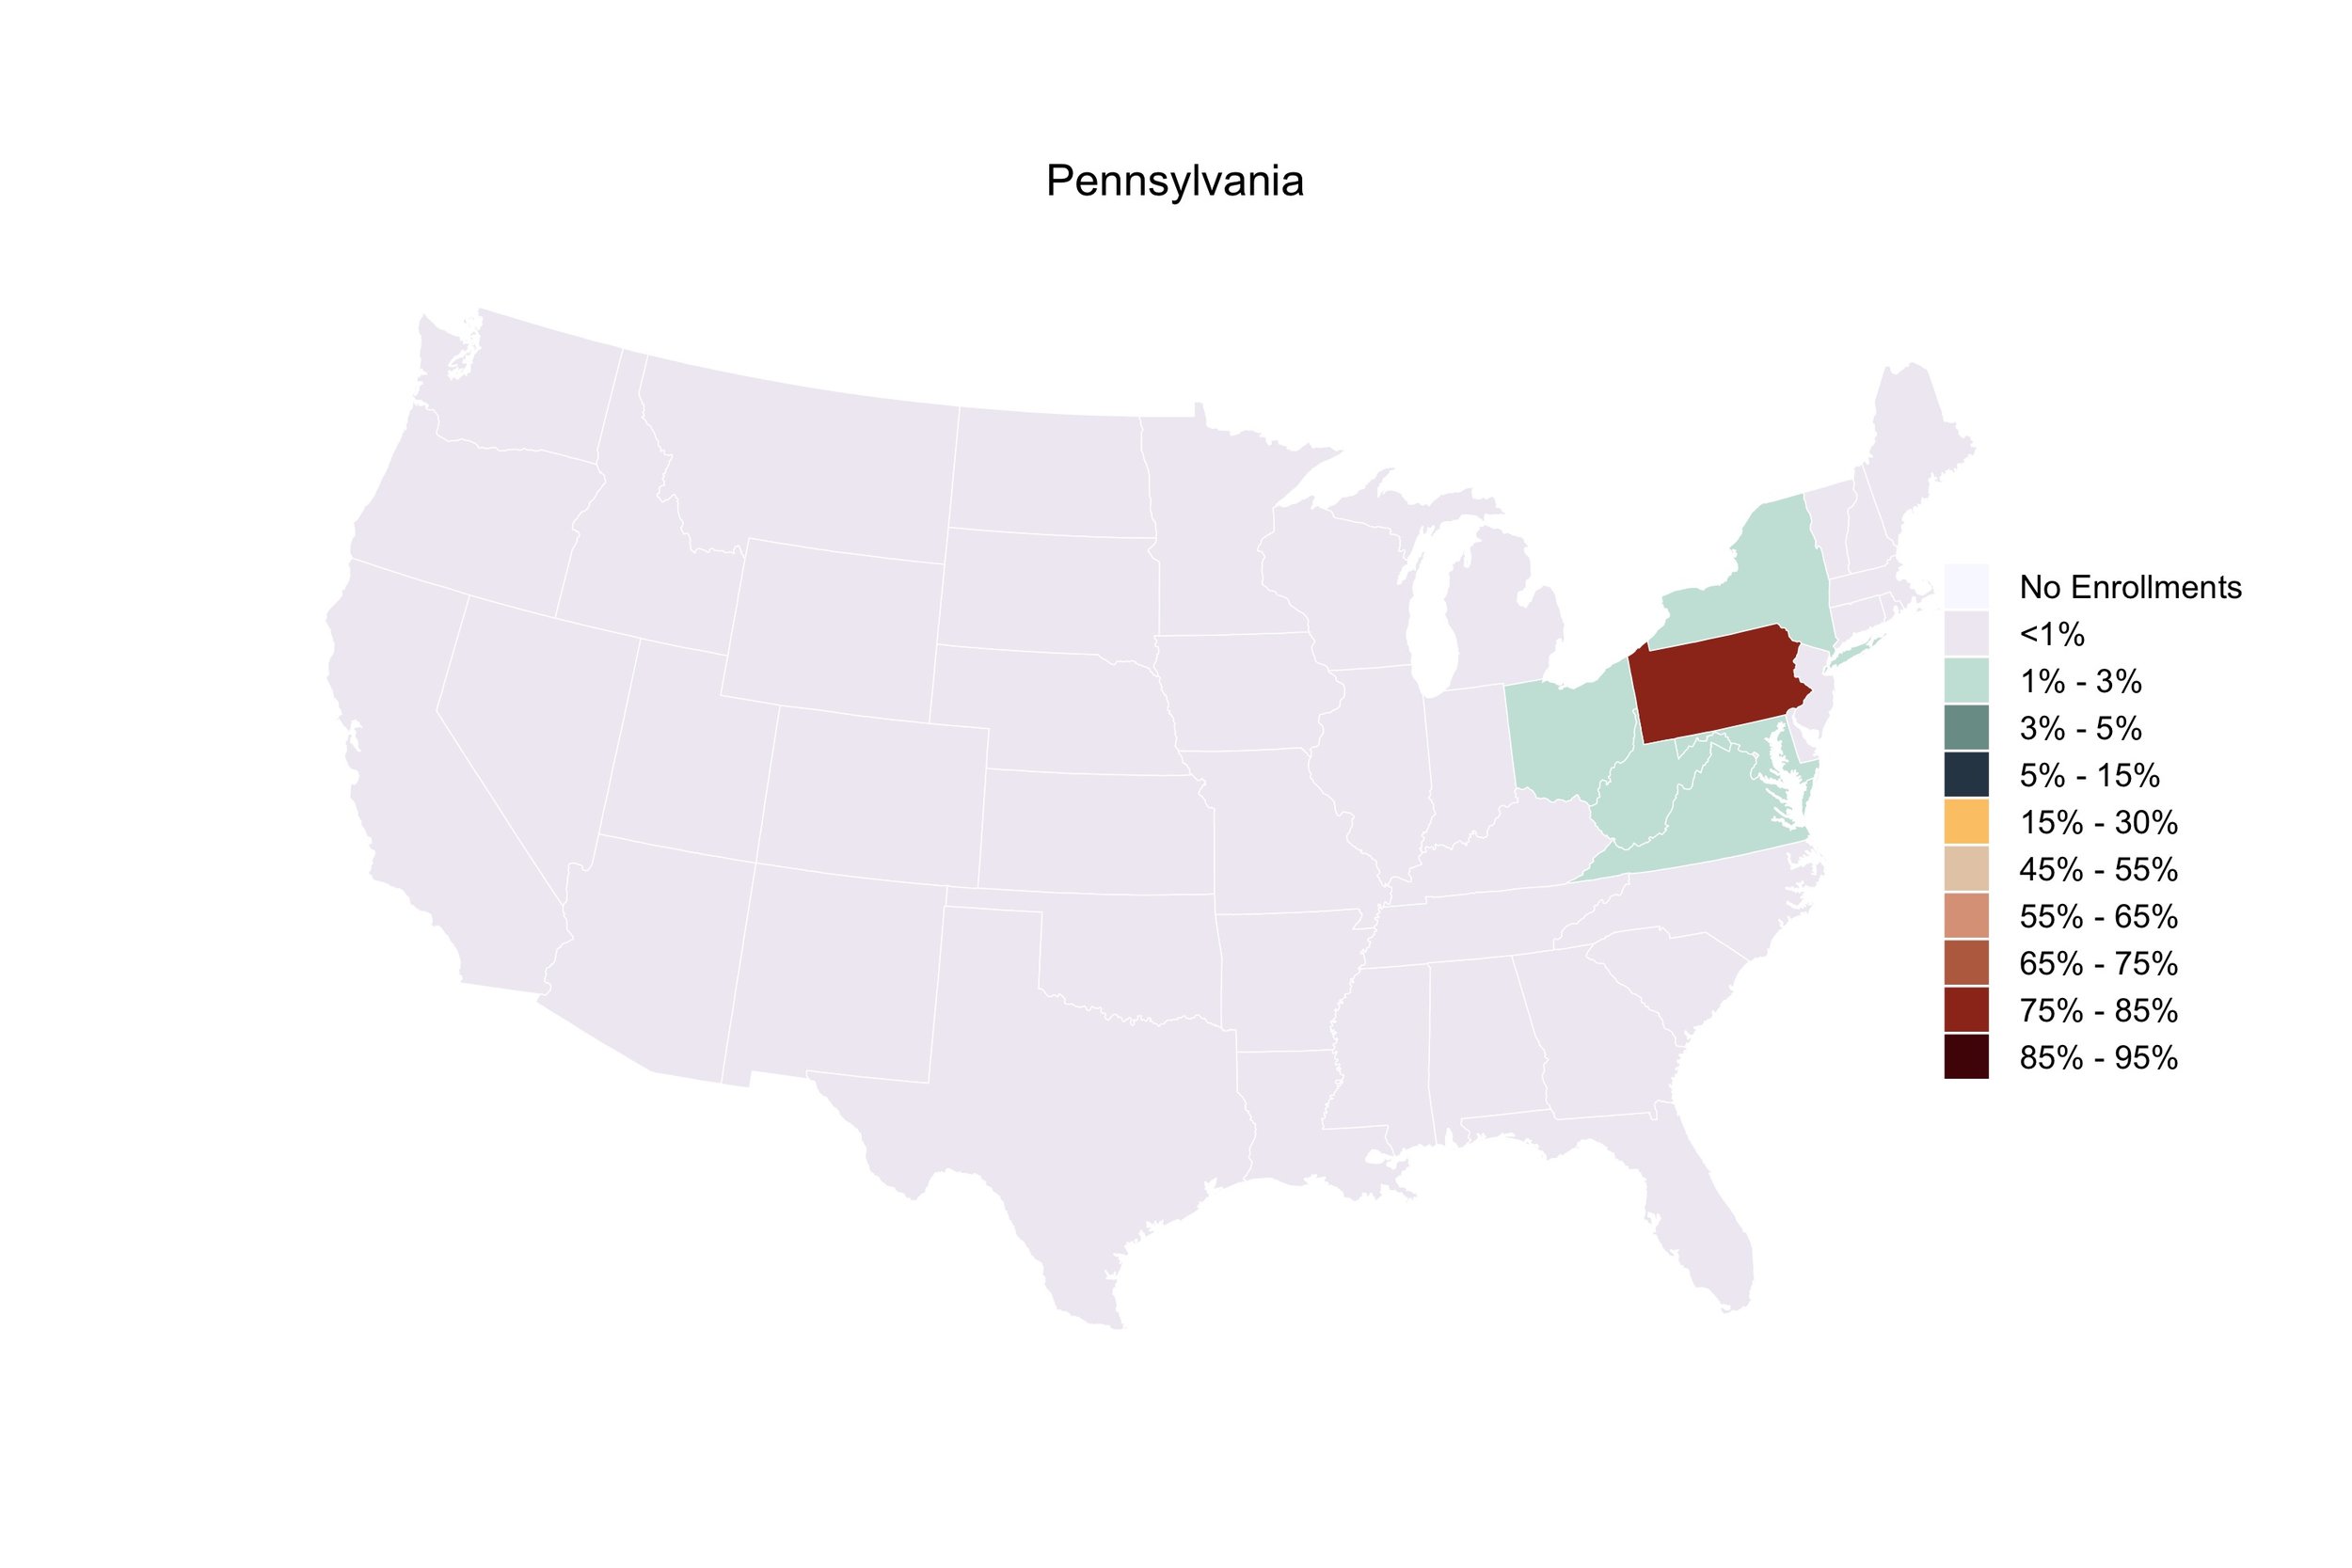
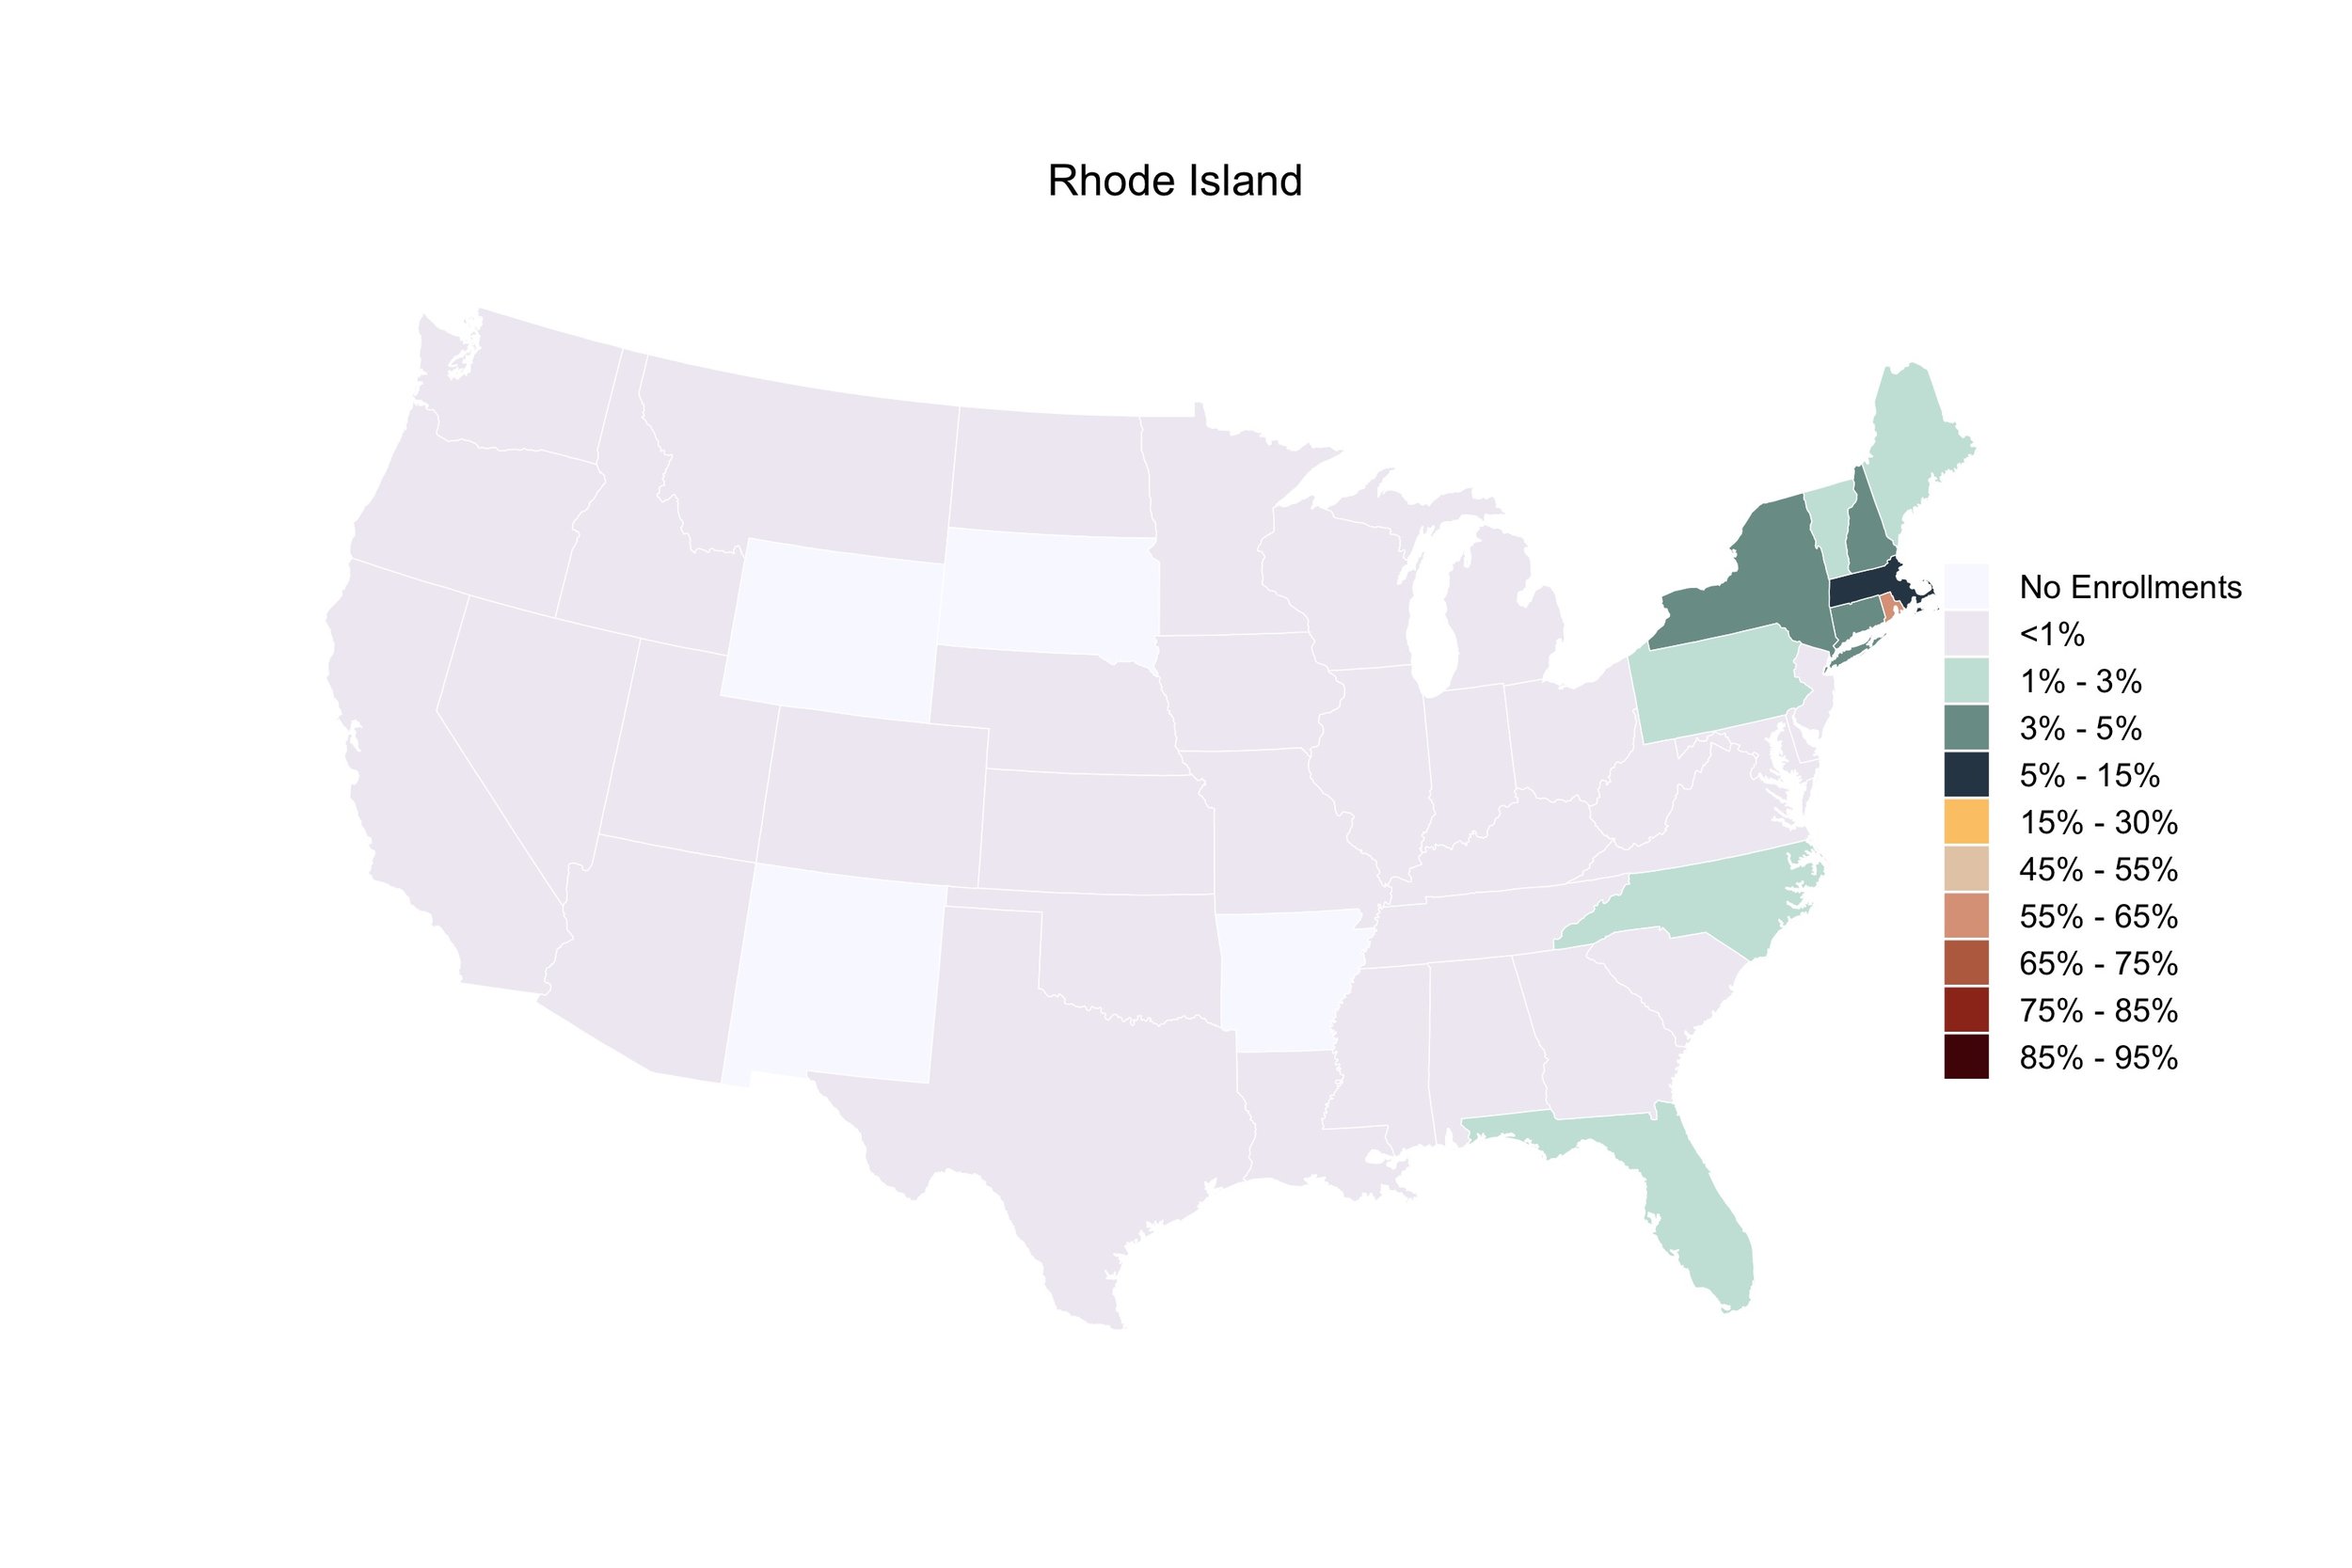
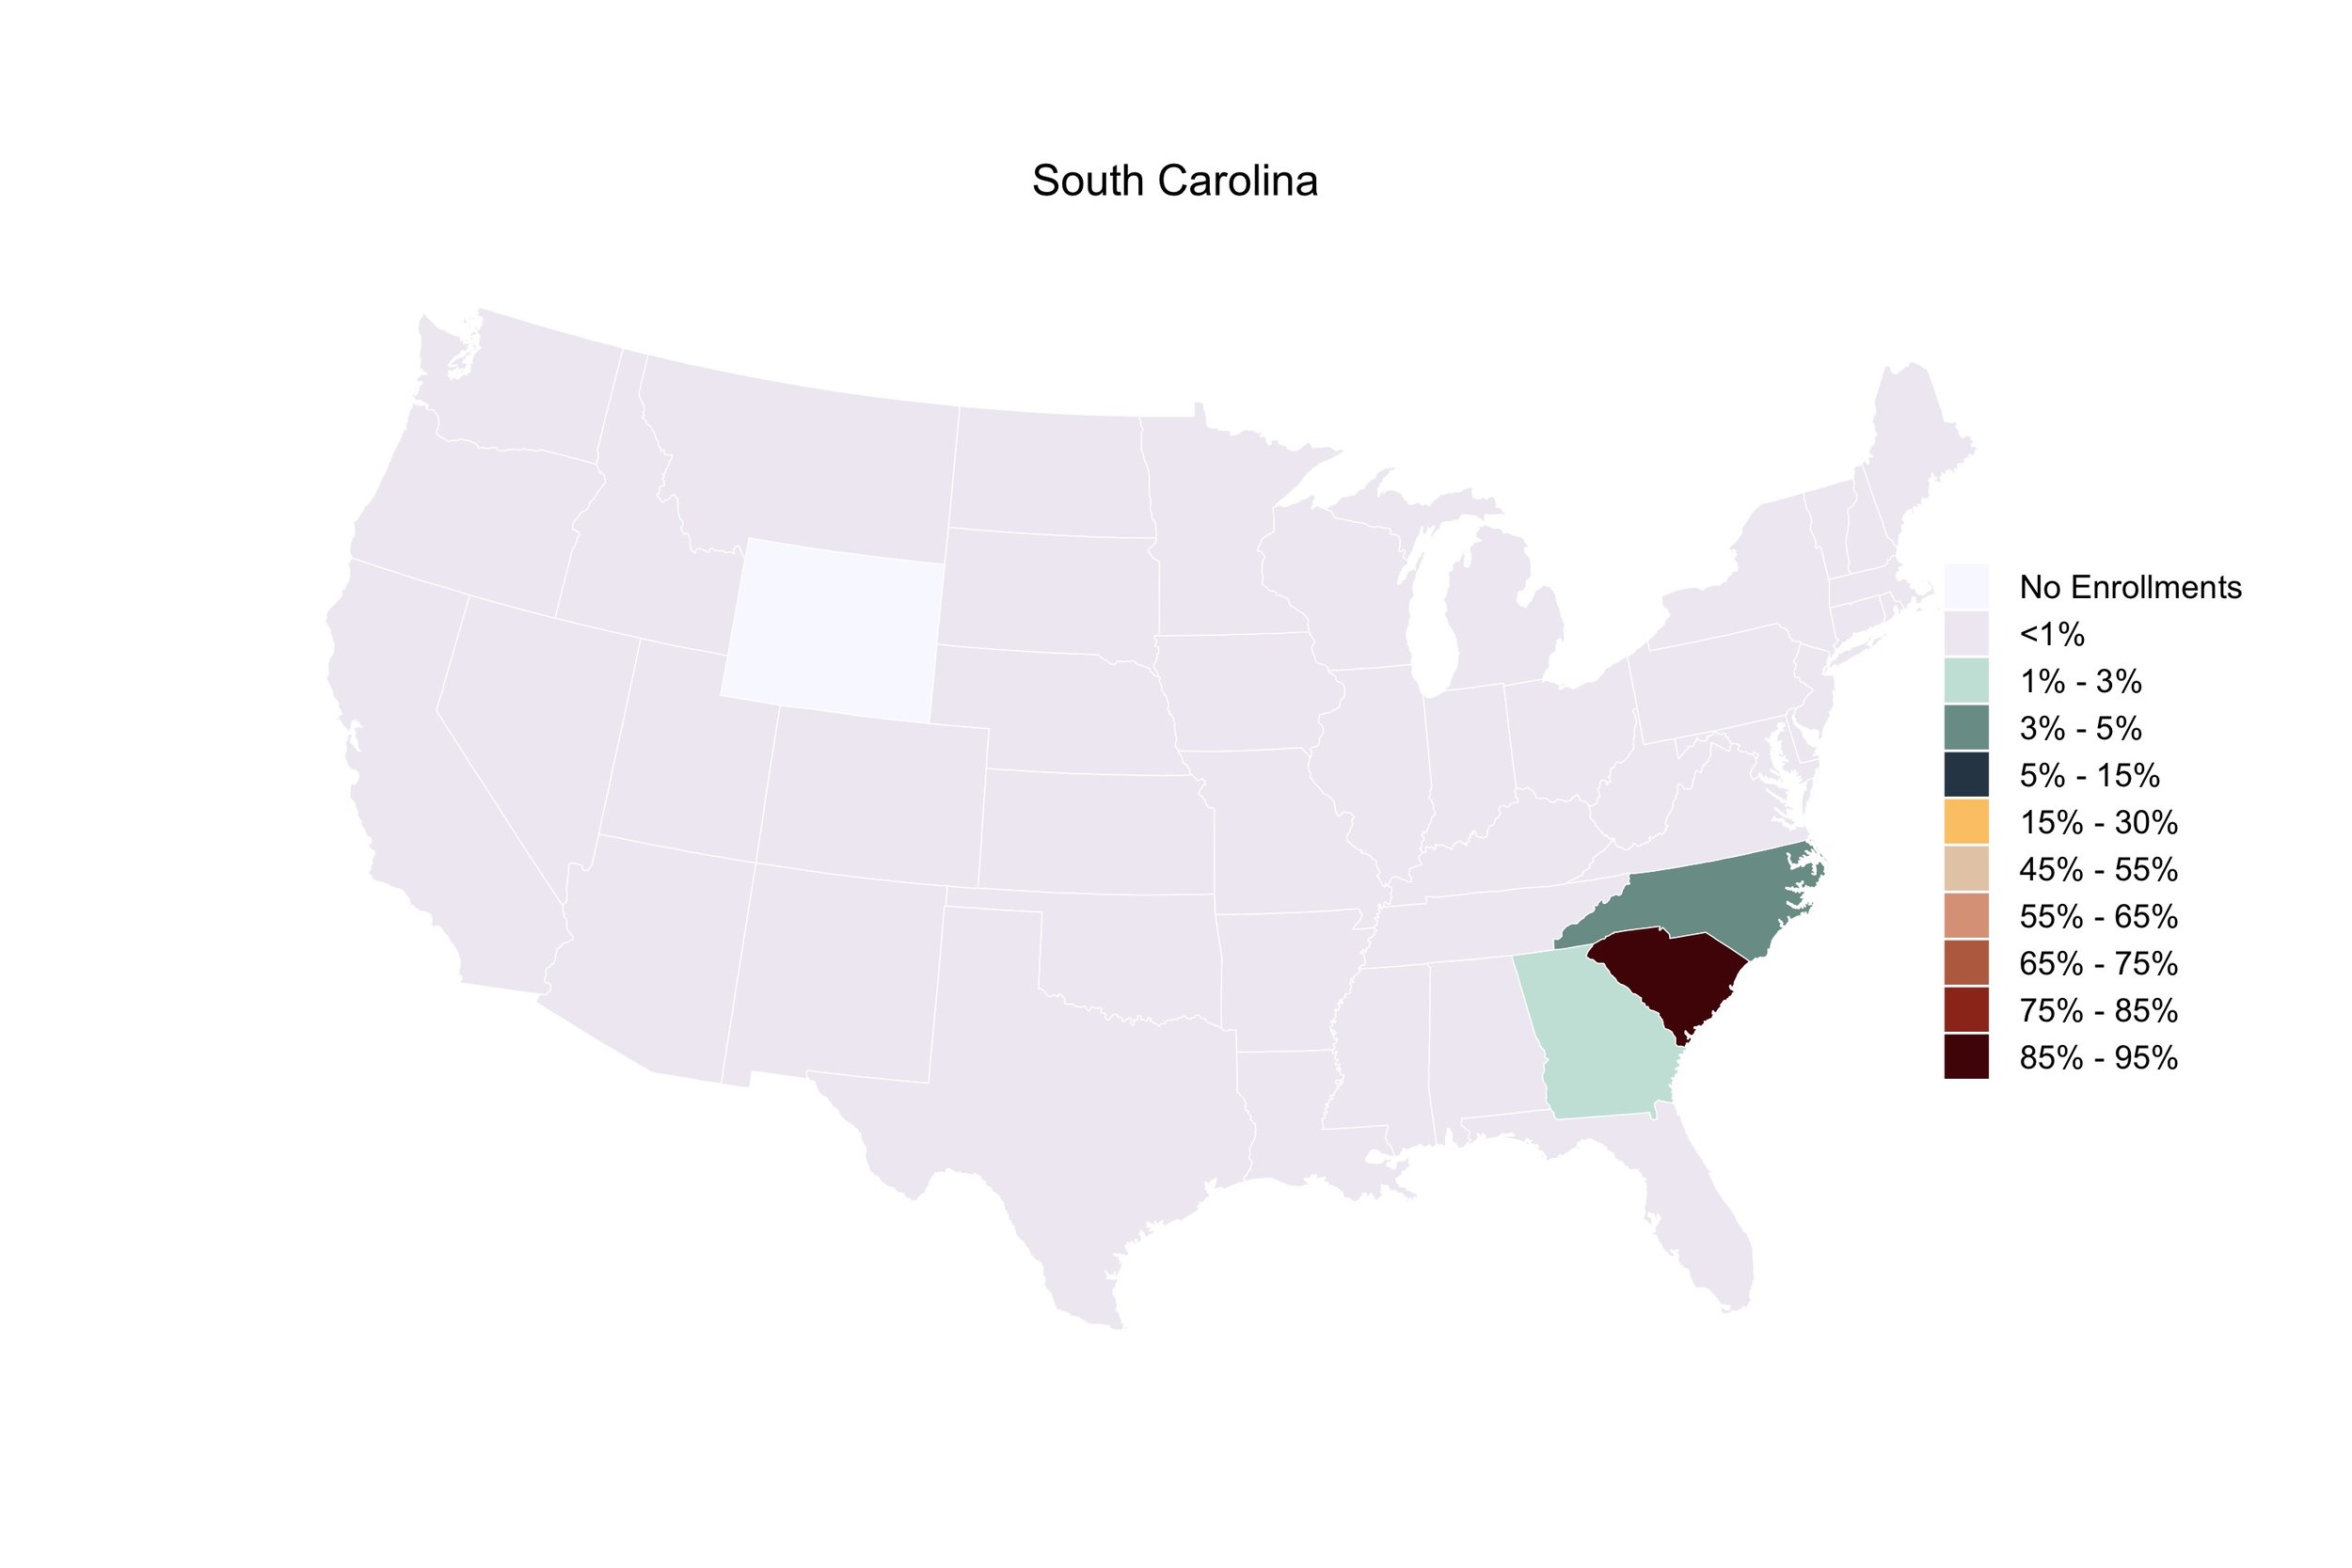
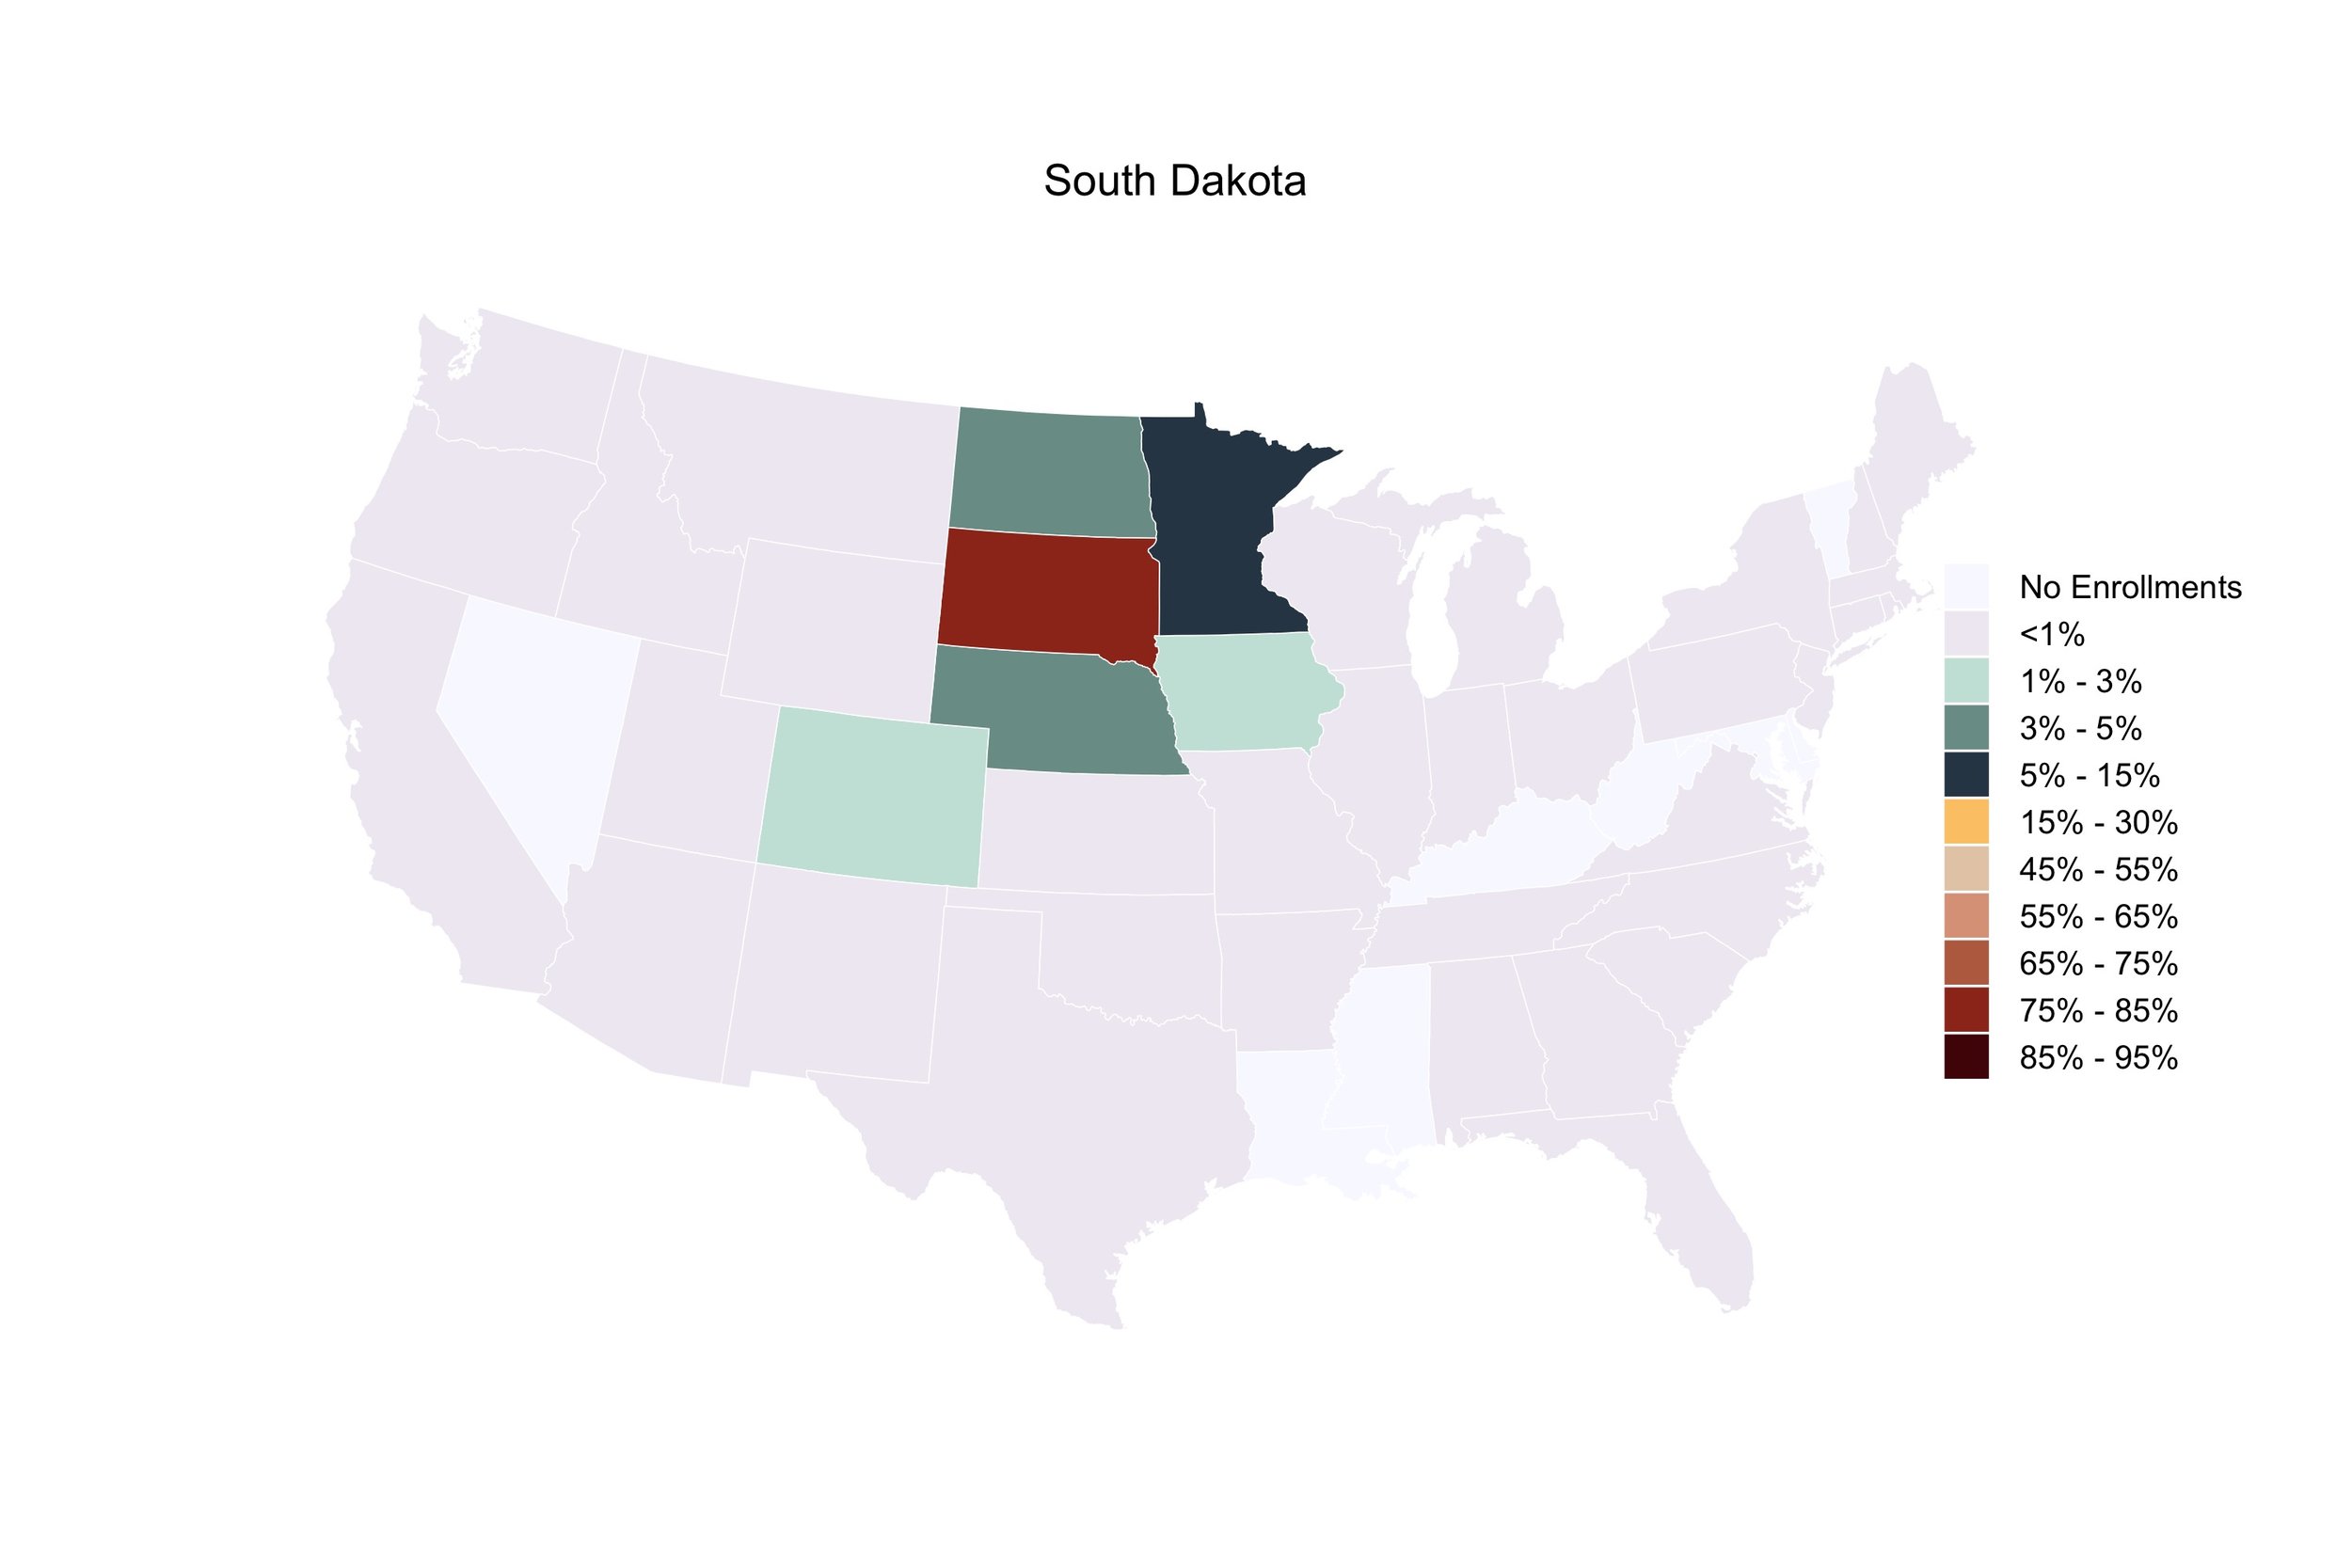
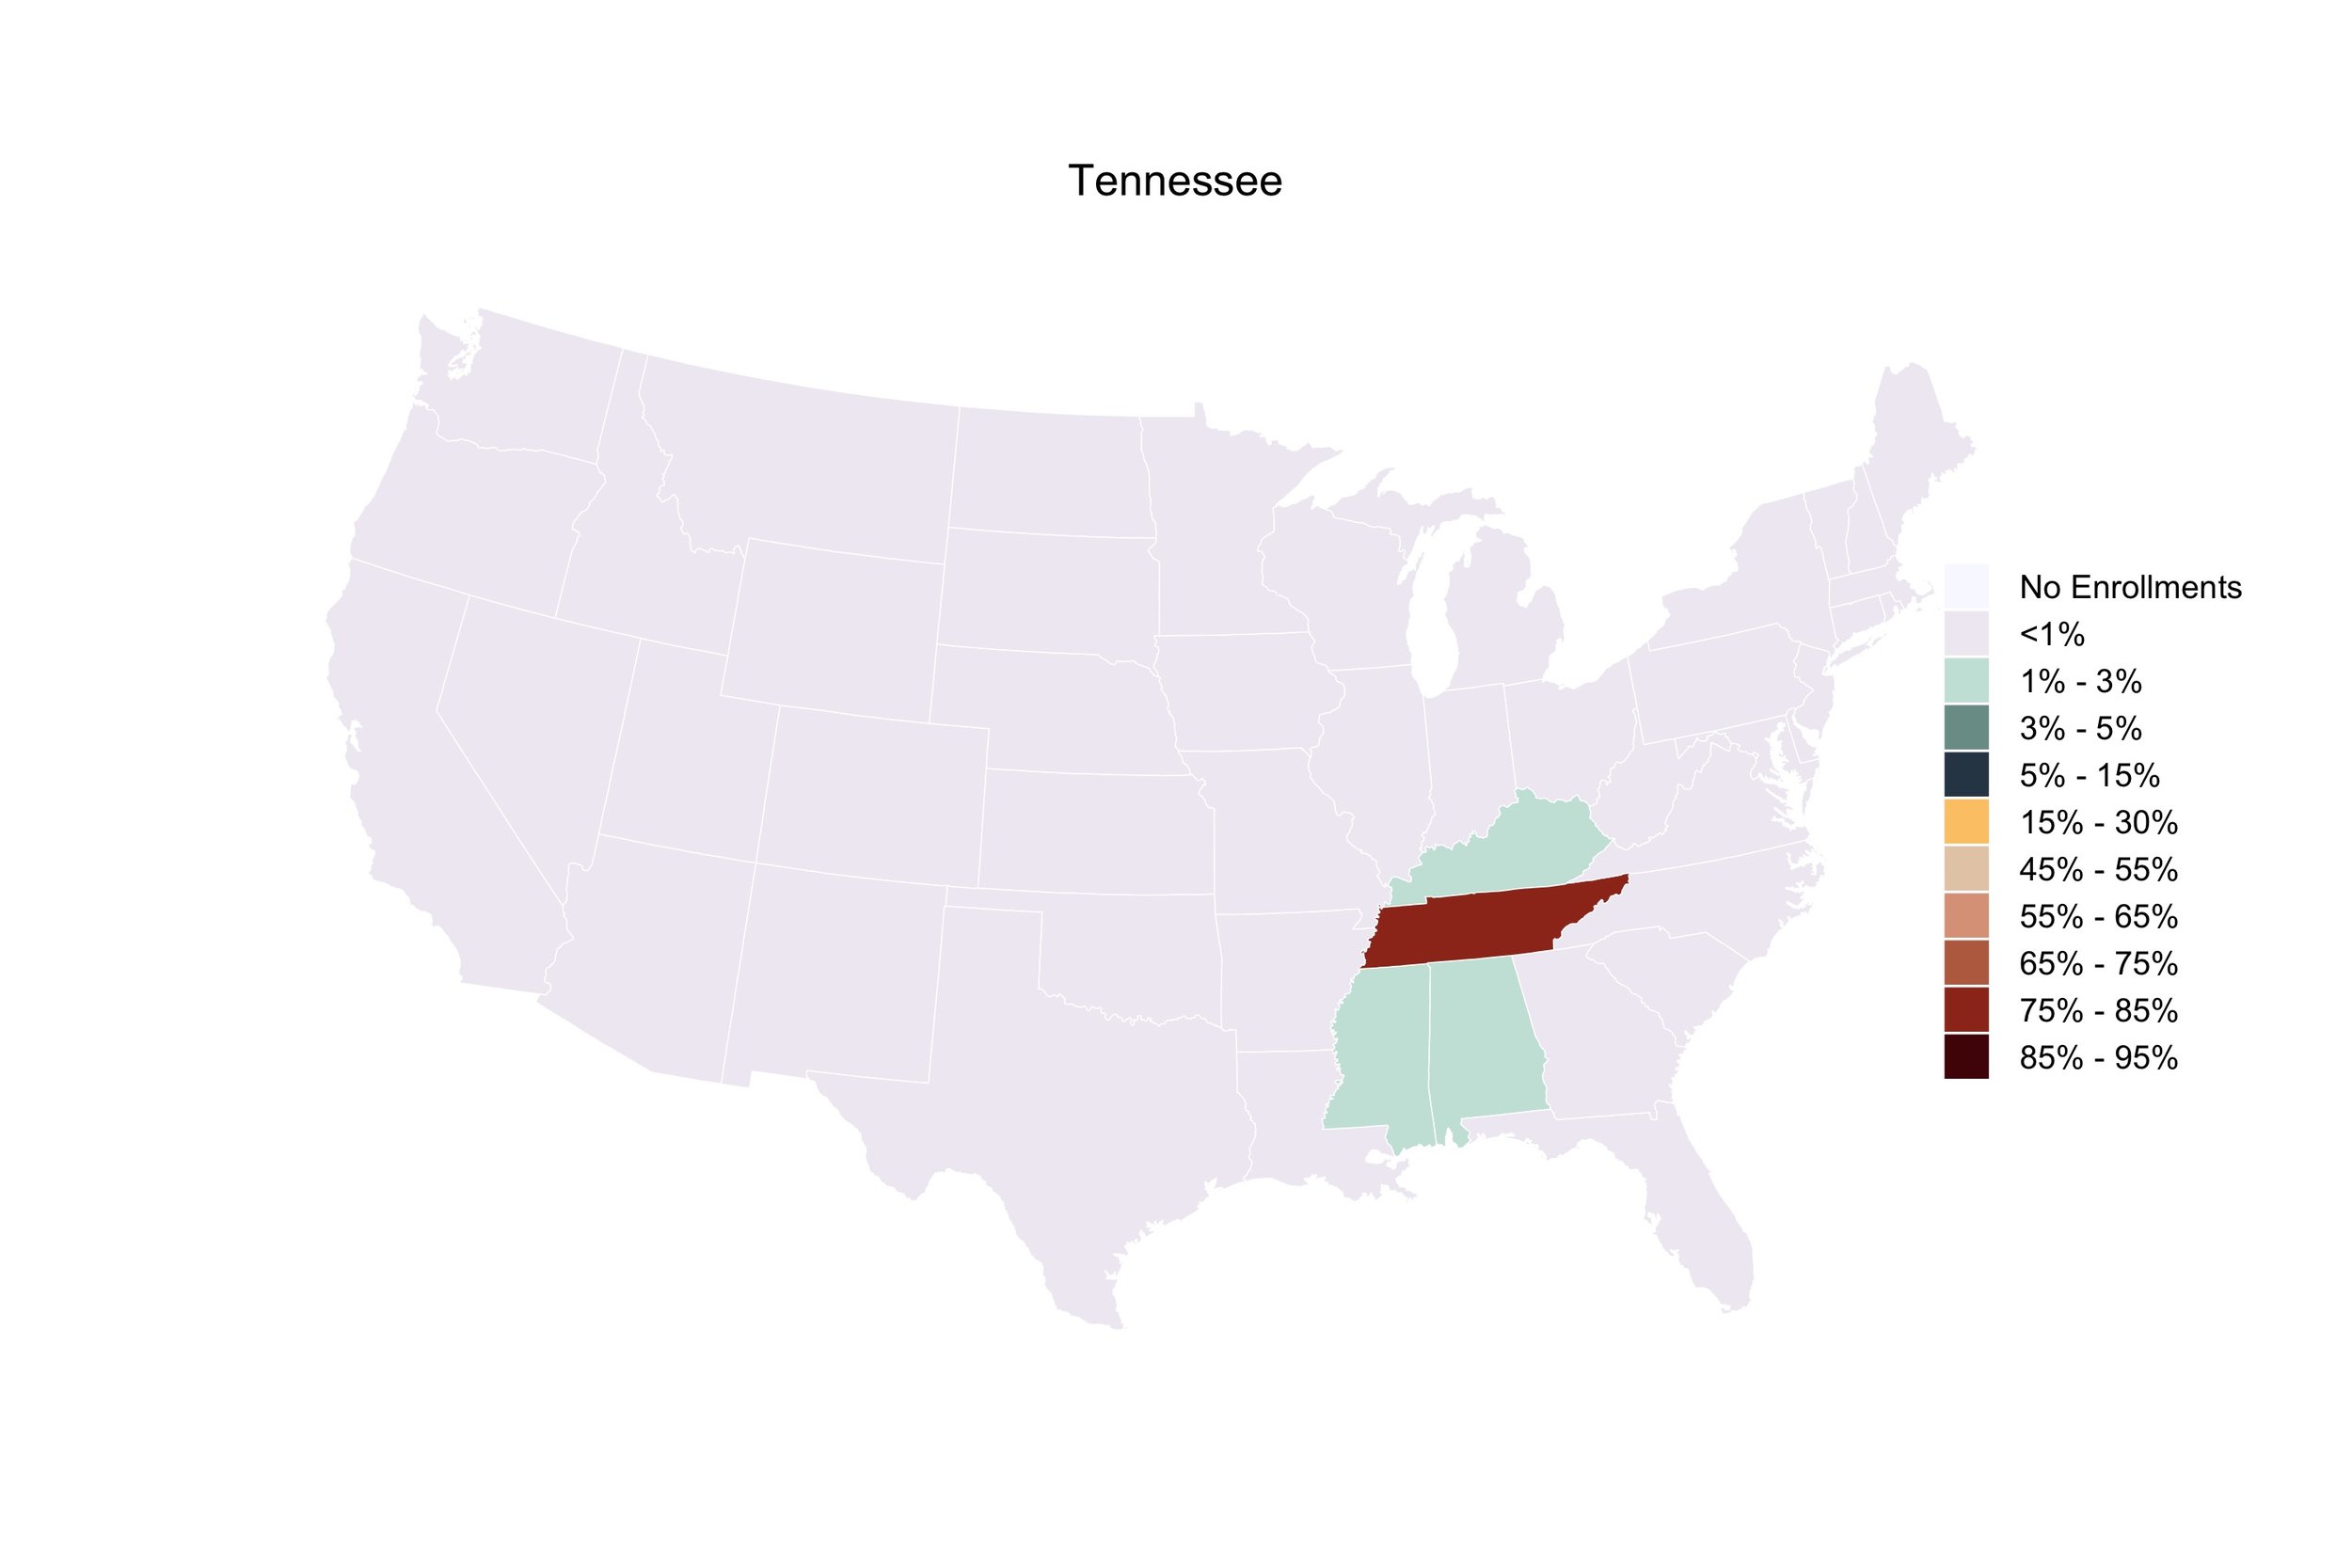
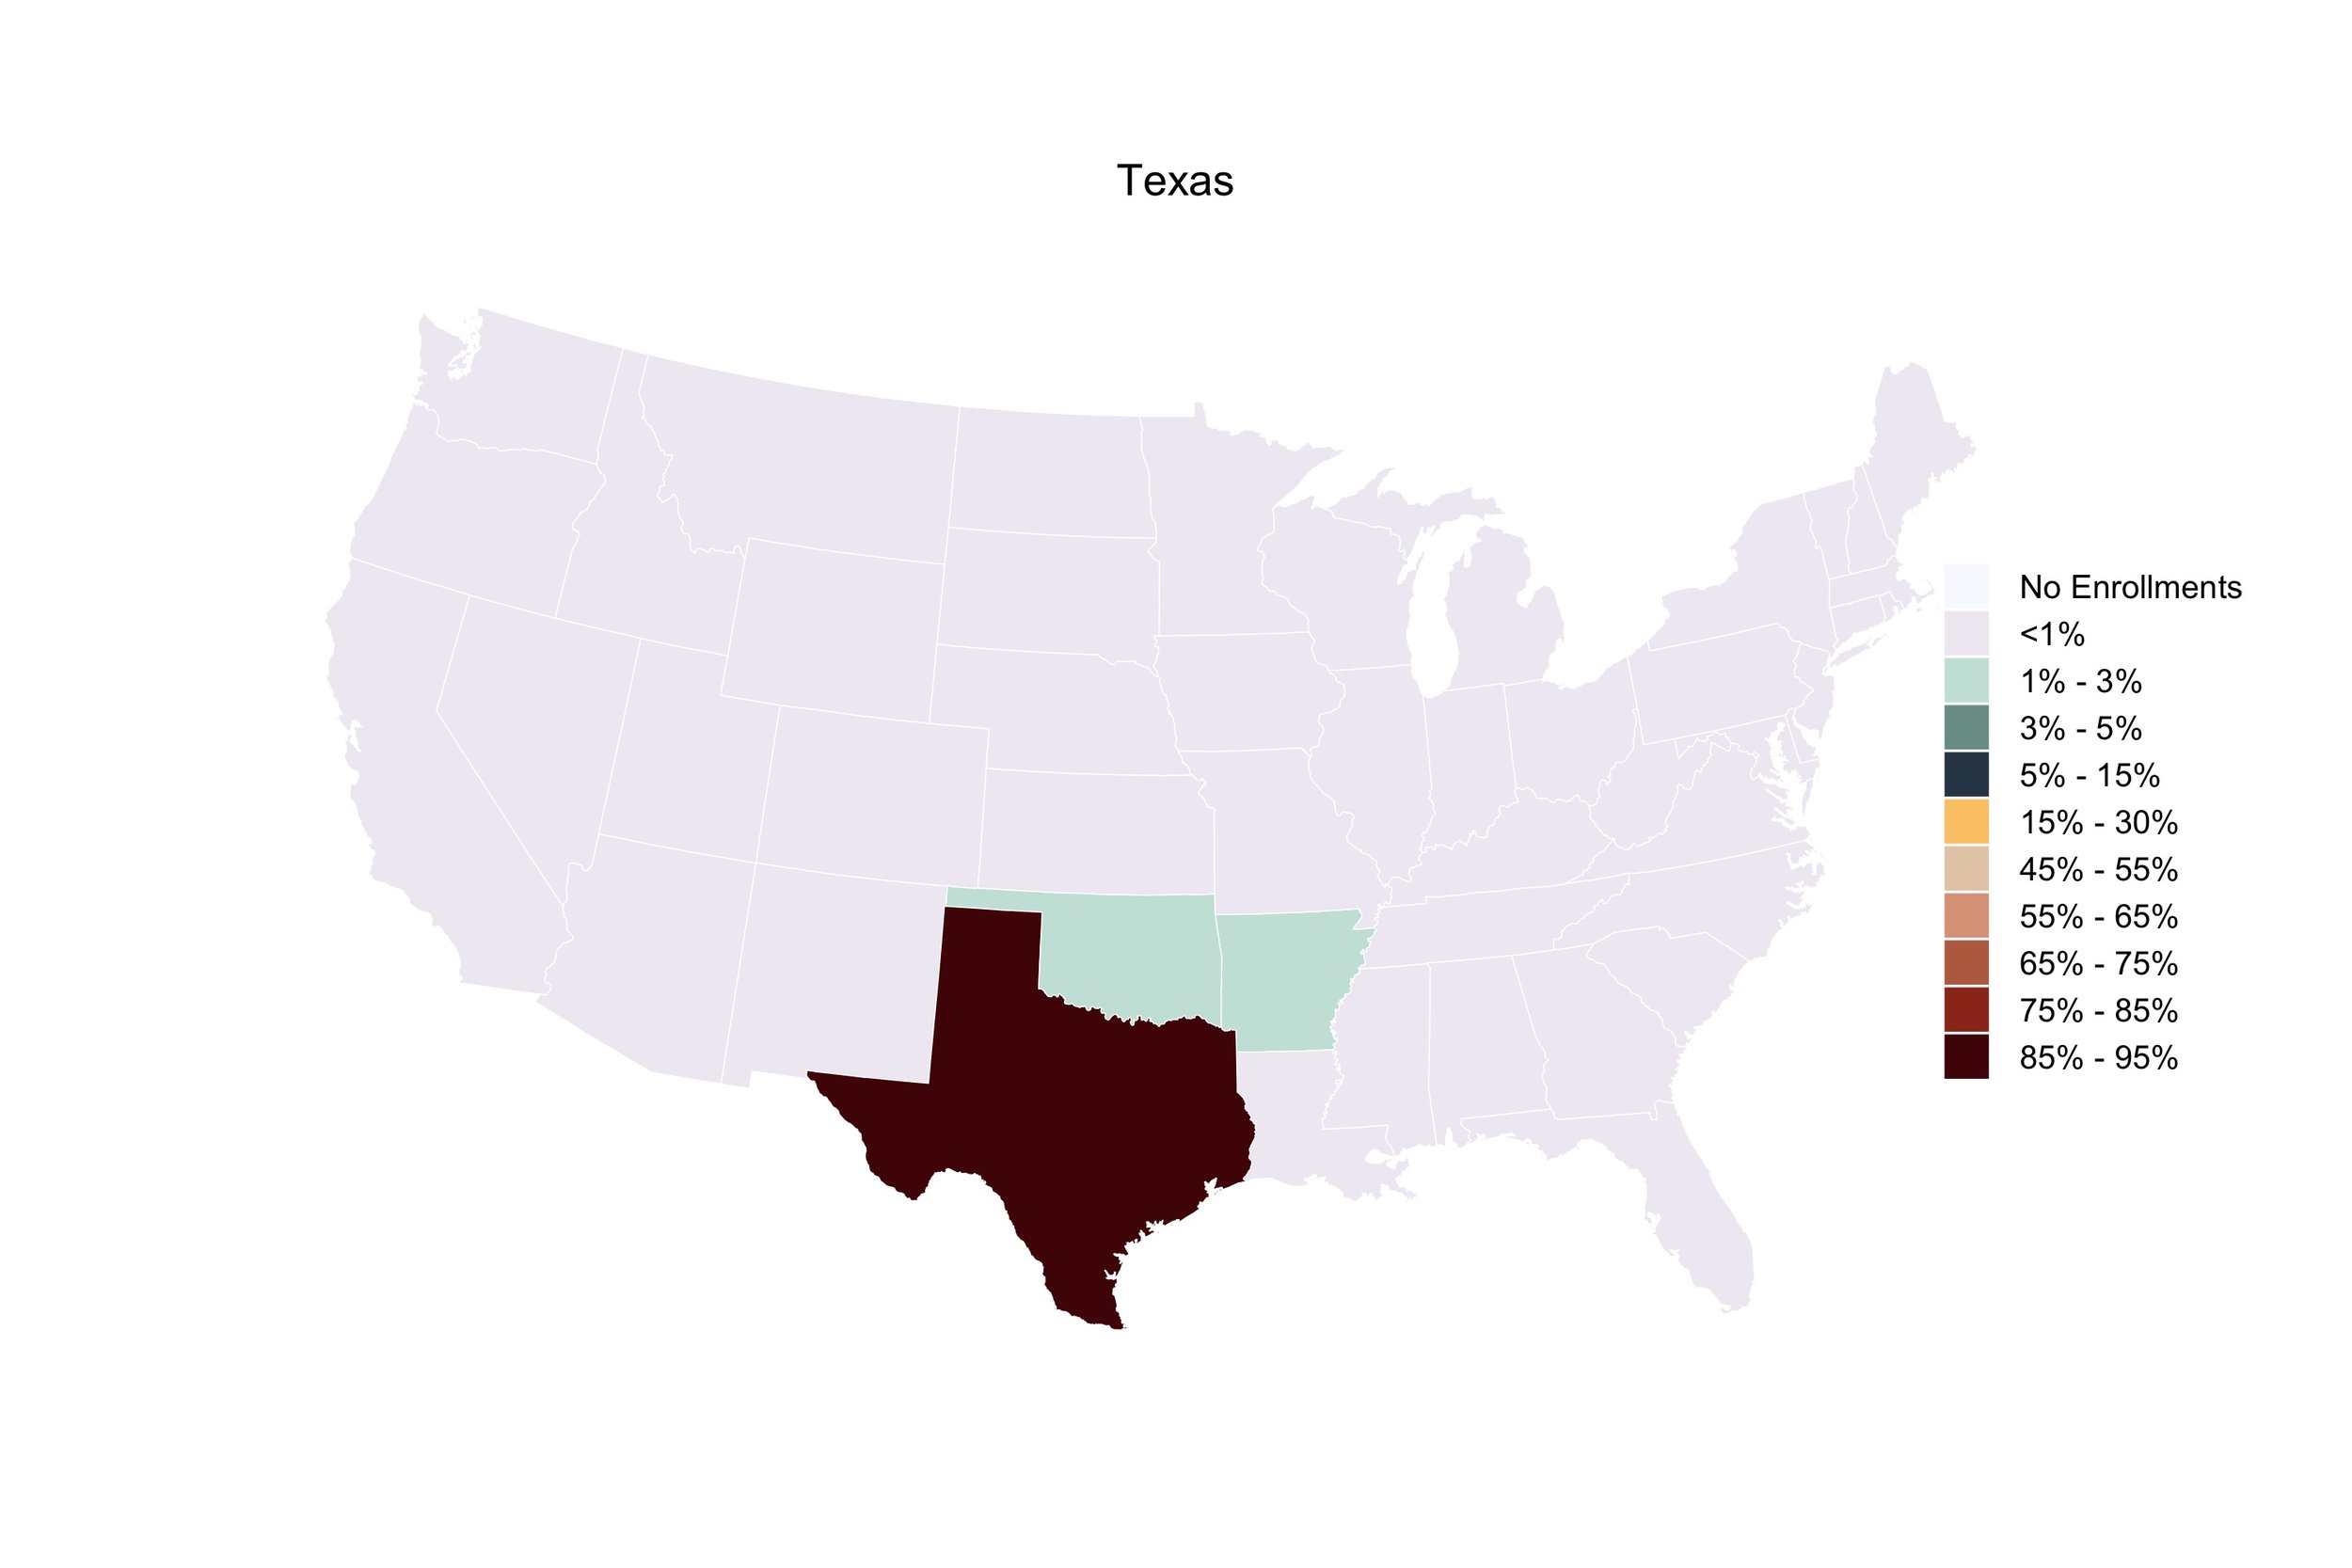
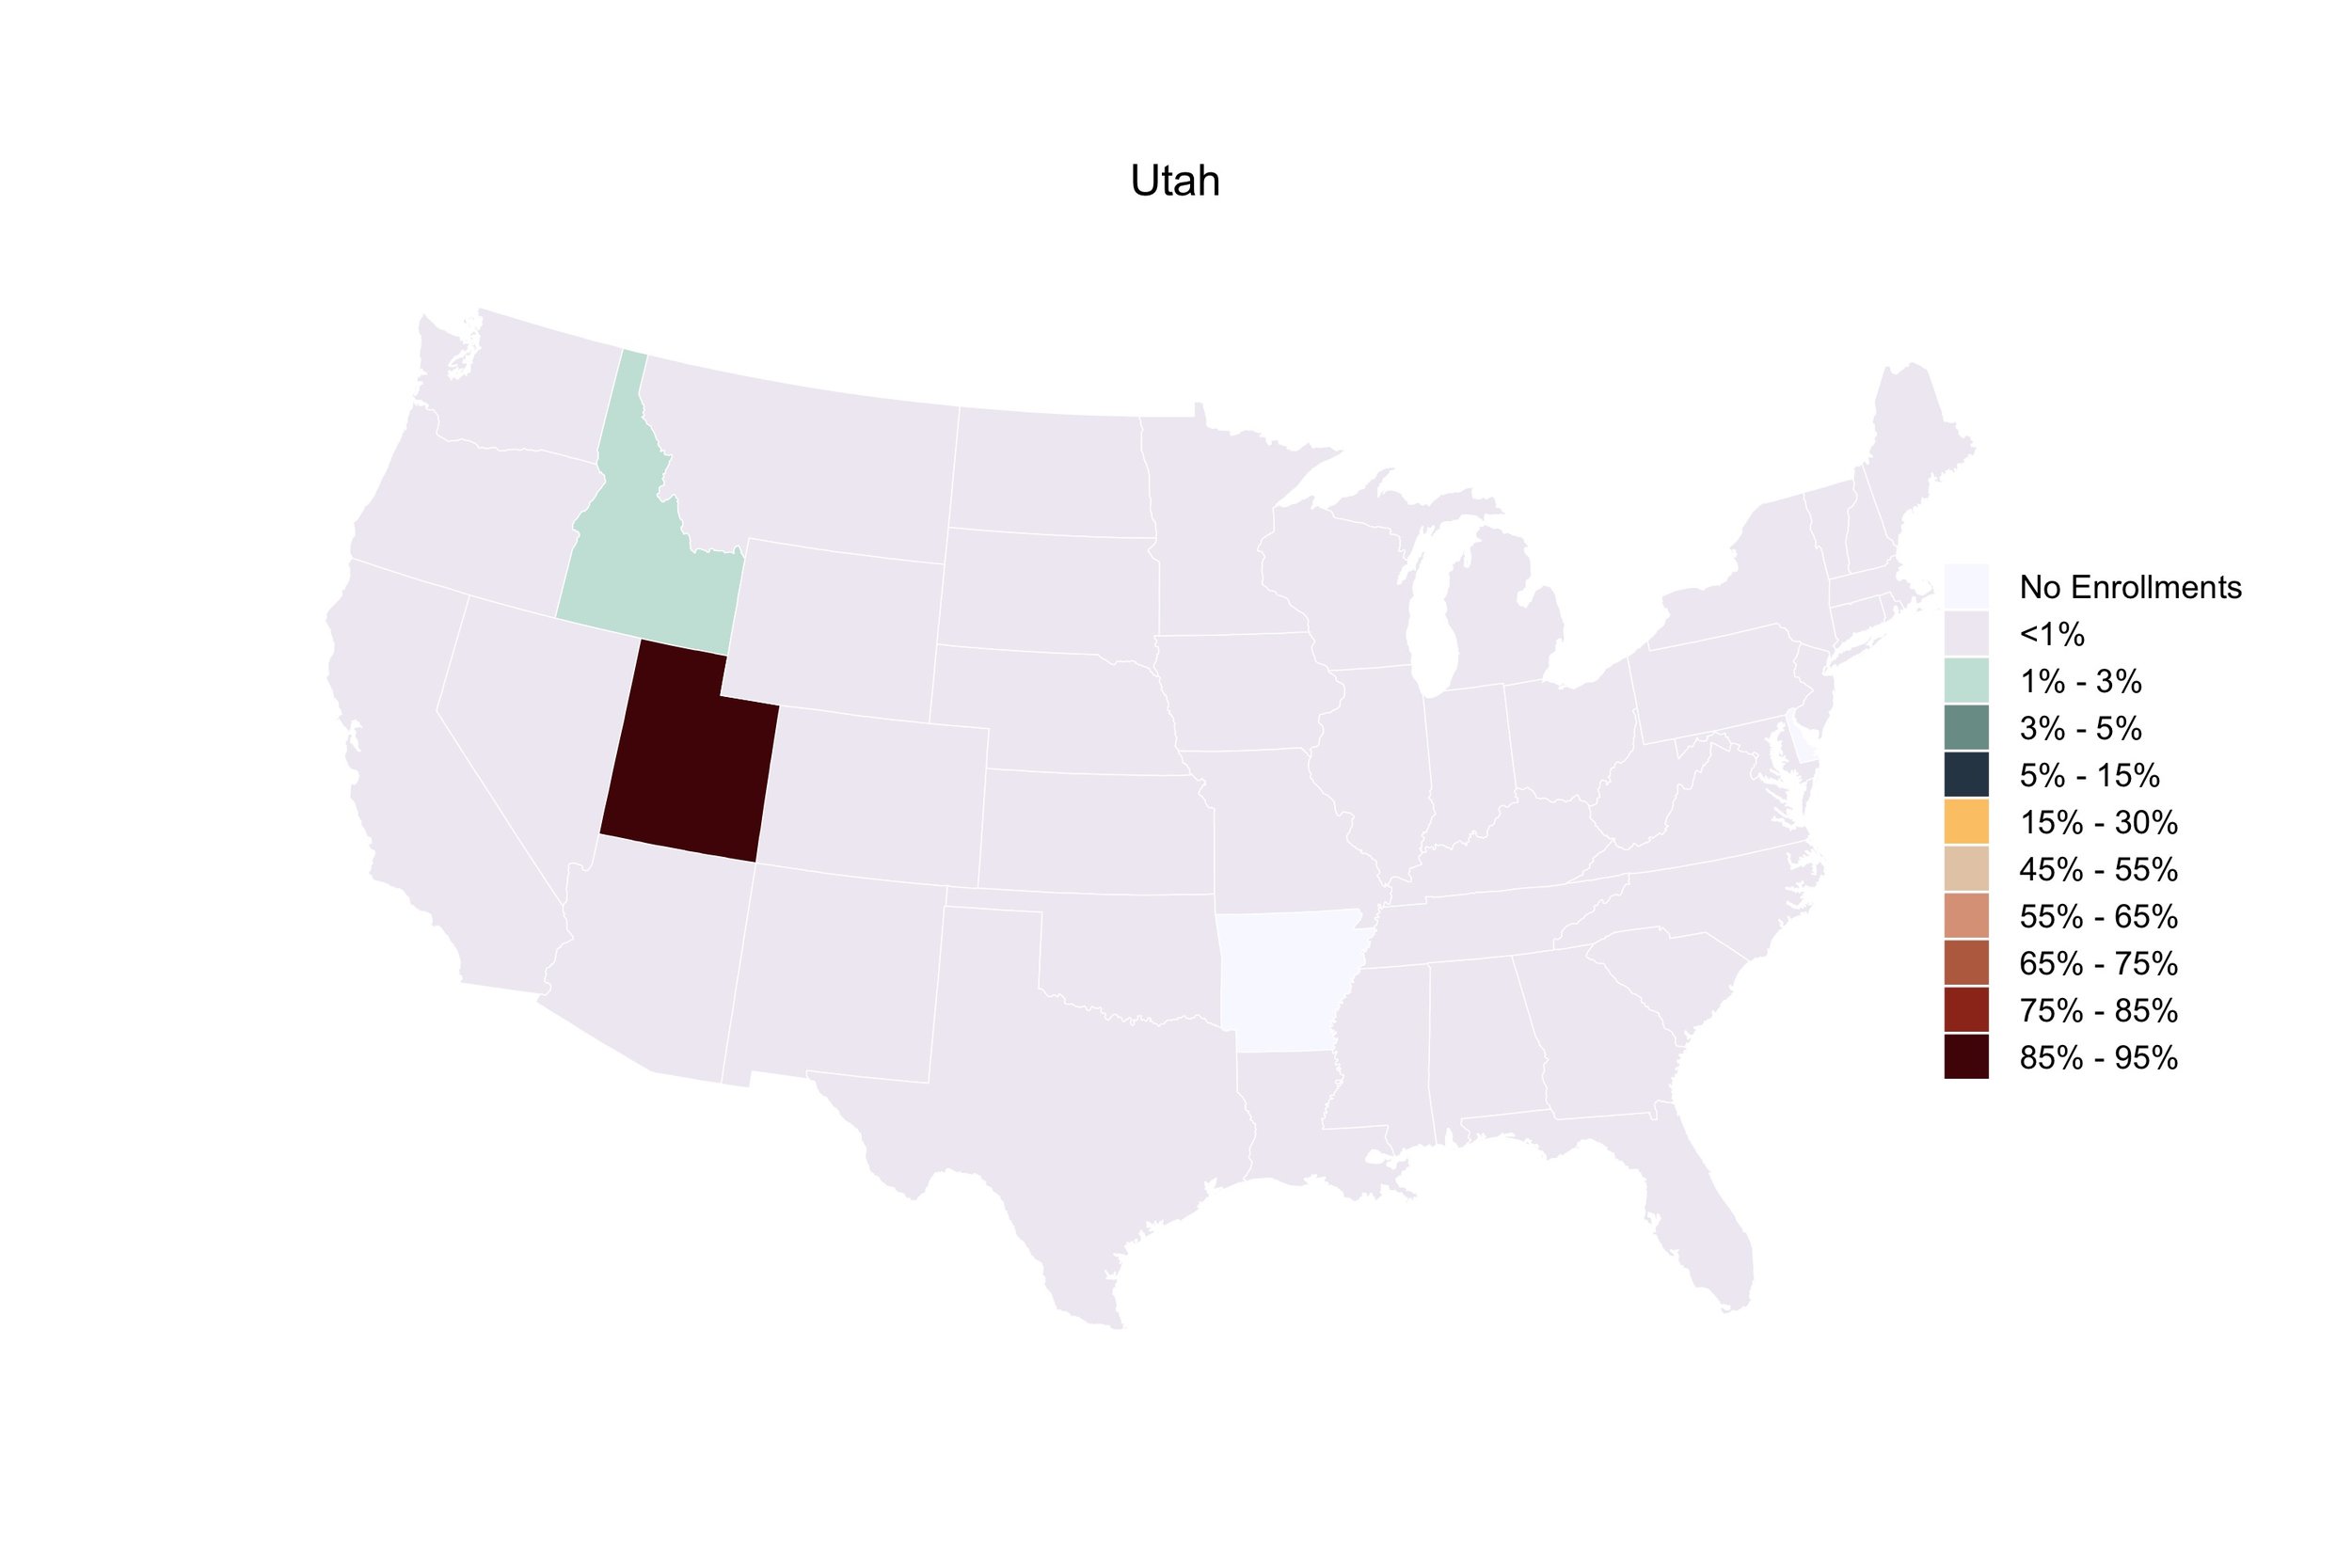
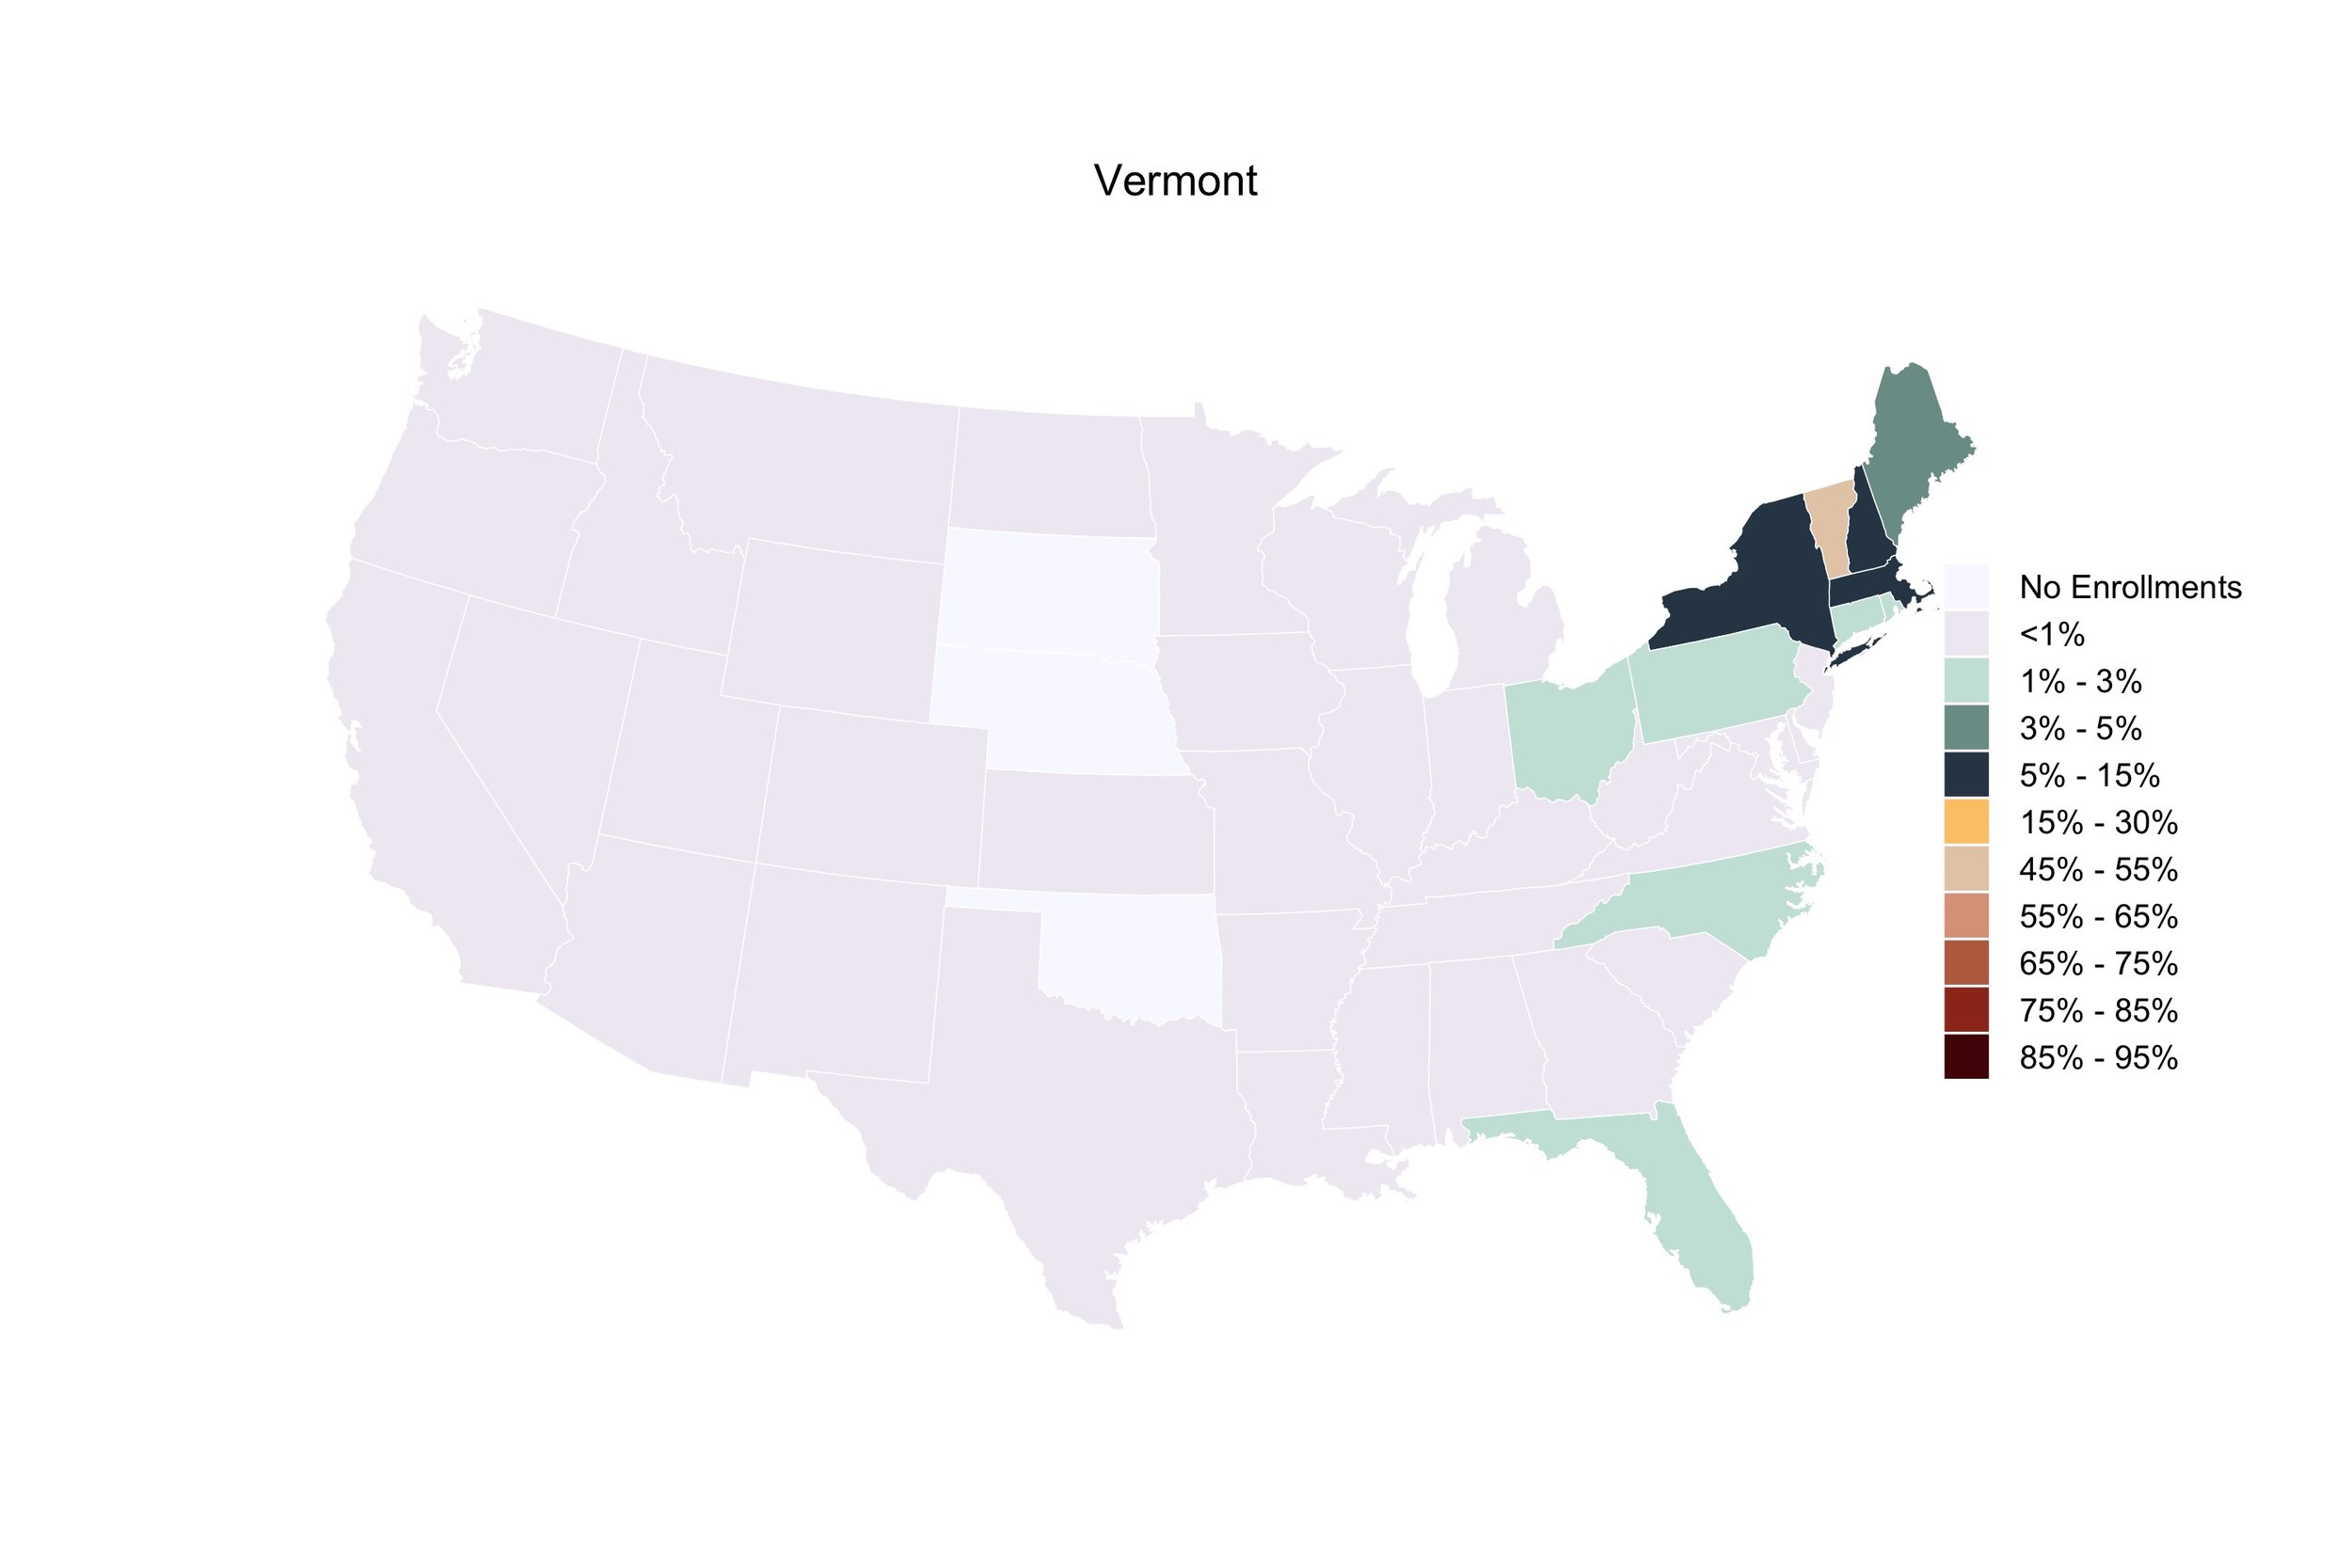
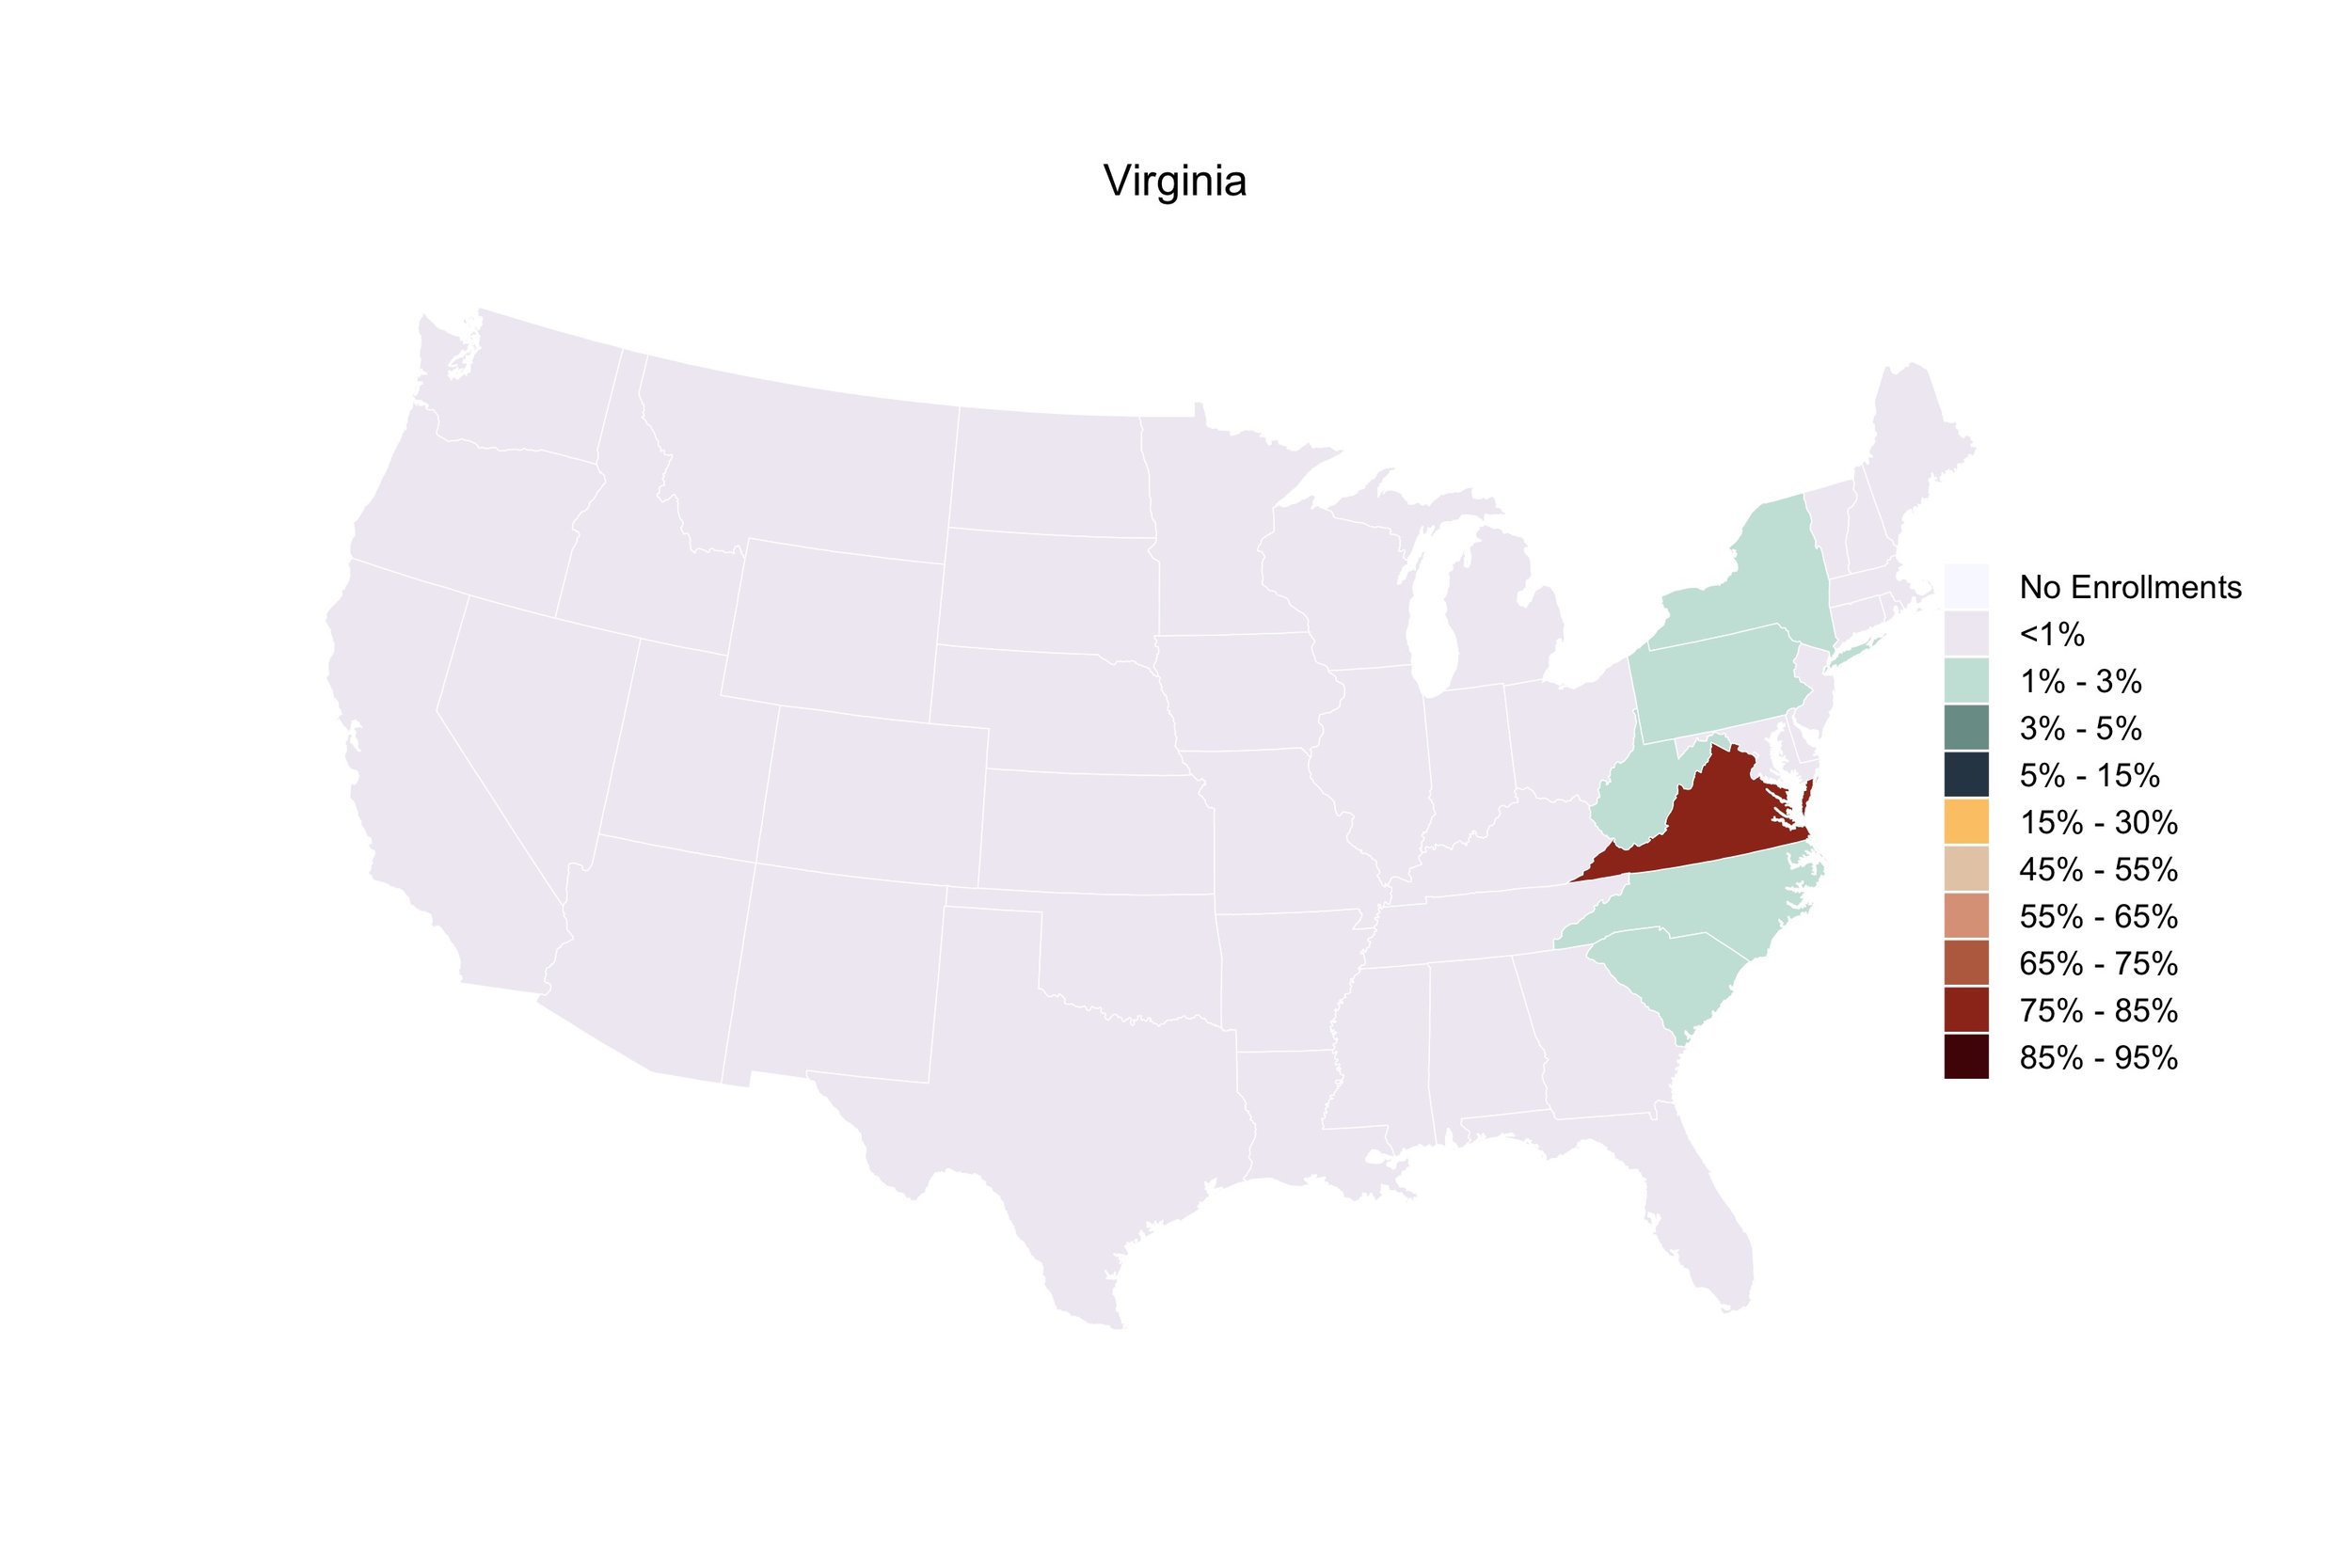
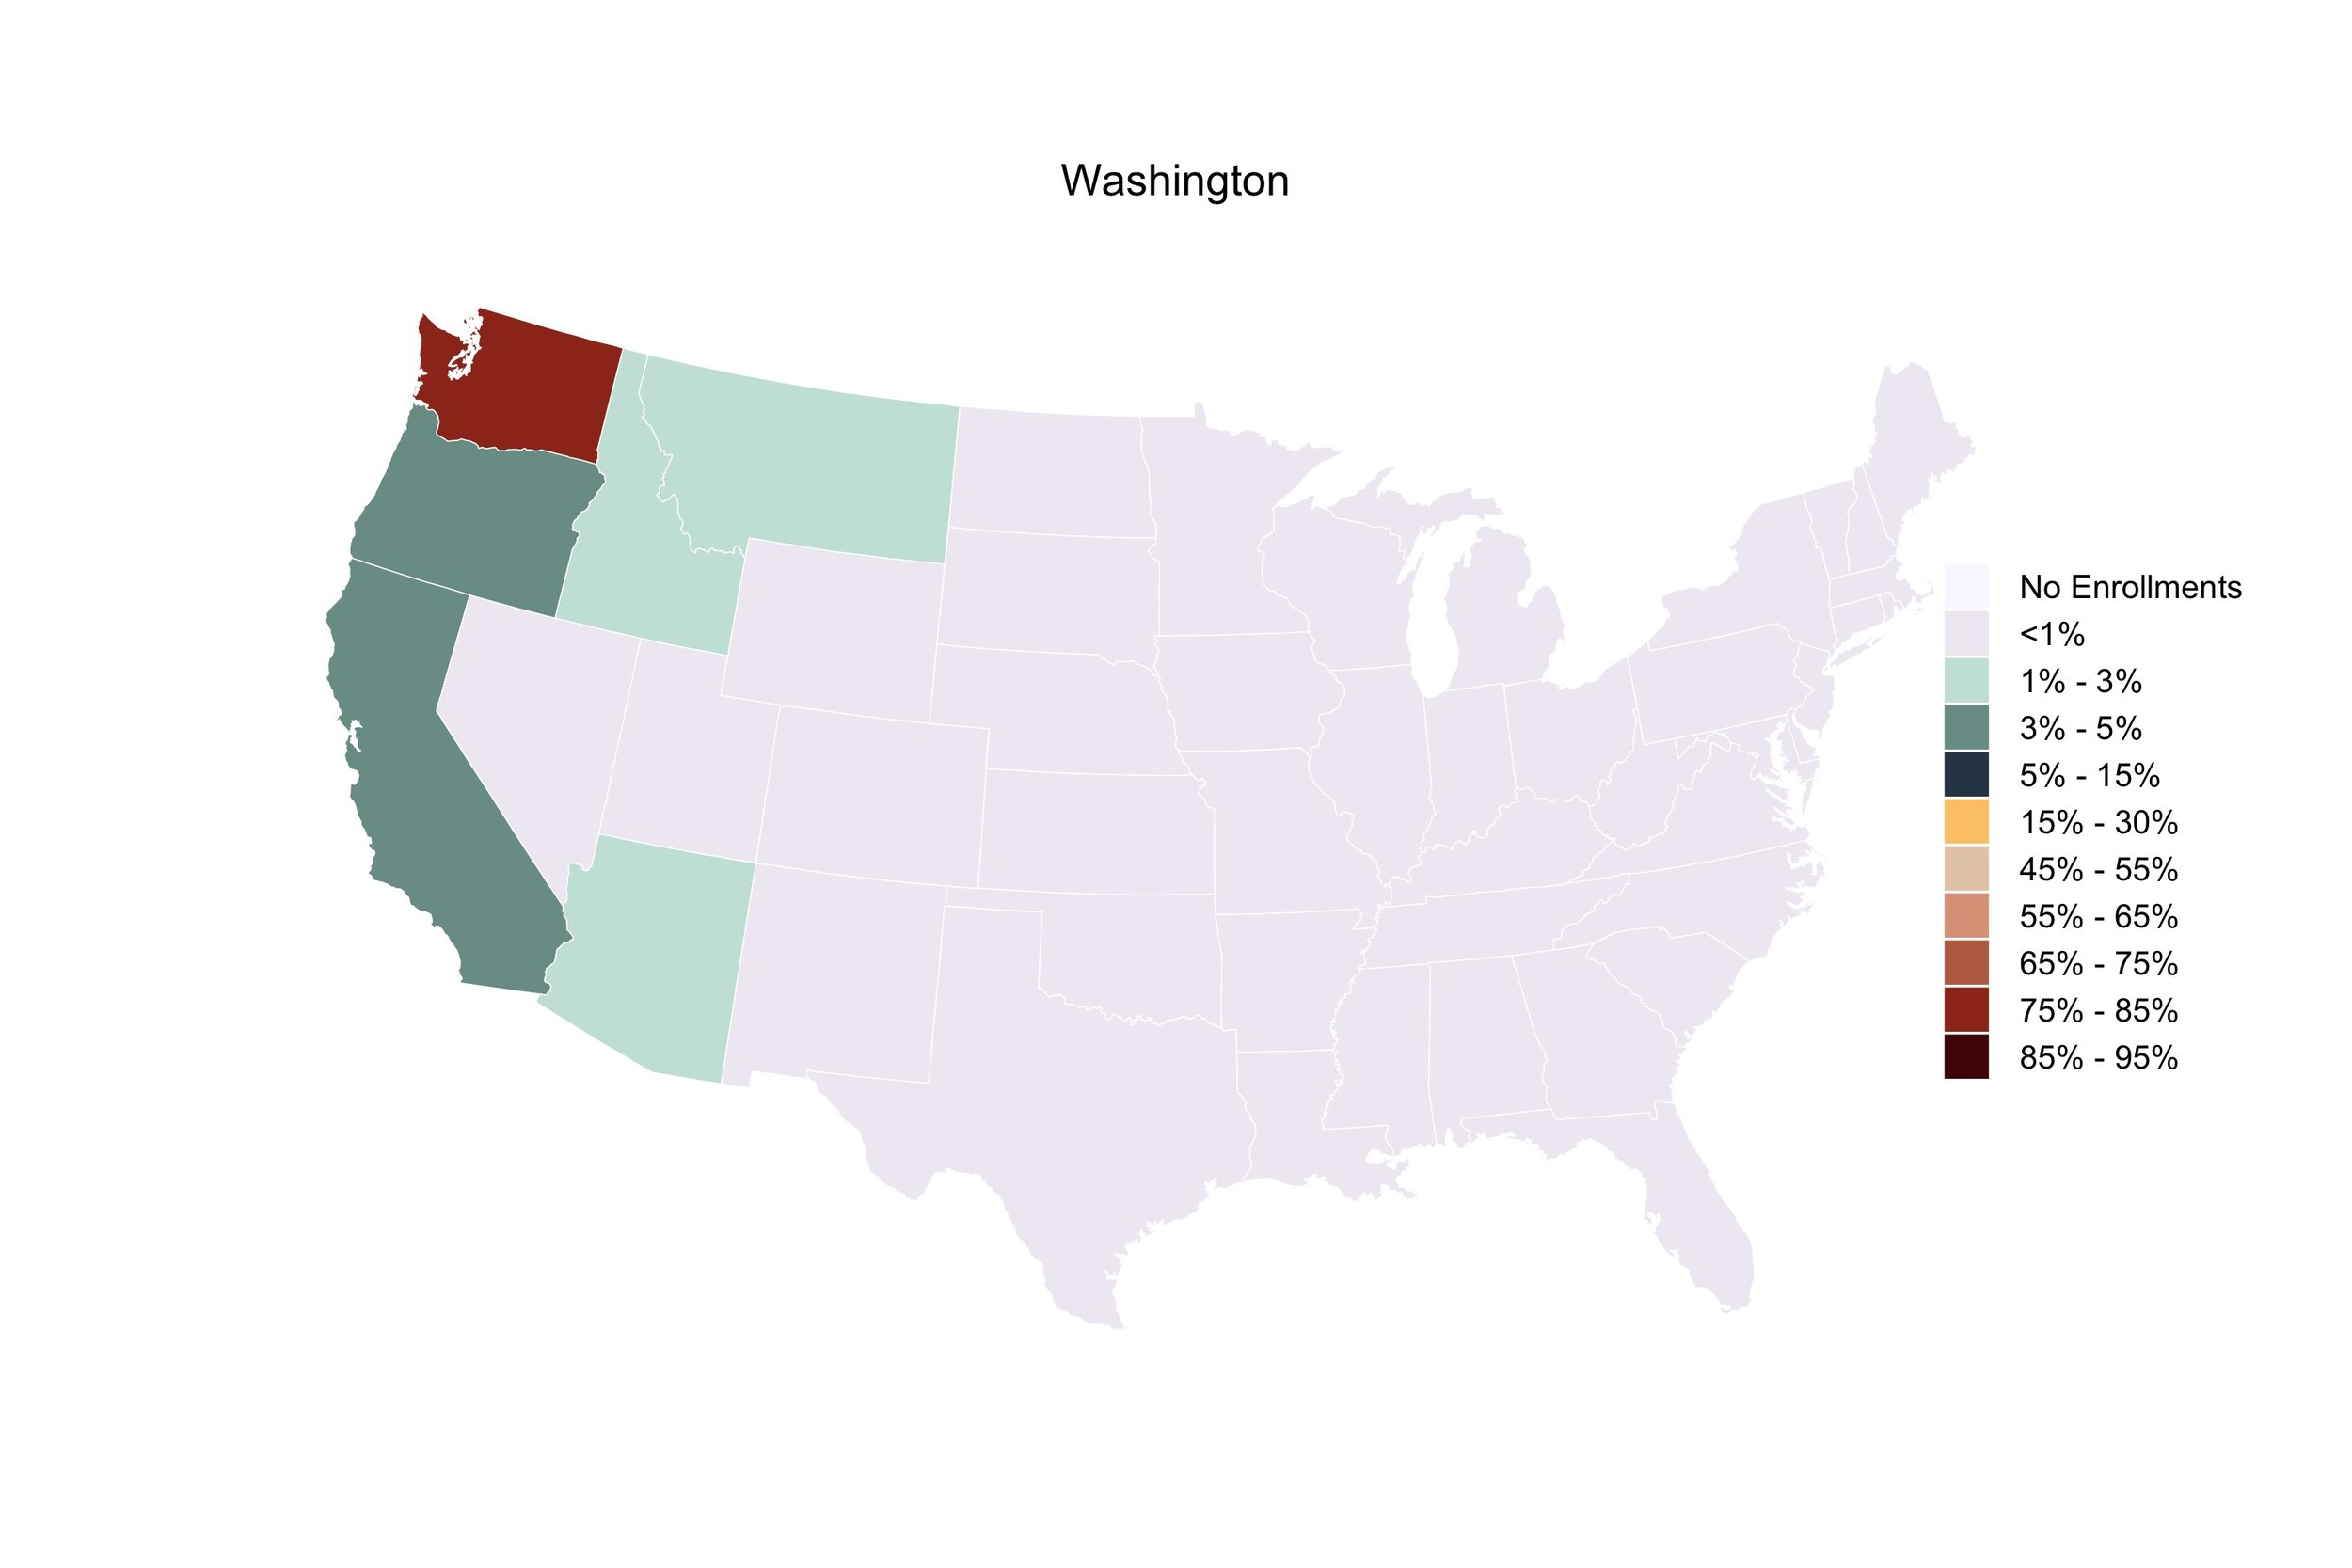
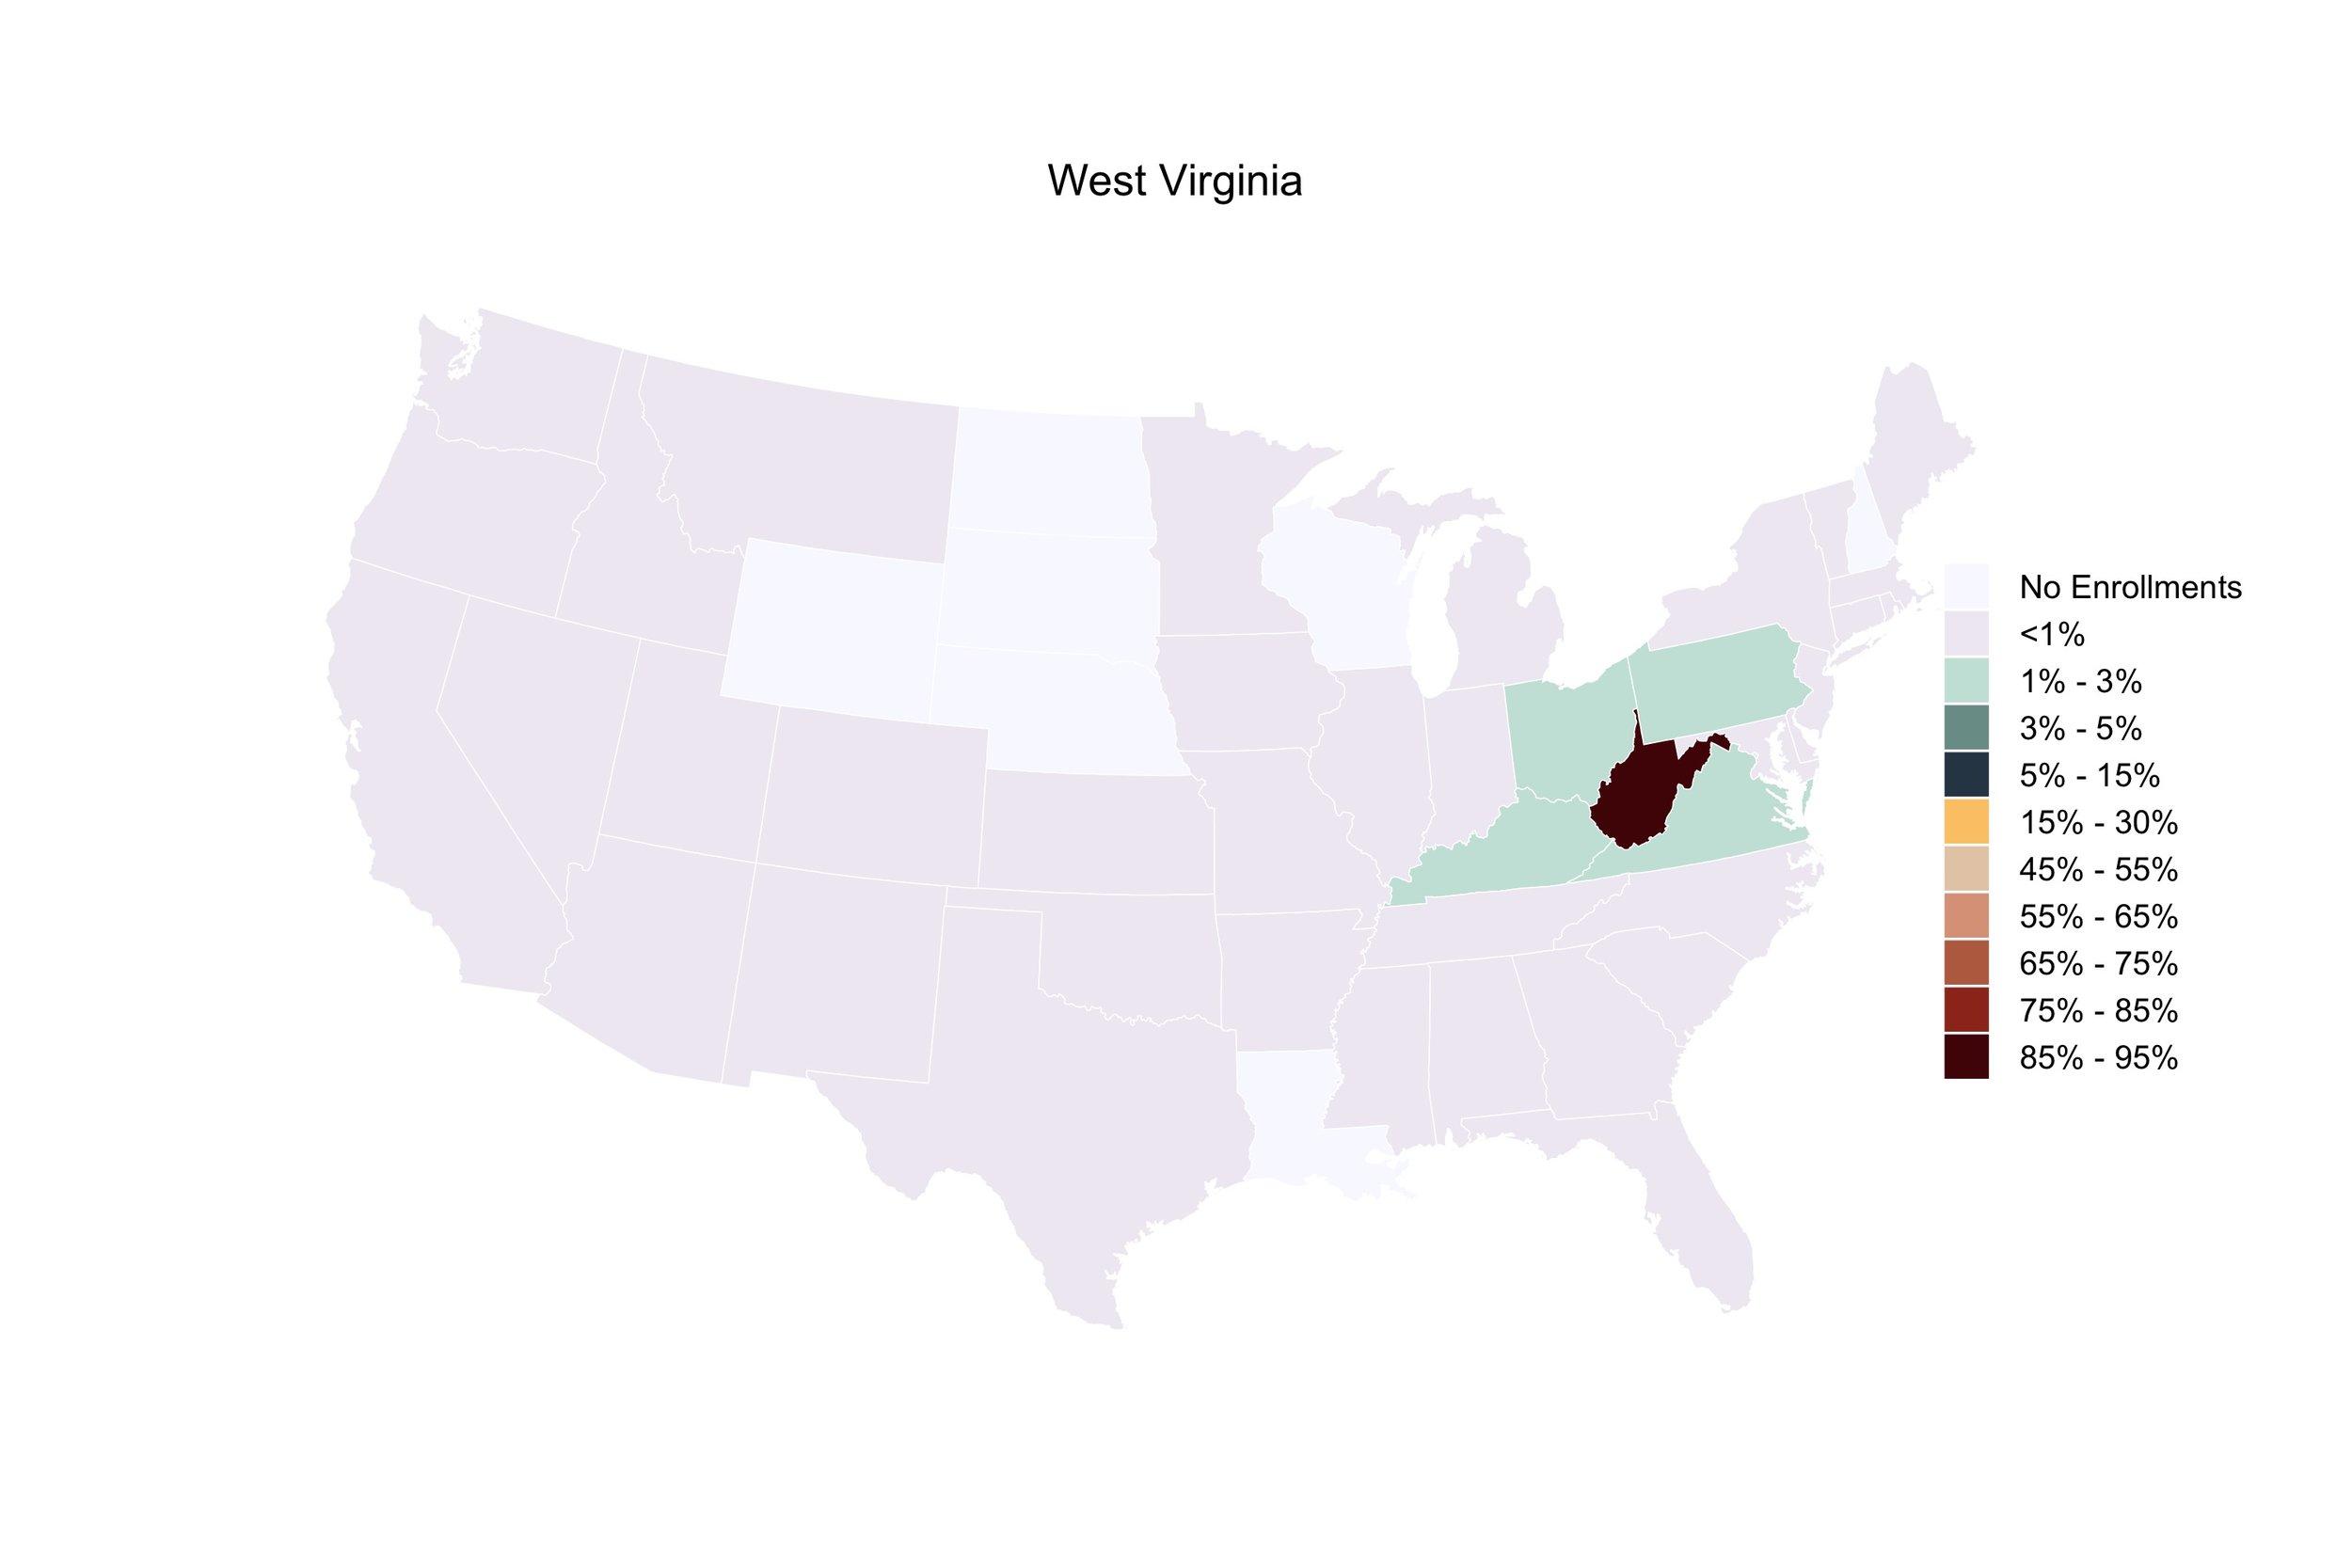
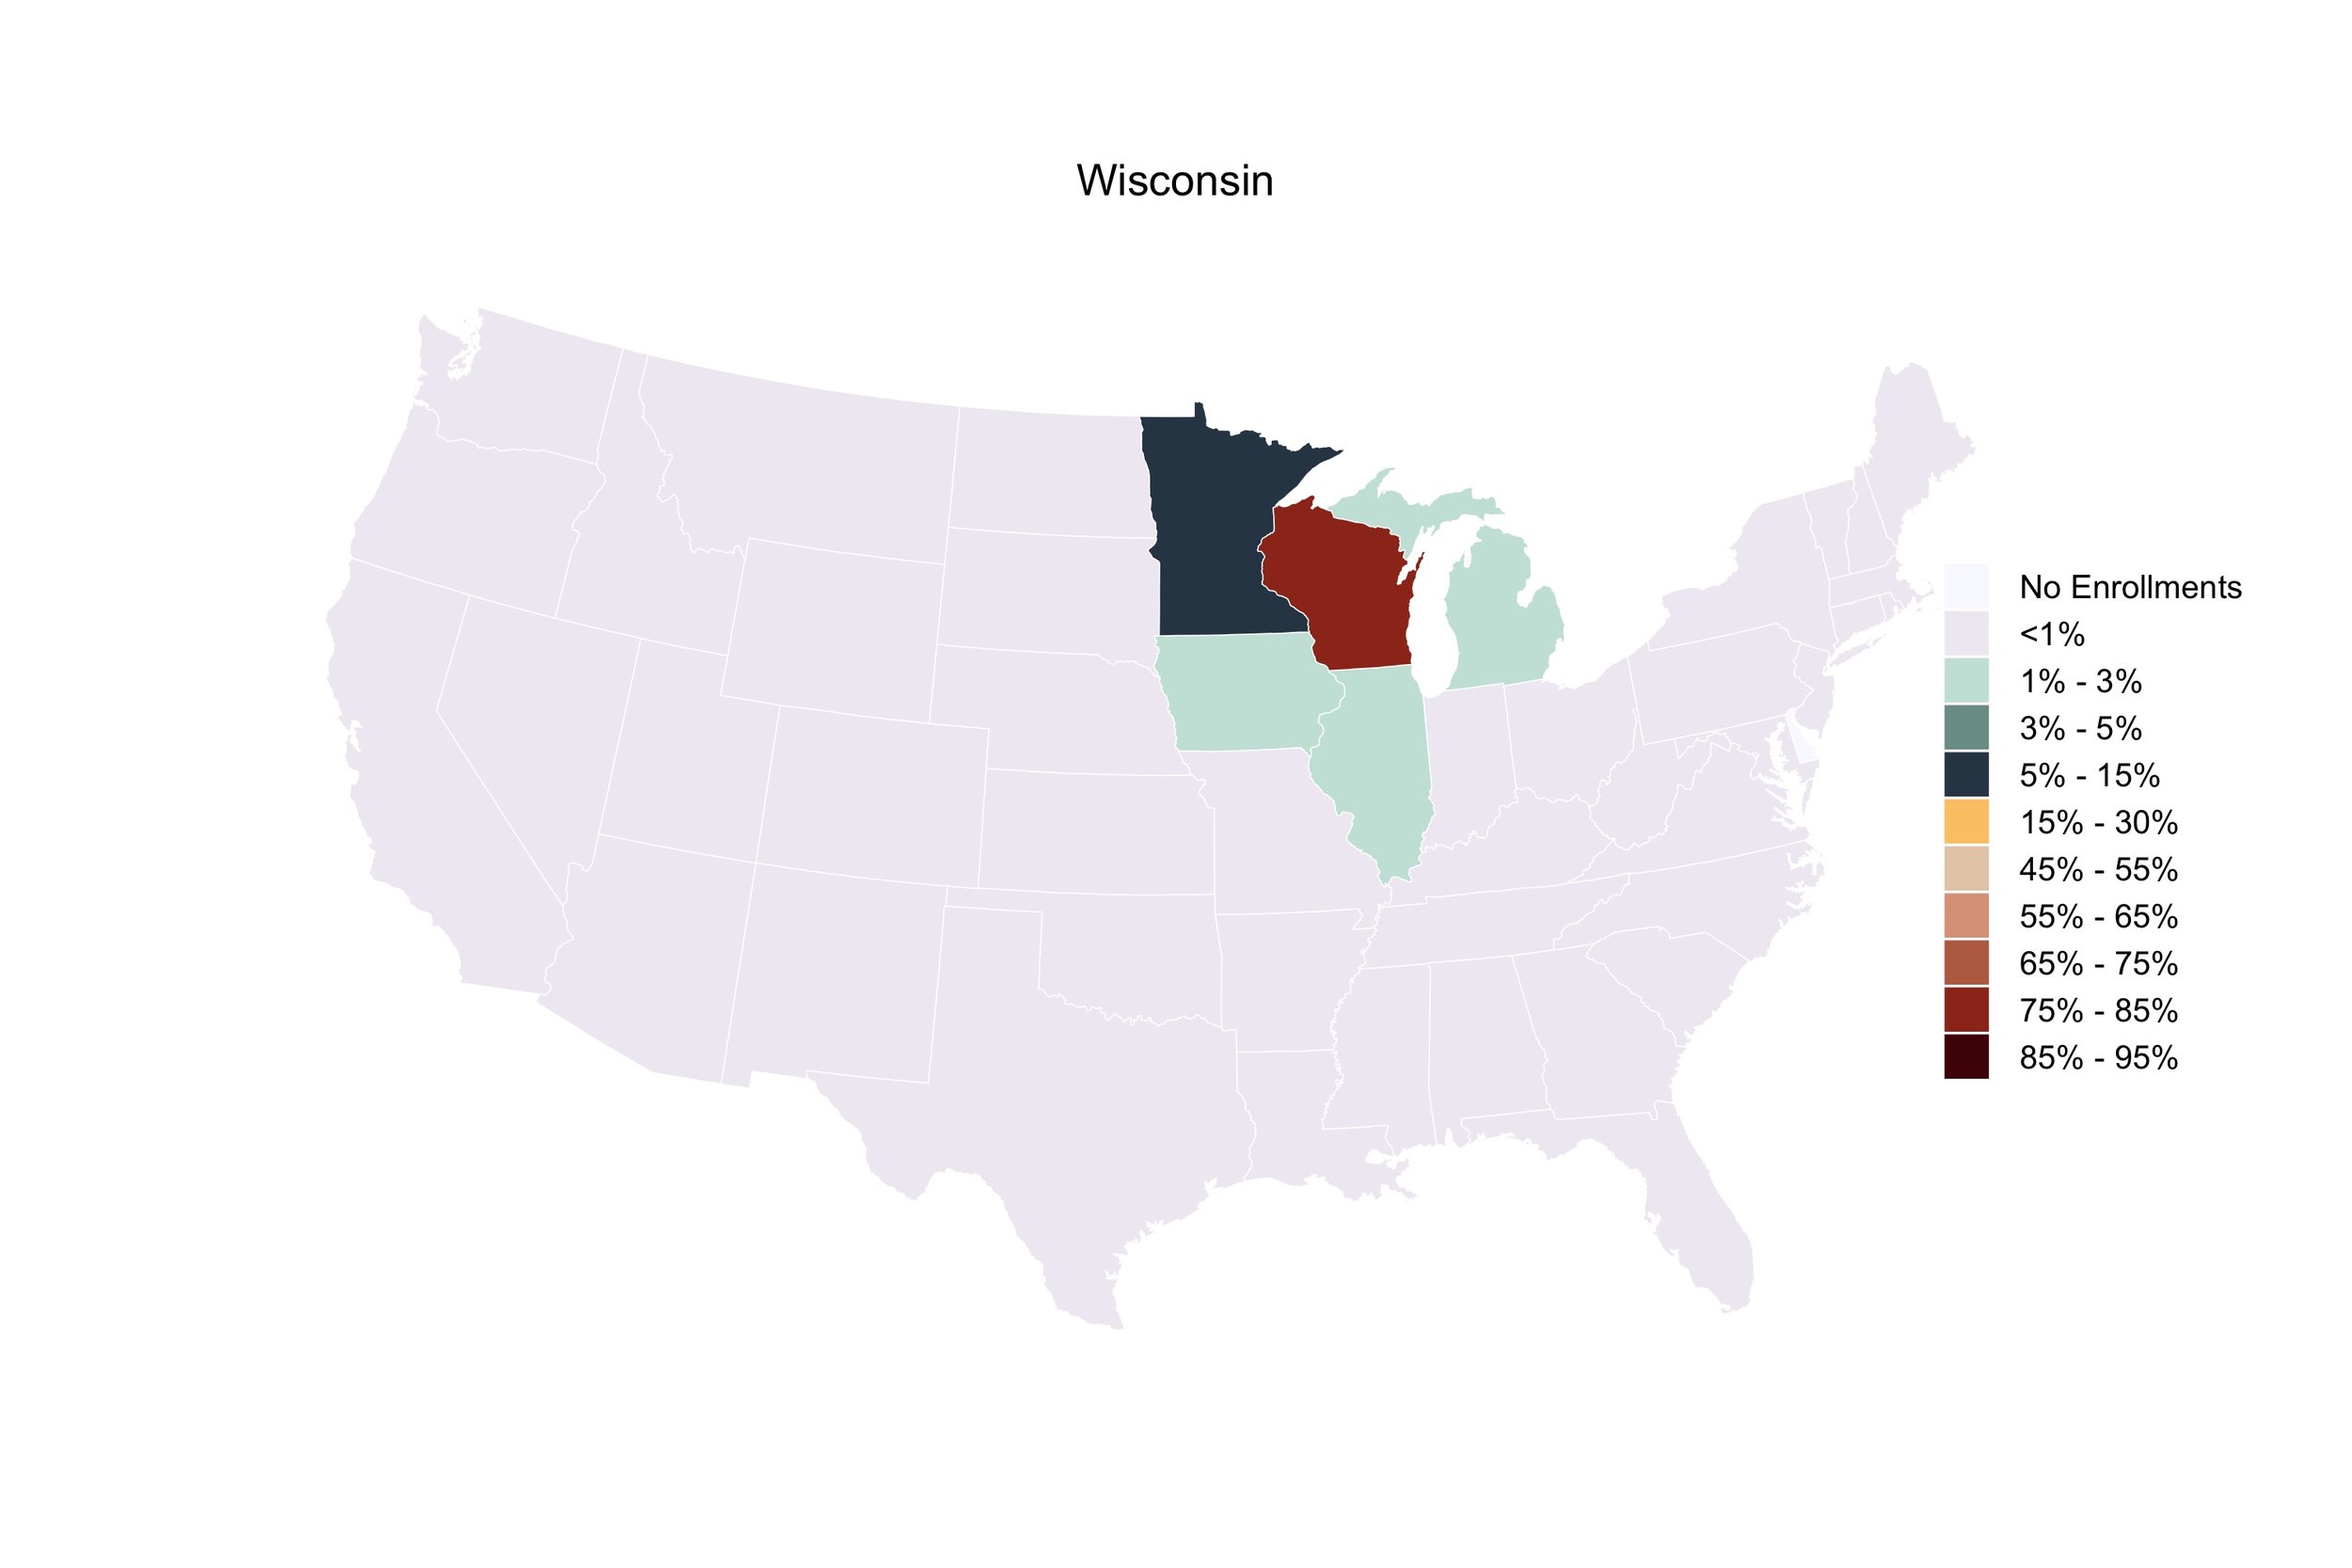
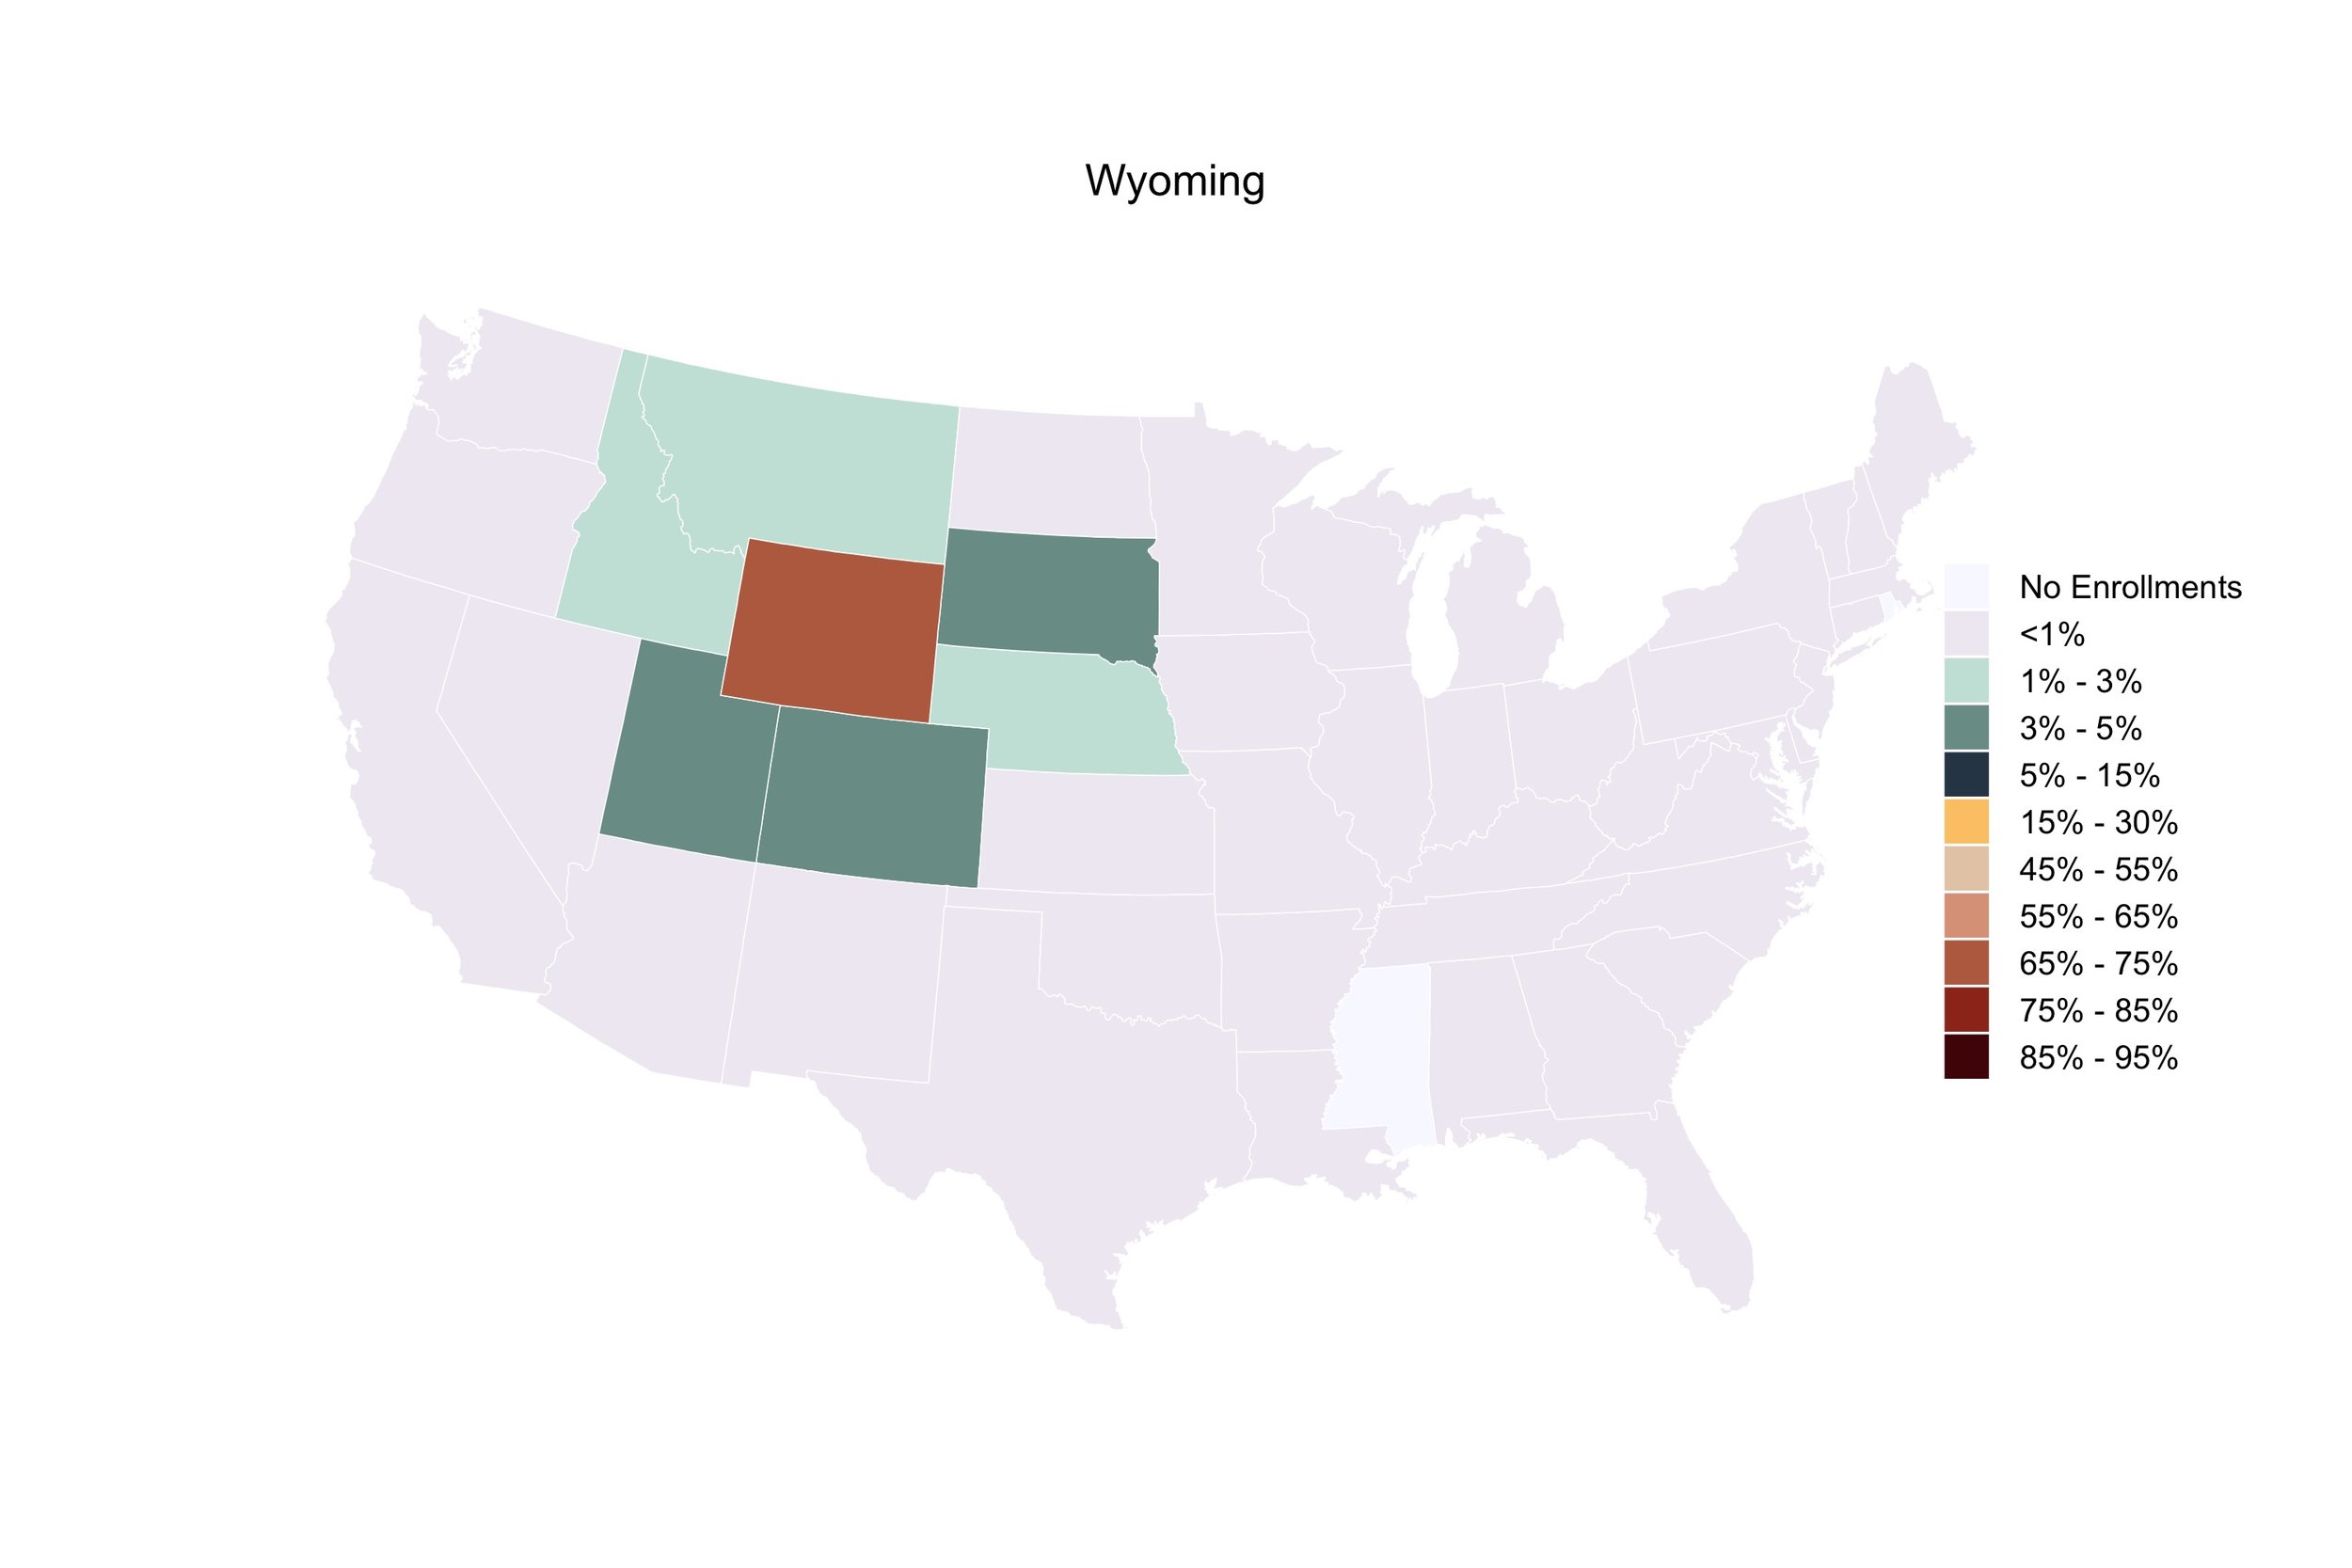
Source: Integrated Postsecondary Education Data System (IPEDS), Spring 2017, Fall Enrollment (EF) Survey. Notes: Calculations include all first-time degree/certificate-seeking undergraduate students who graduated from high school in the past 12 months and attend a U.S. degree-granting postsecondary institution (i.e., awards associate degree or higher) that participates in Title IV federal financial aid programs.