Going With the Flow: Following Student Out-Migration to College
In fall 2018, 80% of first-time degree/certificate-seeking undergraduates remained in their states of residence to attend college, while 20% out-migrated to attend college in a different state. Where did this minority of geographically mobile students go? The following visualizations explore student out-migration to college using the most recent national data on enrollment and residence from the Integrated Postsecondary Education Data System. Exhibit A is a choropleth map with each state colored to reflect the share of residents out-migrating to attend college. Exhibit B is a gallery of flow maps that visualize the migratory patterns of each state’s population of college-goers who leave the state to attend college elsewhere. Finally, Exhibit C presents an interactive data table listing the top 25 out-of-state college destinations (by out-migration enrollment count) for each state. All exhibits reflect recent high school graduates who attended college for the first-time and sought a degree or certificate in fall 2018.
Exhibit A: Percent Student Out-Migration to College, by State of Residence: Fall 2018
Among the 50 states, the share of first-time college-goers who out-migrated to attend college in fall 2018 ranged from 7% in Mississippi to 53% in Vermont. The District of Columbia, with its limited number of postsecondary institutions and geographic proximity to suburban Virginia and Maryland, is an outlier with 81% of its residents out-migrating to attend college. Thirty-five states had fewer than 25% of their college-going residents out-migrate to attend college.
Explore the interactive choropleth map below to view additional information on the number of each state’s residents who out-migrated and the number of unique postsecondary institutions and states to which they traveled.
Notes: Exhibit includes U.S. degree-granting institutions that participate in Title IV federal financial aid programs. Student counts include U.S. residents who are first-time degree/certificate-seeking, completed high school within twelve months of fall enrollment, and out-migrated from their states of residence to attend college. Source: Integrated Postsecondary Education Data system, Fall Enrollment (EF) survey, Spring 2019. Author’s calculations.
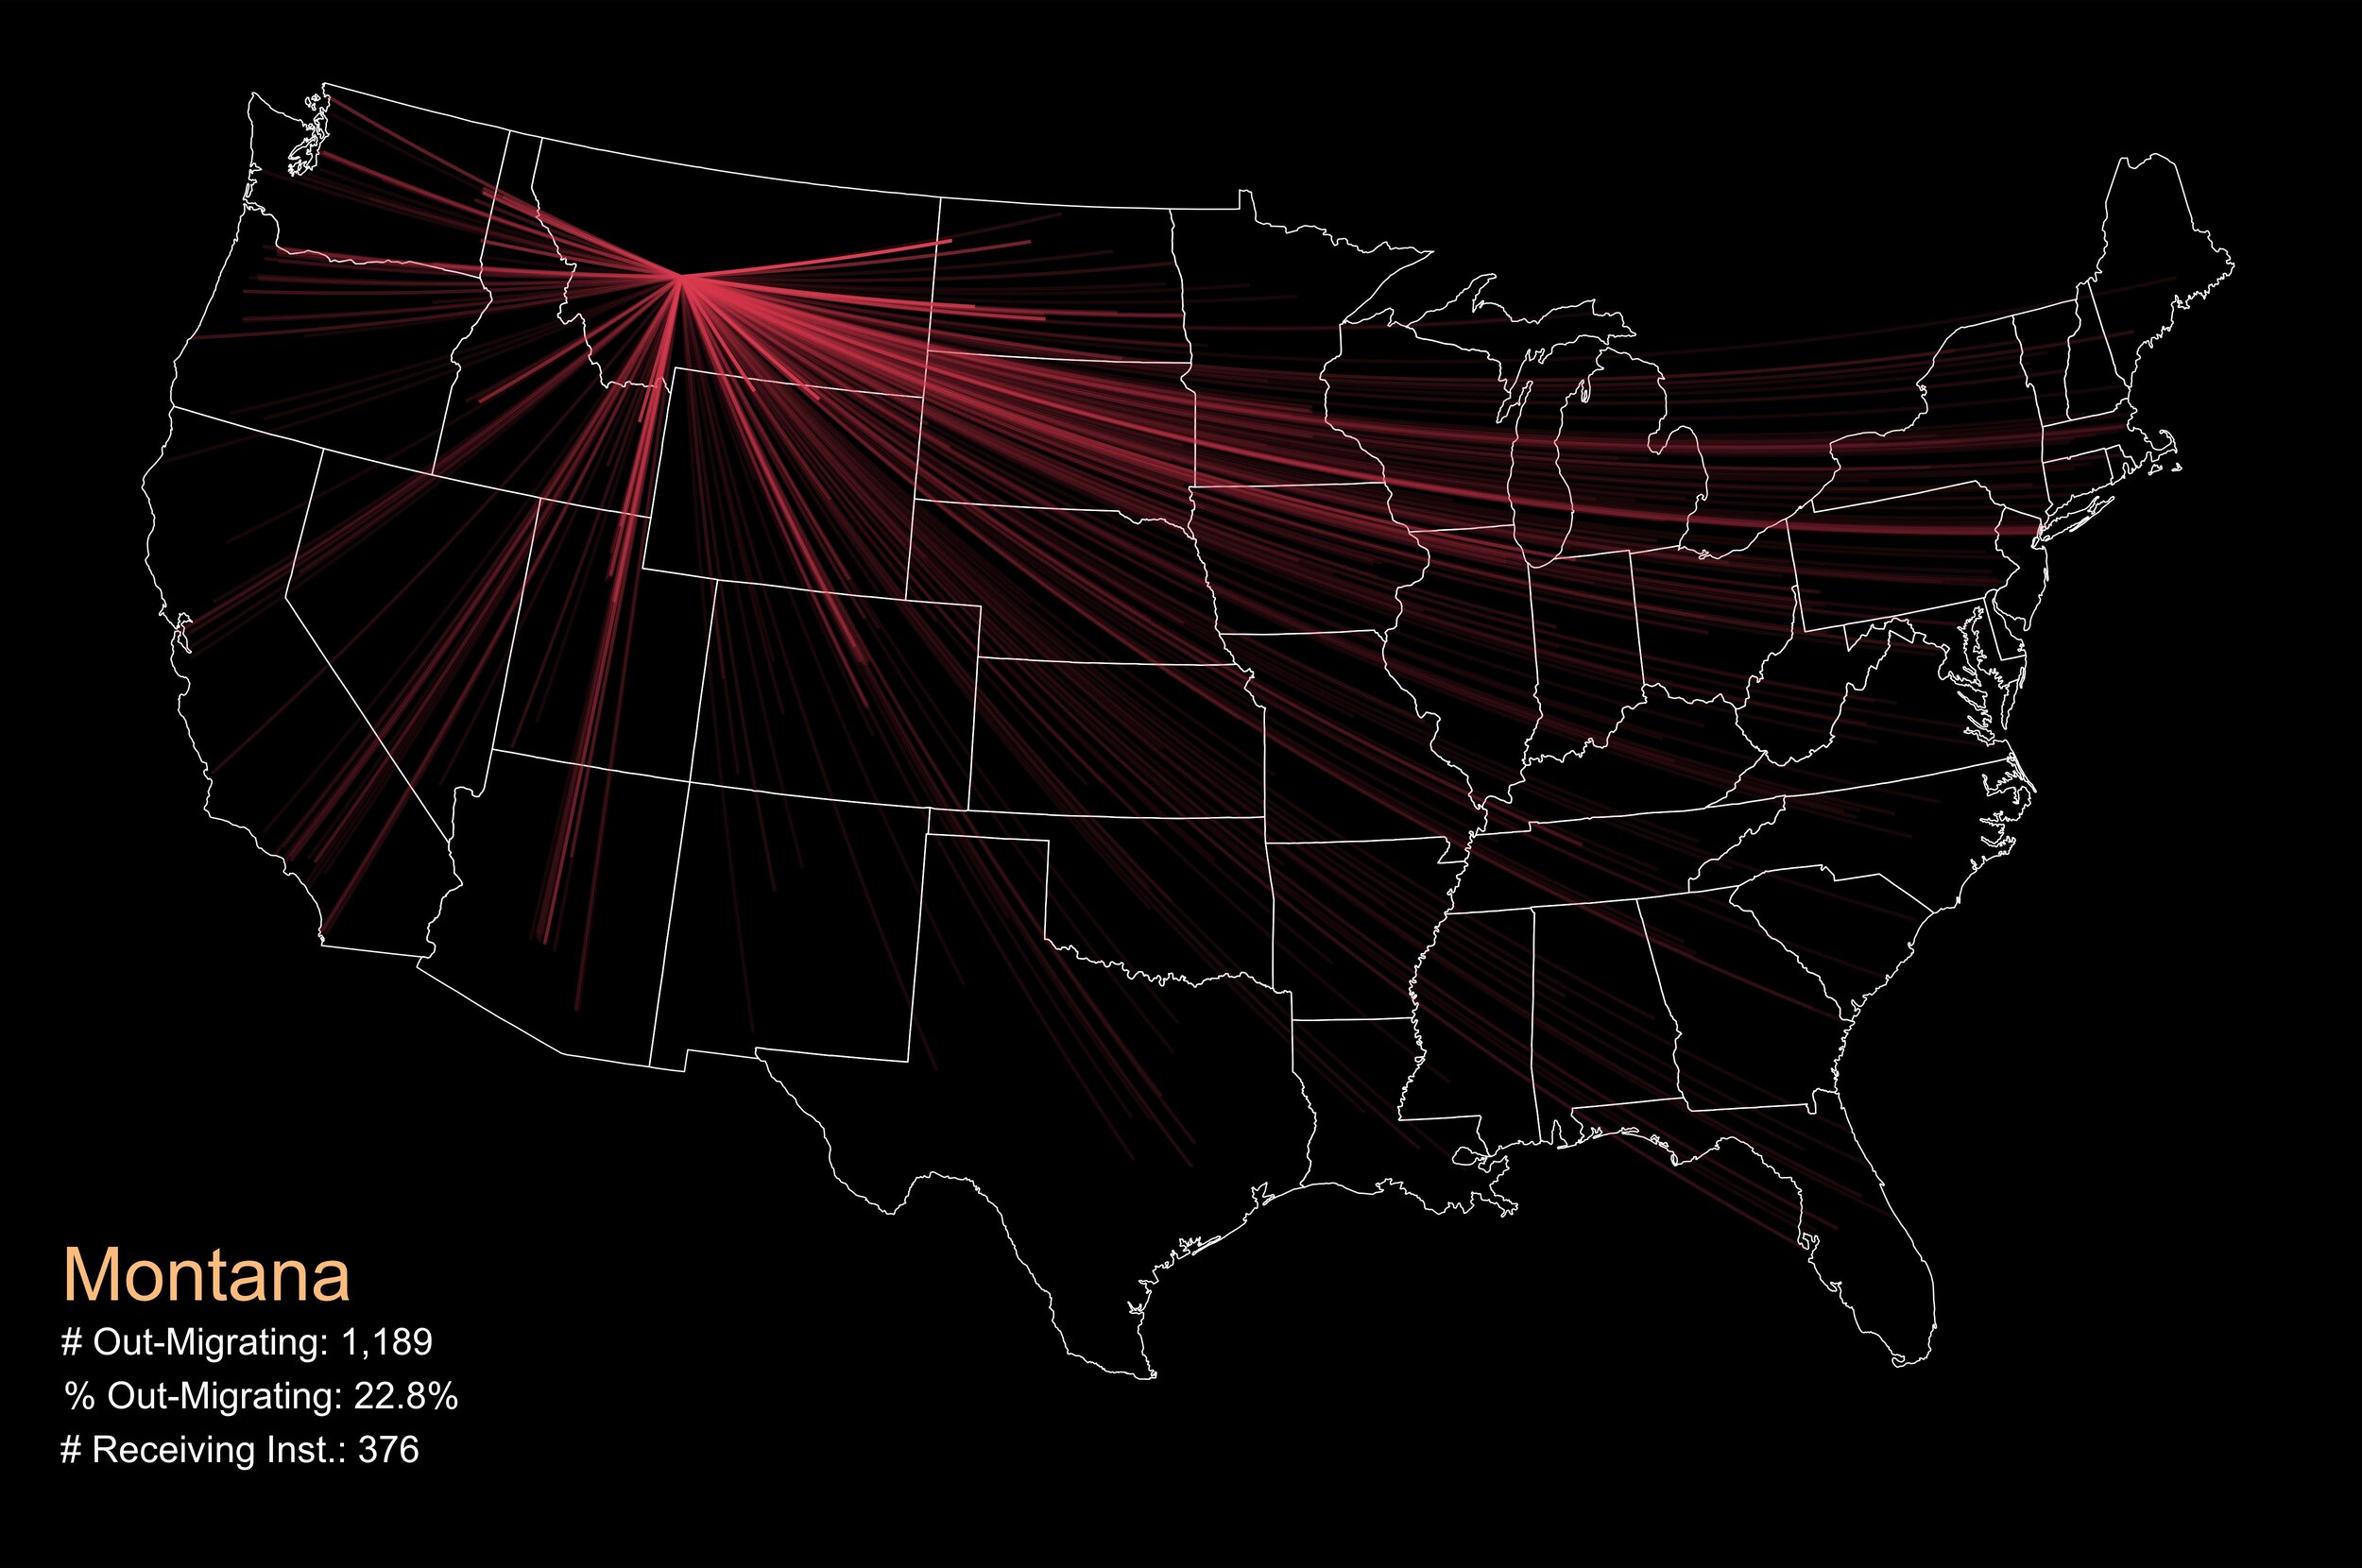
Exhibit B: Student Out-Migration Flows to College, by State of Residence: Fall 2018
The number of first-time college-goers who out-migrated to attend college in fall 2018 varied widely, ranging from approximately 700 Wyomingites to more than 38,000 Californians. Following California with the greatest number of out-migrants to college were Illinois (33,000), New Jersey (32,000), New York (30,000) and Texas (25,000). Thirty-six states and the District of Columbia had fewer than 10,000 residents out-migrate to attend college.
The map gallery below visualizes the geographic migration patterns of each state’s residents who attended an out-of-state college. Each line reflects a unique college destination, and the weight of the line is proportional to the number of residents who out-migrated to attend that particular college.
Notes: Exhibit includes U.S. degree-granting institutions that participate in Title IV federal financial aid programs. Student counts include U.S. residents who are first-time degree/certificate-seeking, completed high school within twelve months of fall enrollment, and out-migrated from their states of residence to attend college. Origin points (i.e., state of residence locations) are operationalized as the geographic coordinates of each contiguous state’s mean population center, as reported by the U.S. Census Bureau. Alaska and Hawaii are excluded from this exhibit for visualization purposes but are included in out-migration counts. Source: Integrated Postsecondary Education Data system, Fall Enrollment (EF) survey, Spring 2019. Author’s calculations.
Exhibit C: Top 25 Out-of-State Colleges, by State of Residence: Fall 2018
While a state’s residents who out-migrate to college enroll at hundreds and up to more than a thousand different colleges, states typically supply only a handful of their residents to most of these out-of-state options. However, there are particular college destinations popular among out-migrants, especially colleges in neighboring states.
The table below displays each state’s top 25 most attended out-of-state colleges among first-time college-goers who out-migrated to attend college in fall 2018. Scroll across the table to reveal additional characteristics about each college including: percent of applicants admitted, published tuition and fees for in- and out-of-state first-time students (recognizing that many states participate in tuition reciprocity programs that reduce out-of-state tuition prices for nonresidents), and percent of students enrolled exclusively in distance education courses (e.g., online classes). Use the navigation arrow(s) at the top right of the table to toggle between states (in alphabetical order).
Notes: Student counts include U.S. residents who are first-time degree/certificate-seeking, completed high school within twelve months of fall enrollment, and out-migrated from their states of residence to attend college. The “% Admitted” column reflects the share of first-time degree/certificate-seeking applicants granted an offer of admission for fall 2019. Institutions that self-report an open admissions policy were assigned a 100% admission rate. Published tuition and fees reflect the 2019–20 academic year in 2019 dollars. The “% Enrolled Exclusively in Distance Education” column reflects the share of total enrollment in fall 2018 that enrolled only in courses delivered via distance education (i.e., online classes). Source: Integrated Postsecondary Education Data system, Fall Enrollment (EF) survey, Spring 2019; Admissions (ADM) survey, Winter 2019; Institutional Characteristics (IC) survey, Fall 2019. Barron’s Admissions Competitive Index, 2014. Author’s calculations.


